


Services on Demand
Article
 English (pdf)
 Article in xml format
 Article references
Indicators

Related links
-
 Cited by Google
 -
 Similars in Google
Share

 Permalink
Water SA
On-line version ISSN 1816-7950
Print version ISSN 0378-4738
Water SA vol.49 n.4 Pretoria Oct. 2023
http://dx.doi.org/10.17159/wsa/2023.v49.i4.4002
RESEARCH PAPER
Cape Town residents' willingness to pay for a secure and 'green' water supply
JK TurpieI, II; GK LetleyII
IEnvironmental Policy Research Unit, School of Economics, University of Cape Town, Rondebosch 7701, South Africa
IIAnchor Environmental Consultants, 8 Steenberg House, Silverwood Close, Tokai 7945, South Africa
ABSTRACT
The City of Cape Town experienced a serious drought between 2016 and 2018 which led to severe water shortages and concerns for the environment. This study took advantage of a period of unprecedented levels of awareness about water security in order to investigate households' willingness to pay (WTP) for reliable water supply and their WTP to avoid environmental damages in securing this supply. Increasing the supply of water from dams and groundwater will ultimately impact on aquatic ecosystems, but alternatives are more expensive. We surveyed 248 households from 105 suburbs and used contingent valuation methods to investigate WTP for both secure and less damaging or 'greener' ways of supplying water. Depending on income level, households were willing to pay 63-127% more for their normal levels of consumption in order to have security of supply, and a further 35-68% more to ensure its environmental sustainability. Based on the relationship between WTP for 7 income categories, the overall WTP for secure water supply under non-drought conditions amounted to some 2.8 billion ZAR/year, which is about 90% higher than pre-drought revenues. Aggregate WTP for securing this supply using options that ensured the protection of the region's rivers and estuaries was 3.3 billion ZAR. These results have an important bearing on water investment and pricing decisions over the longer term.
Keywords: urban water, contingent valuation, willingness to pay, conservation, ecosystem health
INTRODUCTION
Securing adequate water supply is one of the most pressing challenges in the global sustainable development agenda and is particularly important for rapidly growing cities in water-scarce regions of the developing world (UNDP, 2016; Gurría, 2017). Meeting growing demands usually comes at increasing marginal cost, both in terms of water supply infrastructure required and the environment.
South Africa is a water-stressed country in which most surface water resources are already fully utilised or overdrawn (Dallas and Rivers-Moore, 2014; DWS, 2021). With population growth and the increasing probability of drought conditions in the Western Cape under climate change, higher levels of investment in water infrastructure will be required to maintain acceptable levels of assurance of supply for residents of Cape Town. Given that lowest-cost options are chosen first, this is inevitably accompanied by rising costs. If lowest-cost options such as dams are used to their maximum, this will lead to the degradation of downstream aquatic ecosystems (Petts, 1996; SWH, 2009; DWA, 2013) to a minimum acceptable threshold which is a state of poor health (40% of natural). Alternatively, costlier alternative sources such as water recycling or desalination could be used in order to maintain both assurance of supply and higher environmental flows if society desires at least some aquatic ecosystems to be maintained in good health. Government authorities are therefore faced with the decision of how much to invest in securing water supply, taking environment into account, as well as how to price water in order to achieve sustainable use at the household level. This requires some knowledge of societal preferences and potential welfare outcomes.
Cape Town already uses a stepped pricing system which capitalises on wealthier households' higher WTP for water and allows for the supply of free water to the poorest households. However, price levels have been relatively low, and have not been effectively used for demand management, now one of the priorities of the National Water Resource Strategy (DWS, 2021). Due to a lack of adequate forward planning and the worst drought in recorded history, Cape Town experienced unprecedented water shortages, resulting in ongoing water restrictions that started in January 2016 with implementation of Level 2 restrictions. By the time of this study in 2017, restrictions were at Level 3, and residents were asked to use less than 100 litres per person per day. Subsequent to this, further restrictions were imposed up to Level 6, emergency plans were announced and there was an awareness campaign to avoid a 'day zero' in which water supplies would be reduced to communal taps. Meanwhile, the Department of Water and Sanitation has to consider the amount of water to be allocated to the 'Ecological Reserve' in the city's water supply catchments through the Classification Process (Dollar et al., 2010). This process entails consideration of both the costs (reduced water yield) and benefits of increasing the Reserve from the minimum legal requirement. The benefits include better capacity for the supply of aquatic ecosystem cultural services. Many of the benefits have public-good characteristics, making them difficult to value. This includes the non-use value (or 'existence value') of maintaining the health and biodiversity of aquatic ecosystems.
The literature on WTP for improved water services has focused mainly on water quality in developing country contexts (Vásquez and Espaillat, 2016; Jiang and Rohendi, 2018; Makwinja et al., 2019; Ahmed et al., 2022; Bui et al., 2022). Studies in other arid regions have shown that urban consumers are willing to pay a higher price to avoid water restrictions, such as in Texas (Griffin and Mjelde, 2001), California (Koss and Khawaja, 2001) and Australia (Gordon et al., 2001; Cooper et al., 2019; Wilson et al., 2021). There are also numerous studies that suggest that urban residents are willing to pay to maintain the health of their urban rivers (Loomis et al., 2000; Holmes et al., 2004; Shang et al., 2012; Morrison et al., 2016), and some that have explored WTP for catchment conservation in the interests of improving water quality (Xiong et al., 2018), water quantity (Balana et al., 2013) or reducing flood risk (Glenk and Fischer, 2010). However, few studies have considered how consumers feel about the environmental impact of meeting their water demands or their WTP for less damaging or 'greener' ways of supplying water.
Most studies that investigate WTP for water services use the contingent valuation method (Hao et al., 2023), although there are other useful methods, such as averting expenditure methods (Orgill-Meyer et al., 2018). In this study, we apply the payment card contingent valuation method to estimate Capetonians' WTP for both a secure water supply and for 'green' water supply over the longer term, the latter requiring the earlier move to more expensive alternatives in order to avoid overstretching surface and groundwater resources to the detriment of the environment. The drought presented a unique opportunity, in that it allowed us to separate these two issues because of the unprecedented high level of public awareness around water supply, prices and household use.
DATA AND METHODS
Data collection
Capetonians' WTP for secure and for green water supply was estimated using the contingent valuation method, which is a survey-based method. Our research targeted all households paying for municipal water supply to their homes in Cape Town.
A household questionnaire was designed in 2 stages. After the initial design, the questionnaire was tested on 14 respondents before being finalised. Face-to-face interviews were carried out by trained enumerators with respondents randomly selected from queues outside the 3 main offices of the Department of Home Affairs (DHA; Wynberg, Bellville and City Centre) during May 2017. Willing participants were only interviewed if they had lived or intended to live in Cape Town for more than a year and they were a decision maker in their household.
DHA locations are visited by a broad cross-section of society because of the requirement to apply for official documentation in person, providing an opportunity for convenience sampling that avoids the known biases towards lower income groups associated with in-situ household surveys in South Africa. Nevertheless, it was anticipated that the sample could be slightly biased towards higher income groups, and for this reason, we used household income as an important factor in the analysis.
Questionnaire structure
The first section covered the respondent's suburb, household size, and property characteristics, and whether they were aware of the drought and water shortages. They were told that the city was looking into options to help secure water supplies into the longer term.
Respondents were then asked to indicate how much they paid monthly for water before the drought, and how much they paid for electricity. They were asked if they thought the price of water was 'appropriate', 'too low' or 'too high, and what would be a reasonable amount to pay for the water they normally used if this would increase security and avoid restrictions. The rationale for these questions was to enhance consequentiality by encouraging respondents to display sensible attitudes towards the hypothetical scenario and to check for consistency in responses. Respondents were then told that improving security of supply in the cheapest way might involve putting pressure on aquatic ecosystems and risk losing a third of aquatic biodiversity in the region, and that this could be avoided by investing in more expensive sources like recycling and desalination.
In the next section, respondents were asked how familiar they were with rivers and estuaries in the region, and whether they would prefer to keep prices low and accept that these would be impacted or accept higher water prices to avoid these impacts. Those choosing the latter were asked to recall their stated WTP for secure water and indicate how much more they would be willing to add. Finally, data were collected on education, income, race and age.
Elicitation of willingness to pay
WTP was elicited using a payment card approach, in which respondents chose their maximum WTP from a list of options (Mitchell and Carson, 1981). This reduces starting point and hypothetical bias and other problems associated with open-ended and iterative bidding methods (Haefele et al., 2019; Aseres and Sira, 2020; Xu et al., 2020). While there are concerns about this method being upwardly biased compared with dichotomous choice elicitation (Rowe et al., 1996; Cameron et al., 2002; Covey et al., 2007), several studies have found similar or lower results for payment cards when the two methods have been tested together (Ready and Buzby, 1996; Welsh and Poe, 1998; Reaves et al., 1999; Ready et al., 2001; Wang and Whittington, 2005; Xu et al., 2020). Ready et al. (2001) found that when respondents were asked to be 95% sure that they would in fact pay their stated values, they lowered their dichotomous choice amount but did not change their payment card amount. In uncovering the WTP for urban green space conservation, Xu et al. (2020) found that the payment card approach yielded more conservative and intuitive results concerning respondents' preferred values when compared to open-ended and dichotomous bidding approaches.
While the payment card approach has its strengths, a key concern is that it does not generally meet the conditions for incentive compatibility (Zawojska and Czajkowski, 2017). An incentive-compatible survey mechanism incentivises respondents to truthfully reveal their maximum WTP (Kabaya, 2021), which according to Carson and Groves (2007), is a condition that can only be truly satisfied with the use of a referendum-style binary-choice question. Although, more recently, theoretical conditions for open-ended and payment card questions have demonstrated incentive compatibility (Vossler and Holladay, 2018; Gordillo et al., 2019). The second condition for truthful preference revelation is consequentiality (Carson and Groves, 2007; Zawojska and Czajkowski, 2017). A survey is considered consequential when (i) the respondent believes their choice can influence actions for future supply of the public good, (ii) respondents care about the outcomes of the survey, and (iii) respondents believe that if the project/policy is implemented payment will be enforced (Zawojska and Czajkowski, 2017; Kabaya, 2021). While it is recommended practice to design a survey in an incentive-compatible manner, the number of studies that meet the incentive compatibility conditions remains limited (Zawojska and Czajkowski, 2017). However, the CV method (including payment cards) has a long history of use in major policy areas (Chatterjee et al., 2017). Thus, to enhance perceived consequentiality and reduce the potential for strategic and hypothetical bias, our survey used a compelled payment vehicle in the form of a monthly utility bill and used statements that suggested implicitly that our research could influence water policy.
We asked respondents to select the amount that best corresponded to their maximum WTP from a list of amounts ordered from lowest to highest, as is commonly done (Covey et al., 2007; Haefele et al., 2019; Table 1).
The money amounts on the payment card were selected based on responses during the pre-testing phase and actual water bill data for the City of Cape Town. With this approach, the true WTP of respondents is assumed to be located above the chosen value and below the next highest one (Haefele et al., 2019). Unbounded upper responses accounted for less than 2% of our survey respondents in the first WTP question, but 13% in the second WTP question. It is possible to use a naïve ordinary least squares procedure employing interval midpoints as proxies for the true dependent variable, or an efficient maximum likelihood (ML) procedure which explicitly accommodates the intervals and is less likely to be biased (Cameron and Huppert, 1989; Greene, 2012). Alternatively, the chosen amounts can be treated as a best estimate (i.e. similar to a Lower Turnbull estimate). For this analysis the WTP estimates were inferred directly from the data using an efficient maximum likelihood estimation (Cameron and Huppert, 1989; Belyaev and Kriström, 2010; Cooper et al., 2019). The basis underlying this approach is that circling R100 (100 ZAR) on the payment card, for example, reveals that 100 ZAR < WTPi < 200 ZAR and that the contribution to the overall likelihood function is the probability that WTPi lies between 100 and 200 ZAR, conditional on a vector of explanatory variables and a set of unobservable factors captured by an error term (Cameron and Huppert, 1989; Leggett et al., 2003).
Therefore the log-linear WTP function for the ith respondent can be written as:
where Ln(WTP) is the underlying natural logarithm of WTP for secure or green water supply and i denotes the individual respondent; Xi denotes a vector of respondent and household characteristics; j is a vector of coefficients to be estimated; and S. is the stochastic error term. Effectively, Eq. 1 describes a WTP-survival function based on the Weibull distribution (Itaoka et al., 2005; Zhou et al., 2012). The log-likelihood function of the data can be defined as:
where F is the Type I extreme value distribution with scale a, WTPHi and WTPLi are upper and lower bounds for WTP, X is a vector of respondent and household characteristics with i as the corresponding coefficients and a is the scale parameter of S, as well as the reciprocal of the shape parameter of the Weibull distribution describing WTP. The Weibull distribution is versatile in that it can take on the characteristics of other distribution types based on the value of this shape parameter (a). The advantage of using a Weibull parametric distribution is that the variates are defined on the positive semi-axis and have a flexible shape parameter, resulting in the Weibull having a higher log-likelihood and narrower disparity between medians and means compared to logistic, log-normal and normal distributions (Alberini et al., 2005; Itaoka et al., 2005).
We calculated WTP estimates based on the Weibull and mixed Weibull families of distribution and estimate nonparametric WTP estimates based on the empirical survival function. The mixed Weibull and nonparametric distributions differ from the Weibull model in that they are used to model data that may not fit the Weibull probability plot (mixed multimodal) or data that are distribution-free (nonparametric). Nonparametric estimates are generally less efficient than parametric estimates (Hutchinson et al., 2001) and are simplistic in that they do not have any distributional assumptions for the unobserved component of preferences and are unable to consider the effects of independent variables on WTP, i.e., are unsuitable for covariate analysis (Hutchinson et al., 2001; Carandang et al., 2008; Truong, 2021). However, they are flexible and unlike parametric models are free from distributional assumptions (Hutchinson et al., 2001).
The R programming language (Version 4.1.3) was used for all data analyses (Zhou et al., 2012; R Core Team, 2023). A total of 32 questionnaires with missing data or extreme values associated with stated electricity and water bills were excluded from the analysis. This resulted in a sample size of 248 households. Mean WTP was estimated for 7 income categories corresponding to groupings in the 2011 Census (Stats SA, 2012). Aggregate WTP for a secure and 'green' water supply was determined by multiplying the mean WTP per income category by the number of households in Cape Town within each of these income groups, considering the proportion of households choosing to accept higher prices.
Validation
The Weibull models were also used to explore the association between WTP and socioeconomic factors (Table 2). The first model explored the association between WTP for a secure water supply and household income, household size, age, race, education and whether the household had a garden, pool or borehole. To explore the probability of respondents being willing to accept higher water prices to reduce further impacts on rivers and estuaries, a binomial generalised linear model (GLM) was used. Then, for the respondents that were willing to accept higher prices, the second Weibull model explored the additional WTP for this 'green' water supply (i.e. higher prices to reduce further impacts on rivers and estuaries) and the same explanatory variables as the first model with the addition of the level of familiarity of the respondent to aquatic ecosystems and whether or not the respondent had a river in their neighbourhood.
The presence of multicollinearity was tested using the variance inflation factor (VIF), which specifies the strength of linear dependencies and identifies how much of the variance of each coefficient is inflated due to collinearity when compared to the independent variables (Yoo et al., 2014). The generally accepted approach is that multicollinearity is an issue when the VIF values are in excess of 5 or 10; however, a more stringent approach is to use a cut-off as low as 3 (Zuur et al., 2010), as we did in this study. For both models, backward stepwise elimination was performed on explanatory variables at the 5% significance level until the minimum adequate model remained. Covariates that are not reported in the Weibull model estimation results were excluded through this process.
RESULTS
Sample characteristics
A total of 248 people were interviewed, of whom 55% were female. Most respondents were between the ages of 18 and 49 (Table 3). The respondents came from 105 of Cape Town's 128 suburbs and had a mean household size of 4.1 (± 2.1, range 1-15). There were significant differences in race composition (X2 = 0.35, p < 0.05) and in income level (X2 = 2.17, p < 0.01) of the sample compared to the Cape Town population (Stats SA, 2012), with a bias towards wealthier and White households and away from poor and Black households. Half of respondents (51%) had a tertiary level qualification, 58% had a garden at home, 23% had a pool and 13% had their own borehole or well-point. The largest difference between observed and expected income categories was seen in the lowest income category where the observed frequency of respondents was significantly lower than expected. However, there was no difference in the composition of households in the survey from the population earning 2 125 ZAR/month or more. We therefore assumed that the lowest income category ranged from this minimum rather than zero. This generates a more conservative overall result.
Drought awareness and WTP for secure water supply
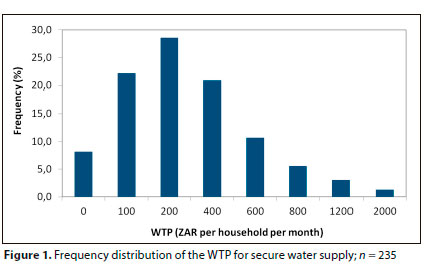
Almost all (97%) of the respondents interviewed were aware that Cape Town was experiencing severe water shortages. Most respondents (71%) knew what their household monthly water bill was and, of those that did, the majority (60%) felt that the price of water was appropriate, 17% felt it was too low, 16% felt it was too high and the rest did not have an opinion. The frequency distribution of raw responses to the first WTP question regarding monthly household payment for a secure water supply shows that the responses were right-skewed, distributed around the modal value of 200 ZAR/month (Fig. 1).
The outputs from the Weibull and mixed Weibull models were similar, confirming that the data do satisfactorily fit the Weibull probability plot distribution, as was expected. The nonparametric estimate was higher than the other two estimates for all income categories. This result is consistent with the findings of Carandang et al. (2008) and Truong (2021), and is likely an impact of maximum bid amounts and sample size. The outputs from the Weibull model were taken as the most accurate estimate of mean WTP given the frequency distribution of the data and the fit of the Weibull probability plot (Table 4). Based on the Weibull estimates for each of the 7 income categories, mean WTP for secure water supply increased logarithmically with household income (Fig. 2).
Based on the amount that households were paying for water before the start of the drought, this represented an average increase of between 63% and 127% for the same level of consumption (approximately 12.6-25.9 kL/month under the assumption of 6 kL for zero-paying households), in order to have a secure water supply and avoid restrictions. This is conservative given that consumption may have been overestimated due to unknown consumption in the 0-6 kL range. Nevertheless, WTP for secure water supply was considerably above Level 1 (non-drought), higher than Level 2-4 prices, and also exceeded the adjusted Level 1 prices based on the 20% increase announced in May 2018 (Fig. 3).
WTP for a secure supply of water was significantly related to household income level and whether the respondent had a swimming pool (Table 5). Higher-income households were willing to pay significantly more per month for a secure water supply compared to low-income households and respondents with a swimming pool were also willing to pay significantly more per month than households without a pool (Table 5).
WTP to secure river and estuary health
Respondents were largely ignorant of the rivers and estuaries of the south-western Cape, with 34% unfamiliar, 38% somewhat familiar - having noticed some rivers and estuaries, 19% saying they knew some of the systems well and only 9% claiming they were very familiar with several rivers and estuaries. Nevertheless, 72% of respondents said they were willing to accept higher water prices to avoid further impacts on rivers and estuaries, as opposed to keeping prices low and accepting that rivers and estuaries will be impacted. The likelihood of accepting higher prices to have a greener water supply ranged from 40-90% per income category and increased logarithmically with income (%WTP = -0.259 + 0.098 • ln(Income), R2 = 0.72,p < 0.05).
Among respondents who were willing to pay more for greener water supply, the frequency distribution of responses regarding their WTP over and above their WTP for secure water supply was distributed around the modal value of 100 ZAR/month, but the distribution was truncated (Fig. 4). Therefore, the WTP estimates from these data could be underestimated.
Based on the percentage of each income category that was willing to pay a premium for greener water, and their estimated mean WTP, the overall mean WTP was estimated per income category, from the Weibull model. This increased logarithmically with household income (Fig. 5). The overall mean WTP for a greener water supply was estimated to be 116 ZAR per household per month.
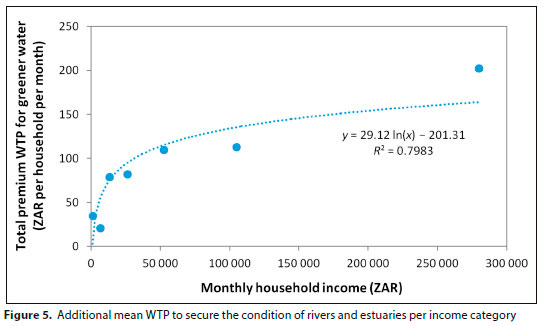
Figure 6 shows the average monthly amount that households in each income category paid for water before the drought, the average additional amount they were willing to pay for a secure supply (i.e. avoiding water shortages in the future), and the average additional amount they were willing to pay to secure the condition of aquatic ecosystems through use of lower impact water supply technologies. As expected, all amounts increase with income category.
Household size and income explained a significant amount of variation in the probability of respondents being willing to accept higher water prices to reduce further impacts on rivers and estuaries (Table 6). Higher-income households were more likely to accept higher prices than lower-income households and larger households were less likely to accept higher prices compared to smaller households.
Among the households that were willing to pay for green water supply, household income and level of familiarity with rivers and estuaries explained a significant amount of variation in WTP (Table 7). Higher-income households and those that were 'very familiar' with the rivers and estuaries in the region were willing to spend significantly more than other households.
Aggregate WTP
The overall average annual household WTP for secure water supply ranged from 2 640 to 8 725 ZAR per household per income category. The City of Cape Town has just over 980 000 households, of which just under 680 000 earn more than 2 125 ZAR/month (Stats SA, 2012). Based on WTP per income category, the aggregate WTP by the latter households for security of supply at pre-drought levels of use was in the order of 2.8 billion ZAR/year. In addition, the aggregate WTP to secure the health of rivers and estuaries in the south-western Cape was 0.5 billion ZAR/year.
DISCUSSION
This study investigated Capetonian's WTP for secure water supply and also avoiding negative impacts on the health of aquatic ecosystems from excessive water abstraction. This is extremely pertinent, as the increasing likelihood of major droughts could pose a serious threat to the future integrity of aquatic ecosystems in the absence of investment into sustainable alternatives to surface water supply.
Capetonians' WTP for security of supply was significantly above non-drought water prices and even higher than the prices during Level 2-4 restrictions. It also exceeded the Level 1 (non-drought) prices if these were to be subjected to the 20% increase announced in 2018. Aggregated at the city level, this additional amount translated into 2.8 billion ZAR/year, which was 1.4 billion ZAR more than the total amount actually paid by residents at the time (Cook et al., 2021). Furthermore, aggregate WTP would be 3.3 billion ZAR if the supply was secured in ways that would also avoid further risk to rivers and estuaries, such as through catchment restoration, wastewater recycling and desalination. This suggests that capturing consumer surplus, here estimated to be about 1.9 billion ZAR/year, could comfortably provide the funding required for both secure and green (environmentally sustainable) water supply. Of the latter options, the annual surplus comfortably exceeds the approximately 370 million ZAR (in total) needed to clear alien invasive plants, which is the top priority based on return on investment (Turpie et al., 2018; TNC, 2019), and also exceeds the 1.5 billion ZAR capital expenditure that the City estimated was needed for diversification of water sources to mitigate water shortages (CCT, 2018). Covering these amounts would therefore potentially only require a fraction of the expressed additional WTP.
While many studies have estimated WTP for secure and clean water supply, relatively few have investigated WTP for water supply that avoids biodiversity loss (Loomis et al., 2000; Ojeda et al., 2008; Shang et al., 2012), and none, to our knowledge, have considered these together. This avoided confounding these two elements, especially in a post-drought situation.
WTP for green water supply was expected to be lower than WTP for secure water supply, since not all users would be aware of or concerned with environmental issues. Indeed, only a small percentage of respondents were familiar with the rivers and estuaries of the region. Nevertheless, after being informed about the potential consequences of drawing on cheaper options (surface water resources), almost three quarters of respondents were willing to accept higher water prices to avoid this. Among these, WTP increased with the respondent's level of familiarity with rivers and estuaries as well as household income. Larger and lower-income households were least likely to accept higher water prices to reduce environmental impacts. In general, both the understanding of environmental issues and WTP for conservation increases with education and income (Urama and Hodge, 2006; Gifford and Nilsson, 2014; Nguyen et al., 2016).
The contingent valuation method is prone to a number of biases. For example, it is important to provide enough information upon which respondents can base decisions, but if respondents are 'sold' the idea of green water supply (e.g. see Loomis et al., 2000), then their WTP would only reflect what might be achieved with awareness raising. Our survey provides very limited information on the risks to rivers and estuaries, but this may have raised the interest of some respondents, contributing to a higher than expected level of support for raising prices to supply green water. Respondents may also provide a more socially acceptable answer than their true response, as they are uncomfortable admitting that they are unable to contribute towards a desirable outcome (Kaminska and Foulsham, 2013). Nevertheless, our results were consistent with the international literature in that WTP for water increased with household income (Gordon et al., 2001; Griffin and Mjelde, 2001; Koss and Khawaja, 2001; Asim and Lohano, 2015; Rananga and Gumbo, 2015), providing important validation.
Of the respondents who had zero or low WTP, many commented that this was as a result of distrust and low confidence in the City of Cape Town and their management of the drought situation. Certain individuals felt that the rates and taxes that they were already paying was not being efficiently spent on service delivery.
Many of these residents stated that they would only be willing to pay higher fees if there was some guarantee that the money was being used to address water supply rather than to supplement city revenues. Indeed, the lack of trust in local government has previously been found to explain the lack of payment for services in South African towns (Fjeldstad, 2004). This suggests that, under the right institutional arrangement, aggregate WTP for secure and greener water supply might be higher than the results reported here.
CONCLUSIONS
Our findings indicate that Capetonian households are not only willing to pay significantly more for their water to have security of supply but are willing to pay even higher amounts to avoid environmental damages in securing this supply. This suggests that domestic water tariffs could be raised in line with the proportionally higher consumer surplus of higher-income households and the increased revenues would be sufficient to address water security using environmentally sustainable approaches. The results also suggest that trust in municipal institutions plays an important role, and that public support for tariff hikes would be significantly improved if water revenues were ringfenced for this purpose.
ACKNOWLEDGEMENTS
This study was funded by The Nature Conservancy. Thanks to K Forsythe, R Button, S Davis, O Masiko, S Dubay, L Leungo, C Lindberg, S Catto, O Hyvárinen, F Mavinga, P Mottram, D van Beuningen and T Zimunya for assisting with data collection, and to the South African Department of Home Affairs for their cooperation with the survey.
AUTHOR CONTRIBUTIONS
Jane Turpie was project leader and responsible for conceptualisation, methodology, funding acquisition and writing. Gwyneth Letley assisted with methodology, data collection, analysis and writing.
ORCIDS
JK Turpie: https://orcid.org/0000-0003-1220-6295
GK Letley: https://orcid.org/0009-0004-8691-4045
REFERENCES
AHMED T, SIPRA H, ZAHIR M, AHMAD A and AHMED M (2022) Consumer perception and behaviour toward water supply, demand, water tariff, water quality, and willingness-to-pay: a cross sectional study. Water Resour. Manage. 36 1339-1354. https://doi.org/10.1007/s11269-022-03085-5 [ Links ]
ALBERINI A, ROSATO P, LONGO A and ZANATTA V (2005) Information and willingness to pay in a contingent valuation study: The value of S. Erasmo in the Lagoon of Venice. J. Environ. Plan. Manage. 48 155-175. https://doi.org/10.1080/0964056042000338136 [ Links ]
ASERES SA and SIRA RK (2020) Estimating visitors' willingness to pay for a conservation fund: sustainable financing approach in protected areas in Ethiopia. Heliyon 6 e04500. https://doi.org/10.1016/j.heliyon.2020.e04500 [ Links ]
ASIM S and LOHANO HD (2015) Households' willingness to pay for improved tap water services in Karachi, Pakistan. Pak. Dev. Rev. 54 507-524. [ Links ]
BALANA BB, CATACUTAN D and MÀKELÀ M (2013) Assessing the willingness to pay for reliable domestic water supply via catchment management: results from a contingent valuation survey in Nairobi City, Kenya. J. Environ. Plan. Manage. 56 1511-1531. https://doi.org/10.1080/09640568.2012.732934 [ Links ]
BELYAEV Y and KRISTRÖM B (2010) Approach to analysis of self-selected interval data. CERE Working Paper, 2010:2. Social Science Research Network. [ Links ]
BUI NT, DARBY S, VU TQ, MERCADO JMR, BUI TTP, KANTAMANENI K, NGUYEN TTH, TRUONG TN, HOANG HT and BUI D (2022) Willingness to pay for improved urban domestic water supply system: the case of Hanoi, Vietnam. Water 14. https://doi.org/10.3390/w14142161 [ Links ]
CAMERON TA and HUPPERT DD (1989) OLS versus ML estimation of non-market resource values with payment card interval data. J. Environ. Econ. Manage. 17 230-246. https://doi.org/10.1016/0095-0696(89)90018-1 [ Links ]
CAMERON TA, POE GL, ETHIER RG and SCHULZE WD (2002) Alternative non-market value-elicitation methods: Are the underlying preferences the same? J. Environ. Econ. Manage. 44 391-425. https://doi.org/10.1006/jeem.2001.1210 [ Links ]
CARANDANG MG, CALDERON MM, CAMACHO LD and DIZON JT (2008) Parametric and non-parametric models to estimate household willingness to pay for improved management of watershed. J. Environ. Sci. Manage. 11 68-78. [ Links ]
CARSON RT and GROVES T (2007) Incentive and informational properties of preference questions. Environ. Resour. Econ. 37 181-210. https://doi.org/10.1007/s10640-007-9124-5 [ Links ]
CCT (City of Cape Town) (2018) City of Cape Town Water Outlook 2018. URL: https://resource.capetown.gov.za/documentcentre/Documents/Cityresearchreportsandreview/WaterOutlook2018-Summary.pdf (Accessed 7 September 2023). [ Links ]
CHATTERJEE C, TRIPLETT R, JOHNSON CK and AHMED P (2017) Willingness to pay for safe drinking water: A contingent valuation study in Jacksonville, FL. J. Environ. Manage. 203 413-421. https://doi.org/10.1016/j.jenvman.2017.08.008 [ Links ]
COOK J, BRÜHL J and VISSER M (2021) Distributional statistics of municipal water use during Cape Town's drought: implications for affordability, conservation, and tariffs. Water Resour. Res. 57. https://doi.org/10.1029/2020WR028219 [ Links ]
COOPER B, BURTON M and CRASE L (2019) Willingness to pay to avoid water restrictions in Australia under a changing climate. Environ. Resour. Econ. 72 823-847. https://doi.org/10.1007/s10640-018-0228-x. [ Links ]
COVEY J, LOOMES G and BATEMAN IJ (2007) Valuing risk reductions: Testing for range biases in payment card and random card sorting methods. J. Environ. Plan. 50 467-482. https://doi.org/10.1080/09640560701401986 [ Links ]
DALLAS HF and RIVERS-MOORE N (2014) Ecological consequences of global climate change for freshwater ecosystems in South Africa. S. Afr. J. Sci. 110 1-11. https://doi.org/10.1590/sajs.2014/20130274 [ Links ]
DOLLAR ESJ, NICOLSON CR, BROWN CA, TURPIE JK, JOUBERT AR, TURTON AR, GROBLER DF, PIENAAR HH, EWART-SMITH J and MANYAKA SM (2010) Development of the South African Water Resource Classification System (WRCS): A tool towards the sustainable, equitable and efficient use of water resources in a developing country. Water Policy 12 479-499. https://doi.org/10.2166/wp.2009.213 [ Links ]
DWA (Department of Water Affairs, South Africa) (2013) National Water Resource Strategy. June 2013 Second Edition. Department of Water Affairs, Pretoria. [ Links ]
DWS (Department of Water and Sanitation, South Africa) (2021) National Water Resource Strategy 3. Draft 2.6. November 2021. Department of Water and Sanitation, Pretoria. [ Links ]
FJELDSTAD O-H (2004) What has trust got to do with it? Non-payment of service charges in local authorities in South Africa. J. Mod. Afr. Stud. 42 539-562. https://doi.org/10.1017/s0022278x04000394 [ Links ]
GIFFORD R and NILSSON A (2014) Personal and social factors that influence pro-environmental concern and behaviour: A review. Int. J. Psychol. 49 141-157. https://doi.org/10.1002/ijop.12034 [ Links ]
GLENK K and FISCHER A (2010) Insurance, prevention or just wait and see? Public preferences for water management strategies in the context of climate change. Ecol. Econ. 69 2279-2291. http://dx.doi.org/10.1016/j.ecolecon.2010.06.022. [ Links ]
GORDILLO F, ELSASSER P and GÜNTER S (2019) Willingness to pay for forest conservation in Ecuador: Results from a nationwide contingent valuation survey in a combined "referendum" -"Consequential open-ended" design. For. Policy Econ. 105 28-39. https://doi.org/10.1016Zj.forpol.2019.05.002 [ Links ]
GORDON J, CHAPMAN R and BLAMEY R (2001) Assessing the options for the Canberra water supply: an application of choice modelling. In: Bennet J and Blamey R (eds.) The Choice Modelling Approach to Environmental Evaluation. Edward Elgar, Cheltenham. https://doi.org/10.4337/9781781956601.00013 [ Links ]
GREENE W (2012) Econometric Analysis (7th edn). Prentice Hall, Upper Saddle River. [ Links ]
GRIFFIN RC and MJELDE JW (2001) Valuing water supply reliability. Am. J. Agric. Econ. 82 414-426. https://doi.org/10.1111/0002-9092.00035 [ Links ]
GURRÍA A (2017) Putting water at the centre of the global agenda. OECD, New York. [ Links ]
HAEFELE M, LOOMIS J, LIEN A, DUBOVSKY J, MERIDETH R, BAGSTAD K, HUANG T, MATTSSON B, SEMMENS D and THOGMARTIN W (2019) Multi-country willingness to pay for transborder migratory species conservation: a case study of Northern Pintails. Ecol. Econ. 157 321-331. https://doi.org/10.1016/j.ecolecon.2018.11.024 [ Links ]
HAO Q, XU S, LIAO Y, QIAO D, SHI H and XU T (2023) Determinants of residents' willingness to pay for water quality improvements in Haikou, China: application of CVM and ISM approaches. Water 15. https://doi.org/10.3390/w15071305 [ Links ]
HOLMES TP, BERGSTROM JC, HUSZAR E, KASK SB and ORR F (2004) Contingent valuation, net marginal benefits, and the scale of riparian ecosystem restoration. Ecol. Econ. 49 19-30. https://doi.org/10.1016/j.ecolecon.2003.10.015 [ Links ]
HUTCHINSON WG, SCARPA R, CHILTON SM and MCCALLION T (2001) Parametric and non-parametric estimates of willingness to pay for forest recreation in Northern Ireland: A discrete choice contingent valuation study with follow-ups. J. Agric. Econ. 52 104-122. https://doi.org/10.1111/j.1477-9552.2001.tb00912.x [ Links ]
ITAOKA K, KRUPNICK A, AKAI M and ALBERINI A (2005) Age, health and the willingness to pay for mortality risk reductions: a contingent valuation survey in Japan. Discussion Paper DP 05-34. Resources for the Future, Washington DC. https://doi.org/10.1007/bf03353958 [ Links ]
JIANG Y and ROHENDI A (2018) Domestic water supply, residential water use behaviour, and household willingness to pay: The case of Banda Aceh, Indonesia after ten years since the 2004 Indian Ocean Tsunami. Environ. Sci. Policy 89 10-22. https://doi.org/10.1016/j.envsci.2018.07.006. [ Links ]
KABAYA K (2021) Opposite impacts of policy and payment consequentiality treatments on willingness-to-pay in a contingent valuation study. J. Environ. Econ. Policy 10 175-188. https://doi.org/10.1080/21606544.2020.1816218 [ Links ]
KAMINSKA O and FOULSHAM T (2013) Understanding sources of social desirability bias in different modes: evidence from eye-tracking. ISER Working Paper Series. Institute for Social & Economic Research (ISER), Essex. [ Links ]
KOSS P and KHAWAJA MS (2001) The value of water supply reliability in California: A contingent valuation study. Water Policy 3 165-174. https://doi.org/10.1016/s1366-7017(01)00005-8 [ Links ]
LEGGETT CG, KLECKNER NS, BOYLE KJ, DUFFIELD JW and MITCHELL RC (2003) Social desirability bias in contingent valuation surveys administered through in-person interviews. Land Econ. 79 561-575. https://doi.org/10.2307/3147300 [ Links ]
LOOMIS J, KENT P, STRANGE L, FAUSCH K and COVICH A (2000) Measuring the total economic value of restoring ecosystem services in an impaired river basin: results from a contingent valuation survey. Ecol. Econ. 33 103-117. https://doi.org/10.1016/s0921-8009(99)00131-7 [ Links ]
MAKWINJA R, KOSAMU IBM and KAONGA CC (2019) Determinants and values of willingness to pay for water quality improvement: Insights from Chia lagoon, Malawi. Sustainability 11.https://doi.org/10.3390/su11174690 [ Links ]
MITCHELL RC and CARSON RT (1981) An experiment in determining willingness to pay for national water quality improvements. Report to the US Environmental Protection Agency, Washington DC. [ Links ]
MORRISON M, DUNCAN R and BOYLE K (2016) River Health Project: The value of improving urban stream health in the Cooks River and Georges River catchments. Charles Stuart University, Sydney. [ Links ]
NGUYEN N, LOBO A, NGUYEN H, HOAI PHAN T and CAO T (2016) Determinants influencing conservation behaviour: perceptions of Vietnamese consumers. J. Consumer Behav. 15 560-570. https://doi.org/10.1002/cb.1594 [ Links ]
OJEDA MI, MAYER AS and SOLOMON BD (2008) Economic valuation of environmental services sustained by water flows in the Yaqui River Delta. Ecol. Econ. 65 155-166. https://doi.org/10.1016/j.ecolecon.2007.06.006 [ Links ]
ORGILL-MEYER J, JEULAND M, ALBERT J and CUTLER N (2018) Comparing contingent valuation and averting expenditure estimates of the costs of irregular water supply. Ecol. Econ. 146 250-264. https://doi.org/10.1016/j.ecolecon.2017.10.016 [ Links ]
PETTS GE (1996) Water allocation to protect river ecosystems. River Res. Appl. 12 353-365. https://doi.org/10.1002/(sici)1099-1646(199607)12:4/5<353::aid-rrr425>3.0.co;2-6 [ Links ]
R CORE TEAM (2023) R: A language and environment for statistical computing. R Foundation for Statistical Computing. Vienna. [ Links ]
RANANGA HT and GUMBO JR (2015) Willingness to pay for water services in two communities of Mutale Local Municipality, South Africa: A case study. J. Hum. Ecol. 49 231-243. https://doi.org/10.1080/09709274.2015.11906841 [ Links ]
READY RC and BUZBY JC (1996) Differences between continuous and discrete contingent value estimates. Land Econ. 72 397-411. https://doi.org/10.2307/3147205 [ Links ]
READY RC, NAVRUD S and DUBOURG WR (2001) How do respondents with uncertain willingness to pay answer contingent valuation questions? Land Econ. 77 315-326. https://doi.org/10.2307/3147126 [ Links ]
REAVES DW, KRAMER RA and HOLMES TP (1999) Does question format matter? Valuing an endangered species. Environ. Resour. Econ.14 365-383. https://doi.org/10.1023/a:1008320621720 [ Links ]
ROWE RD, SCHULZE WD and BREFFLE WS (1996) A test for payment card biases. J. Environ. Econ. Manage. 31 178-185. https://doi.org/10.1006/jeem.1996.0039 [ Links ]
SHANG Z, CHE Y, YANG K and JIANG Y (2012) Assessing local communities' willingness to pay for river network protection: A contingent valuation study of Shanghai, China. Int. J. Environ. Res. Public Health 9 3866-3882. https://doi.org/10.3390/ijerph9113866 [ Links ]
STATS SA (Statistics South Africa) (2012) Census 2011. Statistics South Africa, Pretoria. [ Links ]
SWH (Swedish Water House) (2009) Securing water for ecosystems and human well-being: The importance of environmental flows. Swedish Water House Report. Stockholm International Water Institute (SIWI), Sweden. [ Links ]
TNC (The Nature Conservancy) (2019) The Greater Cape Town Water Fund Business Case: Assessing the return on investment for ecological infrastructure restoration. The Nature Conservancy, Cape Town. URL: https://www.nature.org/content/dam/tnc/nature/en/documents/GCTWF-Business-Case-April-2019.pdf (Accessed 6 April 2020). [ Links ]
TRUONG DD (2021) Estimating residents' willingness to pay for wetland conservation using contingent valuation: The case of Van Long Ramsar Protected Area, Vietnam. Biodiversitas 22 4784-4793. https://doi.org/10.13057/biodiv/d221110 [ Links ]
TURPIE J, FORSYTHE K, SEYLER H, HOWARD G and LETLEY GK (2018) Priority interventions for restoration of Greater Cape Town's water supply catchment areas. Report prepared by Anchor Environmental Consultants for The Nature Conservancy. Anchor Environmental Consultants, Cape Town. [ Links ]
UNDP (2016) UNDP Support to the implementation of Sustainable Development Goal 6: Sustainable management of water and sanitation. UNDP, New York. [ Links ]
URAMA KC and HODGE ID (2006) Are stated preferences convergent with revealed preferences? Empirical evidence from Nigeria. Ecol. Econ. 59 24-37. https://doi.org/10.1016/j.ecolecon.2005.09.022 [ Links ]
VÁSQUEZ WF and ESPAILLAT R (2016) Willingness to pay for reliable supplies of safe drinking water in Guatemala: A referendum contingent valuation study. Urban Water J. 13 284-292. https://doi.org/10.1080/1573062x.2014.991741 [ Links ]
VOSSLER CA and HOLLADAY JS (2018) Alternative value elicitation formats in contingent valuation: Mechanism design and convergent validity. J. Public. Econ. 165 133-145. https://doi.org/10.1016/j.jpubeco.2018.07.004 [ Links ]
WANG H and WHITTINGTON D (2005) Measuring individuals' valuation distributions using a stochastic payment card approach. Ecol. Econ. 55 143-154. https://doi.org/10.1016/j.ecolecon.2004.11.011 [ Links ]
WELSH MP and POE GL (1998) Elicitation effects in contingent valuation: Comparisons to a multiple bounded discrete choice approach. J. Environ. Econ. Manage. 36 170-185. https://doi.org/10.1006/jeem.1998.1043 [ Links ]
WILSON C, ATHUKORALA W, TORGLER B, GIFFORD R, GARCIA-VALINAS MA and MANAGI S (2021) Willingness to pay to ensure a continuous water supply with minimum restrictions. Empir. Econ. 61 1519-1537. https://doi.org/10.1007/s00181-020-01955-8 [ Links ]
XIONG K, KONG F, ZHANG N, LEI N and SUN C (2018) Analysis of the factors influencing willingness to pay and payout level for ecological environment improvement of the Ganjiang River Basin. Sustainability 10. https://doi.org/10.3390/su10072149 [ Links ]
XU F, WANG Y, XIANG N, TIAN J and CHEN L (2020) Uncovering the willingness-to-pay for urban green space conservation: A survey of the capital area in China. Resour. Conserv. Recycl. 162. https://doi.org/10.1016/j.resconrec.2020.105053 [ Links ]
YOO W, MAYBERRY R, BAE S, SINGH K, HE QP and LILLARD JWJ (2014) A study of effects of multicollinearity in the multivariable analysis. Int. J. Appl. Sci. Technol. 4 9-19. [ Links ]
ZAWOJSKA E and CZAJKOWSKI M (2017) Re-examining empirical evidence on stated preferences: importance of incentive compatibility. J. Environ. Econ. Policy 6 374-403. https://doi.org/10.1080/21606544.2017.1322537 [ Links ]
ZHOU W, BELYAEV Y and KRISTR B (2012) "iwtp": software for analysis of self-selected interval data. R: A language and environment for statistical computing. Vienna. [ Links ]
ZUUR A, IENO E and ELPHICK C (2010) A protocol for data exploration to avoid common statistical problems. Meth. Ecol. Evol. 13-14. https://doi.org/10.1111/j.2041-210x.2009.00001.x [ Links ]
 Correspondence:
JK Turpie
Email:jane.turpie@uct.ac.za
Received: 7 July 2022
Accepted: 18 October 2023

