


Serviços Personalizados
Artigo
 Inglês (pdf)
 Artigo em XML
 Referências do artigo
Indicadores

Links relacionados
-
 Citado por Google
 -
 Similares em Google
Compartilhar

 Permalink
Water SA
versão On-line ISSN 1816-7950
versão impressa ISSN 0378-4738
Water SA vol.49 no.4 Pretoria Out. 2023
http://dx.doi.org/10.17159/wsa/2023.v49.i4.3998
RESEARCH PAPER
A baseline study on the prevalence of microplastics in South African drinking water: from source to distribution
Annelie SwanepoelI; Hein du PreezI, II; Henk BouwmanIII; Carina VersterIII
IRand Water Analytical Services, 81 Barrage Road, Vereeniging 1930, South Africa
IIDepartment of Zoology, University of Johannesburg, Auckland Park 2006, South Africa
IIIResearch Unit: Environmental Sciences and Management, North-West University, Potchefstroom 2520, South Africa
ABSTRACT
Due to the worldwide increasing prevalence of microplastics in the aquatic environment, this study aimed to perform a screening of the source and drinking water of South Africa's largest bulk drinking water supplier to determine the extent to which microplastics occur in the water. Source water samples, samples immediately after treatment, and samples in the distribution network (Johannesburg, Mabopane, Garankua and Pelindaba) were analysed. Microplastics concentrations in the source water ranged from 0.24 to 1.47 particles/L, immediately after treatment from 0.56 to 0.9 particles/L, and in the distribution network from 0.26 to 0.88 particles/L. Most of the microplastics found in the water were classified as 'fragments' and a few as 'fibres'. The control sample (indicating contamination during sample preparation and analysis) showed 0.34 particles/L, which was higher than some of the samples taken, indicating very low microplastics concentrations in these samples. Little evidence was found that the drinking water treatment processes reduced the number of microplastics from the source to the final treated water. No evidence could be found that the pipes in the distribution network contribute to microplastics in the tap water. The most frequently found polymer in the samples was rubber. Based on mass, however, as a function of particle size and polymer density, ethylene-vinyl-acetate (a polymer commonly used as foam in sporting equipment and flip-flops) comprised 54% of the microplastics and polyethylene (standard and chlorinated) 25%.
Keywords: freshwater, FTIR, FT-IR, microplastics, potable water
INTRODUCTION
According to the 2014 United Nations Environment Programme (UNEP) yearbook, microplastic pollution has been proposed alongside climate change as one of the 10 emerging issues facing the world today (Peng et al., 2017). In 2014, annual plastic production exceeded 311 million tons, an increase of nearly 84 million tons since 2004 (PlasticsEurope, 2015). By 2050, it is estimated that this may increase to a staggering 33 billion tons (Rochman et al., 2013).
The term 'microplastics' is defined as plastic fragments within the size range of 1 to 5 000 |im (GESAMP, 2015; Jiang, 2018) and can be derived from primary and/or secondary sources. Primary sources mainly include small ready-made plastics used in consumer products, such as cosmetics and facial care products or hand-cleaners and toothpaste; medical supplies, such as grinding and polishing agents in dental care; overflowing drilling fluid in oil exploration; and industrial abrasives and air-blast cleaning media (Wang et al., 2018). Secondary sources are large plastic materials degraded to smaller particles through physical, chemical, and biological processes.
Most ofthe research that has been conducted on microplastics has focused on the marine environment. According to Wagner and Lambert (2018), a literature search on "microplastic*" revealed 1 228 papers, of which only 45 contained the term "freshwater" i.e. 3.7% of the total. This indicates that little focus has been given to microplastic contamination in freshwaters as opposed to the marine environment (Blettler et al., 2018). Even fewer of these studies focused on the microplastic content in drinking water, most probably because very few microplastics are expected in drinking water (specifically tap water). The World Health Organisation has published a report on microplastics in drinking water (WHO, 2019 p. ix) stating, "Based on this limited body of evidence, firm conclusions on the risk associated with ingestion of microplastic particles through drinking-water cannot yet be determined; however, at this point, no data suggest overt health concerns associated with exposure to microplastics particles through drinking-water."
Although the WHO does not regard the exposure to microplastics through drinking water as a current threat, some studies on drinking water suggest that concentrations of microplastics can differ substantially between different drinking water treatment works (DWTWs) and different source waters. In September 2017, Orb Media, a non-profit journalism organisation, published a report that claimed the presence of microplastics in drinking water. This cross-border research tested 159 drinking water samples from 5 continents and found that 83% of them were contaminated with tiny plastic debris (Orb, 2017); however, no numbers or concentrations were given. Two detailed investigations were conducted in the raw and drinking water of three different DWTWs in the Czech Republic (Pivokonsky et al., 2018; 2020). Another investigation was performed by Mintenig et al. (2019), who specifically examined the microplastics found in drinking water from groundwater sources. Mukotaka et al. (2021) investigated tap water from Japan, the USA, France, Finland, and Germany. A scoping study performed by Bouwman et al. (2018) mostly investigated microplastics in raw (surface waters) water but also investigated 2 samples from drinking water (one from Johannesburg and one from Tshwane) and 4 samples from groundwater (boreholes) in Potchefstroom, South Africa.
Pivokonsky et al. (2018) found that the content and characteristics of microplastics present in the raw water supplying three different water treatment plants versus the treated water differed substantially. They investigated different size ranges of microplastics, i.e., 1-5 ||m, 6-10 ||m, (utilising Raman spectroscopy) and 11-50 |im, 51-100 |im and >100 |im (utilising Fourier Transform Infrared Spectroscopy); and found that up to 95% of the microplastics in the drinking water studied were within the size range of1-10 |im, which is smaller than the 20-25 ||m limit that is usually investigated in similar studies. The average number of microplastics that Pivokonsky and co-authors (2018) found in raw water ranged from 1 473 ± 34 to 3 605 ± 497 particles/L and in the treated water from 338 ± 76 to 628 ± 28 particles/L. From this study (Pivokonsky et al., 2018), it was observed that the content of microplastics in the treated water was significantly lower (by 83% on average) than in the raw water. They also found that the smallest microplastics were the least removed during the drinking water treatment processes. A later study performed by Pivokonsky et al. (2020) found 23 ± 2 and 14 ± 1 microplastics particles/L in raw and treated water, respectively, at one DWTW, and 1 296 ± 35 and 151 ± 4 microplastics particles/L at another. Kirstein and co-workers (2021) found that most microplastics detected in drinking water were <150 µm and 32% were <20 ||m, which could potentially pose a risk to human health. A study by Mukotaka et al. (2021) found, on average, between 7 and 97 microplastics particles per litre of purified tap water in waters analysed from Japan, the United States of America, France, Finland, and Germany.
Because of the worldwide increasing prevalence of microplastics in the aquatic environment (either marine or freshwater) and the outcomes from the scoping study performed by Bouwman et al. (2018), concerns were raised regarding the prevalence of microplastics in South Africa's tap water. Therefore, we decided to conduct a baseline study on the prevalence of microplastics in the source and drinking water of South Africa's largest bulk drinking water supplier. This bulk drinking water supplier is situated in the Gauteng Province of South Africa and provides drinking water to approximately 19 million South Africans (Van Rooyen, 2016). The aim of this study was to screen the source (raw) and drinking water of this large bulk drinking water supplier and determine the extent to which microplastics occur before treatment, after treatment, and in the distribution network.
MATERIALS AND METHODS
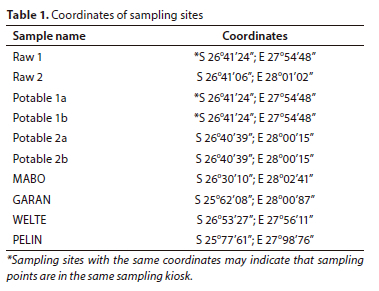
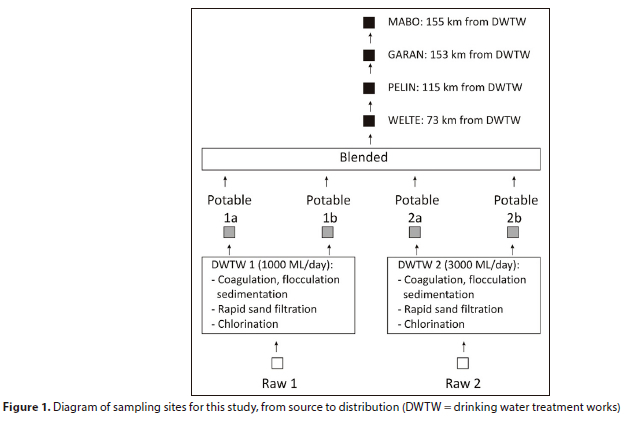
On 6 and 7 November 2018, samples were taken at the two main DWTWs of South Africa's largest bulk drinking water supplier (Table 1). This included 2 samples from the source water, i.e., RAW 1 (from the Vaal River downstream from the Vaal Dam at the Lethabo weir) supplied DWTW 1 and RAW 2 (from the Vaal Dam) supplied DWTW 2 via a canal. Four samples were taken at the two plants immediately following the treatment process, i.e., Potable 1a and 1b (after treatment at DWTW 1) and Potable 2a and Potable 2b (after treatment at DWTW 2). Four samples were taken from the distribution network, namely MABO (in Mabopane), GARAN (in Garankuwa), WELTE (in Weltevredenpark), and PELIN (at Pelindaba) in Gauteng, South Africa (Fig. 1).
All sampling sites, except for RAW 2, were sampled in a dedicated sampling kiosk where the water either ran constantly or was allowed to run for 5 min before the actual sampling was performed. To reduce contamination during sampling, the kiosk doors were closed and, where possible, stainless-steel buckets were placed inside the kiosk and closed while the buckets filled up.
Two different samples were taken at each sampling site: one unfiltered water sample was destined for monomer/additive analysis and one sample (a 100 L filtered sample) was taken for fibre and fragment identification and enumeration. All samples were taken by trained specialists.
Fibre and fragment identification and enumeration
The samples destined for fibre and fragment identification and enumeration were sampled by filtering 100 L of the sample through a 20 |im mesh stainless steel sieve. The trapped microplastics on the sieve were then washed into a 250 mL glass bottle and covered with foil before the Teflon lid was replaced.
The samples were placed in a portable ice chest, transported, and stored overnight in a refrigerator at 5 ± 4°C. All samples were delivered to the outsourced laboratory (North-West University, Unit for Environmental Sciences and Development) within 48 h of sampling.
The samples were prepared and analysed using a spectroscopic identification method (Fourier transform infrared (FT-IR) spectroscopy) (Crichton et al., 2017; Primpke et al., 2017; Dyachenko et al., 2017) for the identification and enumeration of microplastics (Fig. 2).
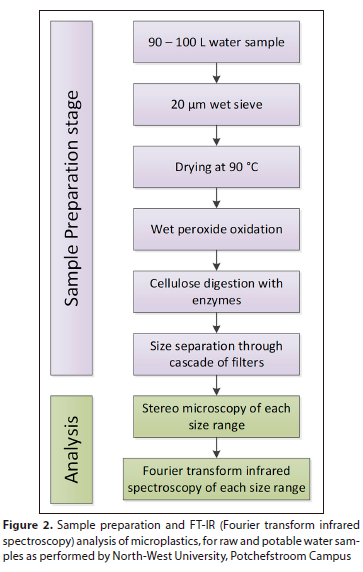
The FT-IR instrument is coupled to a microscope, which allows the detection of smaller microplastics or thin films that do not fully adsorb the IR beam. The analysis was performed by specialists from the North-West University, Potchefstroom Campus, at the unit for Environmental Sciences and Development.
Sample preparation
Samples arrived at the NWU Microplastics Laboratory suspended in a small volume of water. The water was dried overnight (Fig. 2) and covered with aluminium foil to avoid contamination by atmospheric fallout. The dried samples were subjected to temperature-controlled peroxide digestion using Fenton reactants. Three grams of NaI was added per 40 mL of liquid to achieve an approximate density of 1.05 g/L. The samples were then placed in density separators and stirred vigorously to prevent microplastics from being trapped in settled debris.
After the samples were left overnight in the density separators and clear settling of sediments was observed, the sedimented layer was removed and retained in a Petri dish. This was subsequently inspected for microplastics using a stereo microscope. If any possible plastic particles were found, they were removed using a pair of forceps and added to the rest of the collection for that sample. The remainder of the liquid containing less dense material such as plastic was filtered through a custom-made 25 µm filter, which contained a rubber O-ring to secure the filtered liquid.
Analysis
Each stainless-steel filter was inspected using a Nikon EZ 100 multi-zoom compound binocular microscope. The filter was placed over a grid to aid visual counting (Fig. 2). The longest dimension of each particle was measured using the NIS Elements D Imaging software (Nikon). Fragments and fibres were counted on separate matrices documenting the size and colour of each particle. Visual criteria applied were particles that contained no cellular structure or showed signs of degradation due to digestion. The shape, crystalline structure, and breakage patterns of the particles were also considered. Fragments and fibres were counted separately according to their size and colour. A procedural blank was run in parallel with the processing and analysis of the 10 samples; 25 fibres and 9 fragments were detected in the blank and subtracted from the final results to account for method contamination.
Ten percent subsamples of samples suspended in ethanol were deposited on ZnSe infrared transmission windows for polymer identification using an Agilent Cary 660 FT-IR spectrometer with coupled microscope (Fig. 2) to determine polymer compositions, at Aalborg University Urban Pollution Research Group. FPA images were analysed using siMPle software over standard spectral libraries developed by the software developers.
Monomer/additive analysis
Samples for monomer/additive analyses were taken in three different containers supplied by M&L Laboratory Services that performed the analyses. The containers included one 500 mL amber glass bottle and two 40 mL amber vials. Sampling bottles were filled so that there was no headspace in any of the containers. Samples were placed in a portable ice chest and delivered to M&L Laboratory Services within 36 h of sampling (a SANAS accredited facility, affiliated with ILAC). The samples from the source water and directly after treatment were taken on 6 November 2018. Samples in the distribution network were taken on 7 November 2018. All samples were submitted to M&L Laboratories on 7 November 2018. The samples that were taken the day before submission were placed in a fridge overnight at 5 ± 4°C.
The semi-volatile organic compounds (SVOC) were prepared according to EPA Method 3510C (EPA, 1996a) and analysed by GC/MS (gas chromatography/mass spectrometry) according to EPA Method 8270C (EPA, 1996b). The organic compounds in the aqueous solution were isolated by serial extraction at a specified pH with methylene chloride using a separatory funnel. The extract was dried, concentrated, and exchanged with a solvent compatible with the cleanup or determinative method (EPA, 1996a). The semi-volatile compounds were introduced into the GC/MS. The GC column was temperature-programmed to separate the analytes, which were then detected using a mass spectrometer (MS) connected to the gas chromatograph. Analytes eluted from the capillary column were introduced into the mass spectrometer. Target analytes were identified by comparing their mass spectra with the electron impact (or electron impact-like) spectra of authentic standards. Quantitation was accomplished by comparing the response of a major ion relative to an internal standard using a 5-point calibration curve (EPA, 1996b).
RESULTS AND DISCUSSION
Fibre and fragment enumeration
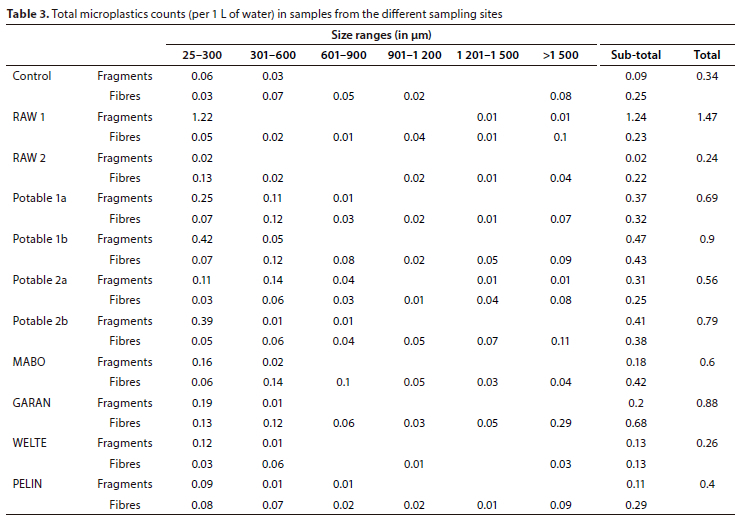
The results from the fibre and fragment enumeration are summarised in Table 3 according to size range.
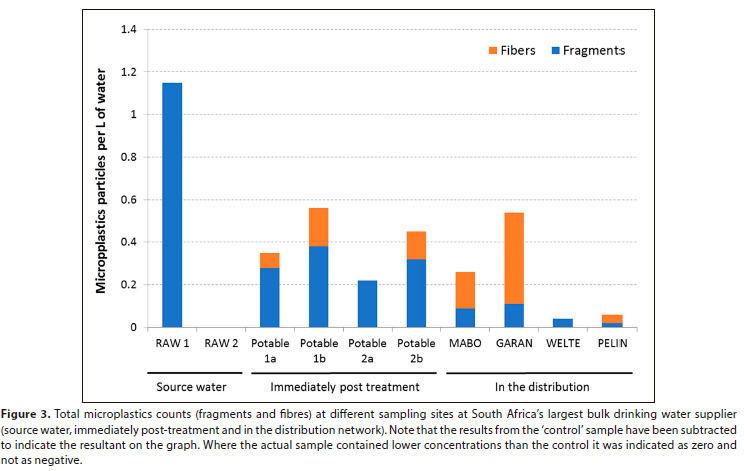
Because plastic is a ubiquitous pollutant and atmospheric fallout is likely to influence the results during sample preparation and counting, a control sample was used to indicate the possible background interference during microplastics identification and enumeration. The control sample (Table 3) shows 0.34 microplastics particles/L. 'RAW 2' (0.24 particles/L), WELTE (0.26 particles/L) and PELIN (0.4 particles/L) ranged very close to the control, indicating negligible amounts of microplastics in the size ranges investigated.
The highest microplastics concentration was found in the 'RAW 1' source water to DWTW 1, 1.47 particles (either fragments or fibres) per litre of water. The other source water sample taken ('RAW 2') showed 0.24 particles/L. It should be noted, however, that the results from RAW 2 might be underestimated because the water contained a lot of debris and the filtration process during sampling was quite cumbersome since the 20 |m sieve was blocked frequently. Therefore, the process had to be repeated by washing the sieve between sampling, and, therefore, loss may have occurred during this 'washing' process. The drinking water, immediately after treatment, ranged from 0.56 to 0.9 particles/L, and the water in the distribution network ranged from 0.26 to 0.88 particles/L. Because the samples taken immediately after treatment and those in the distribution network all occur in very similar ranges, no evidence could be found that the distribution system (pipes, reservoirs etc.) contributes to microplastics in the drinking water (e.g., by bitumen or plastic leaching etc.). The lower concentration of microplastics in the distribution network when compared to that directly after treatment might be an indication that microplastics adhere to pipes and biofilm along the way. It would be interesting to investigate microplastics in the biofilm of this large distribution network.
In most cases microplastics particles in the size range of 25-300 µm were the most abundant (Table 3).
The total microplastics counts (represented by the concentrations determined in the sample and subtracting the concentration from the control sample) at the different sampling sites are displayed in Fig. 2. The results of this study indicate that the microplastics content of the source water (RAW 1 and RAW 2) is below the surface water average (1.9 particles/L) in South Africa, as reported by Bouwman et al. (2018). After subtracting the results from the control (fibres and fragments separately), it appeared that the largest portion of the fibre particles in the samples was due to contamination during the sample preparation step. This indicates the importance of wearing suitable (e.g., cotton) clothing during sampling and sample preparation.
The average number of microplastics Pivokonsky and team (2018) found in raw water ranged from 1 473 ± 34 to 3 605 ± 497 particles/L and in the treated water from 338 ± 76 to 628 ± 28 particles/L. In a later study conducted by the same research group (Pivokonsky et. al., 2020) they found 23 ± 2 and 14 ± 1 particles/L in the raw and treated water from one DWTW and 1 296 ± 35 and 151 ± 4 in the raw and treated water from another DWTW. So even though the results from the current baseline survey (Fig. 3) were significantly lower than the results obtained from the Czech Republic (Pivokonsky et al., 2018; 2020), the results could not be compared because the size ranges were different. It is important to note that the size range that Pivokonsky et al. (2018; 2020) found to contain the highest concentration of microplastics (<20 µm) was not investigated during this study, since it required instrumentation not used in the present study.
FT-IR polymer composition and mass estimation
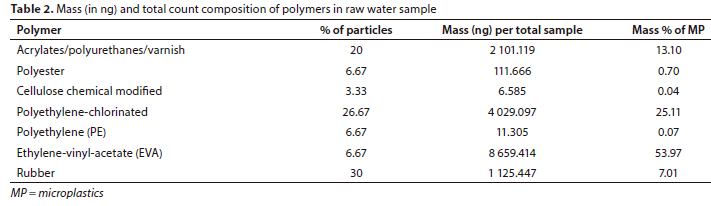
Raw water samples had an estimated 16 044.632 mg of plastic per 100 L sample as determined by semi-automated analysis on siMPle software for FPA FT-IR microplastic samples. The siMPle software was used to calculate the percentage polymer composition of the FPA FT-IR results.
In terms of the number of particles, rubber was the most frequently found polymer. Based on mass, however, as a function of particle size and polymer density, EVA (54.97%) and polyethylene (standard and chlorinated) (25.18%) were the most prevalent (Table 2). EVA is a polymer commonly used as foam in sporting equipment and in the soles of flip-flop sandals.
A comparison of the FT-IR spectra of the different PE density polymers revealed a high degree of similarity, with the exception of a small peak at 1 377 cm-1 visible in the low density-polyethylene (LDPE) and linear low density-polyethylene (LLDPE) spectra, yet absent in the high density-polyethylene (HDPE) spectra (Jung et al., 2018). Differentiation between these polymer spectra, with the low signal-to-noise ratio obtained in IR spectra from small microplastic particles, is virtually impossible, and therefore all PEs are grouped together in the results. PE is a commonly used polymer with a broad variety of applications, explaining its relatively high levels in environmental water samples.
Monomer/additive analysis
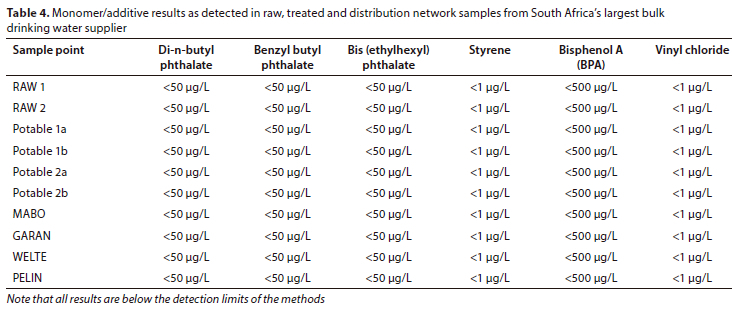
The results for the monomer/additives analysed in the 10 different samples is summarised in Table 4. None of the 6 monomers/ additives could be detected in any of the samples, which includes source water samples (RAW 1 and RAW 2), samples immediately after treatment (Potable 1a, Potable 1b, Potable 2a and Potable 2b), as well as samples in the distribution network (MABO, GARAN, WELTE and PELIN).
CONCLUSIONS
In the current baseline study, performed at South Africa's largest bulk drinking water supplier, drinking water proved to have <1 particle per litre of water of microplastics content (either fragments or fibres). The current study showed little evidence that the drinking water treatment processes significantly reduced the number of microplastics particles during treatment; however, follow-up studies are necessary to confirm this result. The study found that the smaller microplastics particles (between 1 and 300 µm) were the most abundant in source and drinking water and were also the least effectively removed during drinking water treatment. This study could also not find any evidence that microplastics increased in the distribution network (e.g., by bitumen or plastic leaching, etc.). The known monomers/additives associated with microplastics (di-n-butyl phthalate, benzyl butyl phthalate, bis (ethylhexyl) phthalate, styrene, bisphenol A and vinyl chloride) could not be detected in any of the samples (which include source water and drinking water samples).
RECOMMENDATIONS
From a water board perspective, the following recommendations should be considered:
• Since the current study only included samples from the source water, after treatment and in the distribution network, follow-up studies should be performed to determine the extent of microplastics prevalence from source to tap, which would include samples at customer taps for a holistic view of microplastics occurrence.
• Follow-up studies should include sampling occasions during high-flow seasons (summer when rainfall is high) and low-flow seasons (winter when rainfall is low).
• In-line sampling apparatus should be constructed for future sampling occasions to reduce microplastics contamination from the air during sampling and additionally allow for the sampling of higher volumes of drinking water.
• Most literature on microplastics in tap water suggests that particles < 20 µm are the most abundant and, therefore, future investigations should include particle sizes < 20 µm.
AUTHOR CONTRIBUTIONS
Annelie Swanepoel: Conceptualisation and methodology of the study, data collection and field work, interpretation of results, writing of the initial draft. Hein du Preez: conceptualisation and methodology of the study, data collection and field work, interpretation of results, revision after review. Henk Bouwman: conceptualisation and methodology of the study, interpretation of results, revision after review. Carina Verster: conceptualisation and methodology of the study, sample/data analysis, interpretation of results, revision after review.
ORCID
Annelie Swanepoel: https://orcid.org/0000-0001-6328-2197
REFERENCES
BLETTLER MCM, ABRIAL E, KHAN FR, SIVRI N and ESPINOLA LA (2018) Freshwater plastic pollution: Recognizing research biases and identifying knowledge gaps. Water Res. 143 416-424. https://doi.org/10.1016/j.watres.2018.06.015 [ Links ]
BOUWMAN H, MINNAAR K, BEZUIDENHOUT C and VERSTER C (2018) Microplastics in freshwater water environments. WRC Report No. 2610/1/18. Water Research Commission, Pretoria. 61 pp. ISBN: 978-0-6392-0005-7. [ Links ]
CRICHTON ME, NOËL M, GIES EA and ROSS PS (2017) A novel, density-independent and FTIR-compatible approach for the rapid extraction of microplastics and aquatic sediments. Anal. Methods 9 1419-1482. https://doi.org/10.1039/C6AY02733D [ Links ]
DYACHENKO A, MITCHELL J and ARSEM N (2017) Extraction and identification of microplastic particles from secondary wastewater treatment plant (WWTP) effluent. Anal. Methods 9 1412-1418. https://doi.org/10.1039/C6AY02397E [ Links ]
EPA (1996a) EPA Method 3510C. Separatory funnel liquid-liquid extraction. URL: https://www.epa.gov/sites/production/files/2015-12/documents/3510c.pdf (Accessed 30 January 2019). [ Links ]
EPA (1996b) EPA Method 8720C. Semi-volatile organic compounds by gas chromatography/mass spectrometry (GC/MS). URL: http://www.caslab.com/EPA-Methods/PDF/8270c.pdf (Accessed 30 January 2019). [ Links ]
GESAMP (2015) Sources, Fate and Effects of Microplastics in the Marine Environment: A Global Assessment. [ Links ]
Kershaw PJ (ed.). IMO/FAO/UNESCO-IOC/UNIDO/WMO/IAEA/UN/UNEP/UNDP Joint Group of Experts on the Scientific Aspects of Marine Environmental Protection. Rep. Stud. GESAMP 90. 96 pp. [ Links ]
JIANG J-Q (2018) Occurrence of microplastics and its pollution in the environment: A review. Sustainable Prod. Consum. 13 16-23. https://doi.org/10.1016/j.spc.2017.11.003 [ Links ]
JUNG MR, HORGEN FD, ORSKI SV, RODRIGUEZ VC, BEERS KL, BALAZS GH, JONES TT, WORK TM, BRIGNACE KC, ROYER SJ and co-authors (2018) Validation of ATR FTIR to identify polymers of plastic marine debris, including those ingested by marine organisms. Mar. Pollut. Bull. 127 704-716. https://doi.org/10.1016/j.marpolbul.2017.12.061 [ Links ]
KIRSTEIN IV, HENSEL F, GOMIERO A, IORDACHESCU L, VIANELLO A, WITTGREN HB and VOLLERTSEN J (2021) Drinking plastics? - Quantification and qualification of microplastics in drinking water distribution systems by µFTIR and Py-GCMS. Water Res. 188 116519 1-9. https://doi.org/10.1016/j.watres.2020.116519 [ Links ]
MASURA J, BAKER J, FOSTER G and ARTHUR C (2015) Laboratory methods for the analysis of microplastics in the marine environment: recommendations for quantifying synthetic particles in waters and sediments. NOAA Technical Memorandum NOS-OR&R-48. NOAA Marine Debris Division, Silver Spring, MD. 31 pp. https://doi.org/10.25607/OBP-604. [ Links ]
MINTENIG SM, LÖDER MGJ, PRIMPKE S and GERDTS G (2019) Low numbers of microplastics detected in drinking water from ground water sources. Sci. Total Environ. 648 631-635. https://doi.org/10.1016/j.scitotenv.2018.08.178 [ Links ]
MUKOTAKA A, KATAOKA T and NIHEI Y (2021) Rapid analytical method for characterization and quantification of microplastics in tap water using a Fourier-transform infrared microscope. Sci. Total Environ. 790 148231. https://doi.org/10.1016/j.scitotenv.2021.148231 [ Links ]
ORB (2017) Invisibles: The plastic inside us. URL: https://plasticoceans.org/wp-content/uploads/2017/09/Orb-Media-Plastics-Story-Toolkit.pdf (Accessed 16 April 2020). [ Links ]
PENG J, WANG J and CAI L (2017) Current understanding of microplastics in the environment: occurrence, fate, risks, and what we should do. Integrated Enviro. Assess. Manage. 13 (3) 476-482. https://doi.org/10.1002/ieam.1912 [ Links ]
PIVOKONSKÝ M, CERMAKOVA L, NOVOTNA K, PEER P, CAJTHAML T and JANDA V (2018) Occurrence of microplastics in raw and treated drinking water. Sci. Total Environ. 643 1644-1651. https://doi.org/10.1016Zj.scitotenv.2018.08.102 [ Links ]
PIVOKONSKÝ M, PIVOKONSKÁ L, NOVOTNÁ K, CERMÁKOVÁ L and KLIMTOVÁ, M (2020) Occurrence and fate of microplastics at two different drinking water treatment plants within a river catchment. Sci. Total Environ. 741 140236. https://doi.org/10.1016/j.scitotenv.2020.140236 [ Links ]
PLASTICSEUROPE (2015) Plastics - the Facts 2015, An Analysis of European Plastics Production, Demand and Waste Data. Plastics Europe, Association of Plastic Manufacturers, Brussels. [ Links ]
PRIMPKE S, LORENZ C, RASCHER-FRIESENHAUSEN R and GERDTS G (2017) An automated approach for microplastics analysis using focal plane array (FPA) FTIR microscopy and image analysis. Anal. Methods 9 1499-1511. https://doi.org/10.1039/C6AY02476A [ Links ]
ROCHMAN CM, BROWNE MA, HALPERN BS, HENTSCHEL BT, HOH E, KARAPANAGIOTI HK, RIOS-MENDOZA LM, TAKADA H, TEH S and THOMPSON RC (2013) Policy: classify waste as hazardous. Nature 494 (7436) 169-171. https://doi.org/10.1038/494169a [ Links ]
VAN ROOYEN C (2016) NMP as a mechanism of accumulation by dispossession: The case of a public bulk water provider in South Africa. Presentation to the SANORD Conference, 2016. URL: https://www.slideshare.net/carinavr/npm-as-a-mechanism-of-accumulation-by-dispossession-the-case-of-a-public-bulk-water-provider-in-South-Africa (Accessed 15 May 2019). [ Links ]
WANG F, WONG CS, CHEN D, LU X, WANG F and ZENG EY (2018) Interaction of toxic chemicals with microplastics: A critical review. Water Res. 139 208-219. https://doi.org/10.1016/j.watres.2018.01.031 [ Links ]
WAGNER M and LAMBERT S (eds) (2018) Freshwater Microplastics. Emerging Environmental Contaminants? The Handbook of Environmental Chemistry 58. Springer Open. 303 pp. https://doi.org/10.1007/978-3-319-61615-5 [ Links ]
WHO (2019) Microplastics in Drinking Water. WHO, Geneva. ISBN: 978-92-4-151619-8. 84 pp. [ Links ]
 Correspondence:
Annelie Swanepoel
Email:aswanepo@randwater.co.za
Received: 14 June 2022
Accepted: 17 October 2023

