


Serviços Personalizados
Artigo
 Inglês (pdf)
 Artigo em XML
 Referências do artigo
Indicadores

Links relacionados
-
 Citado por Google
 -
 Similares em Google
Compartilhar

 Permalink
Water SA
versão On-line ISSN 1816-7950
versão impressa ISSN 0378-4738
Water SA vol.49 no.3 Pretoria Jul. 2023
http://dx.doi.org/10.17159/wsa/2023.v49.i3.4004
RESEARCH PAPER
Monitoring seasonal variations of haloacetic acids (HAAS) in low-TOC and low-chlorine networks and assessing risk to public health: Mus, Türkiye case
Edip AvjarI; Adile KiliçII
IVocational School Environmental Protection Technologies Department, Bilecik Seyh Edebali University, Bilecik, Türkiye
IIGraduate Education Institute, Bitlis Eren University, Bitlis, Türkiye
ABSTRACT
Chlorine not only removes parasitic pathogenic microorganisms in water, but also causes the formation of disinfection by-products (DBPs) that can be carcinogenic to humans, due to reacting with natural organic matter (NOMs) in raw water sources. Haloacetic acids (HAAs) are one of the most well-known and common disinfection by-product groups (DBPs) in the literature. In the risk definitions of the EPA, some of its components have been identified as carcinogenic. Therefore, determination of HAA concentration in water and execution of a risk analysis are very important in terms of determining the possible effects on public health. This study aimed to monitor the seasonal and spatial variations of haloacetic acids (HAAs) in 2 different water supplies (surface and groundwater) serving the city center of Mu§ Province, Türkiye, and to demonstrate their public health implications. In this context, an analytical study was conducted covering 4 seasons. According to the results, although the amount of NOM in water bodies was less than 1 mg-L-1, the HAA5 content may occasionally exceed the USEPA limits of 60 Mg-L-1, but did not exceed the Canadian 80 Mg-L-1 limit. When the WHO limit values were examined on a component basis, it was determined that the MCAA concentrations in both water sources sometimes exceeded the limit of 20 Mg-L-1 in the July and October sampling periods. The risk level related to maximum DCAA level in the main network by means of ingestion pathway was found to be 18.7 times higher for women and 16.5 times higher for men when compared with USEPA risk criteria. Also, in the Muratpa§a water network, risk from DCAA exceeds the USEPA risk level 15.2-fold in women and 13.4-fold in men. However, since it was also found that the level of free chlorine in the network does not meet the required level, it should be noted that there may be an increase in the risk level if there is adequate chlorination in the supply.
Keywords: HAAs, risk assessment, DCAA, chlorination, groundwater, Mus Province
INTRODUCTION
Chlorine is the most commonly used disinfectant in drinking water treatment due to its low cost, ease of use, and effectiveness in preventing waterborne disease. Chlorine kills or deactivates a large variety of waterborne microorganisms. However, since the mid-1970s, public health concerns about the disinfection process have increased. Studies have shown that chlorine reacts not only with waterborne parasitic pathogenic microorganisms, but also with natural organic matter (NOM), bromide, iodide, and nitrite in water to form trihalomethanes (THMs), haloacetic acids (HAAs), halonitromethanes (HNMs) and other disinfection by-products (DBPs) (Avsar et al., 2014; Avsar et al., 2015; Özdemir, 2020).
Studies on the formation of DBPs post-chlorination have shown that more than 700 species are formed in the water. However, in addition to these, there are also undetectable halogenated organic structures and it is clear that the undetectable compounds make up a significant portion of the total (Avsar et al., 2014; Avsar et al., 2015; Özdemir, 2021).
Given such potentially carcinogenic effects of some DBPs, DBP formation is the most important problem of the drinking water sector. Toxicological studies also show that DBPs can have adverse effects on development and reproduction. The potential health risks of DBPs have put pressure on industrialized countries to introduce maximum contaminant levels (MCL), in other words, limits, for types of DBPs in drinking water (Uyak et al., 2014).
HAAs is one of the important DBP groups and the most prevalent HAAs are MCAA (monochloroacetic acid), TCAA (trichloroacetic acid), and DCAA (dichloroacetic acid). The sum of MCAA, MBAA (monobromoacetic acid), DCAA, TCAA, and DBAA (dibromochloroacetic acid) is expressed as HAA5. HAA5 plus BCAA (bromochloroacetic acid), TBAA (tribromoacetic acid), BDCAA (bromodichloroacetic acid) and CDBAA (dibromochloroacetic acid) together makes up HAA9. The United States Environmental Protection Agency's (USEPA) integrated risk information system has classified DCAA as a Group B2 (probable human carcinogen) and TCAA as a Group C (possible human carcinogen) component, and both components have been shown to be carcinogenic in animals (Avsar et al., 2014; Avsar et al., 2015; Thompson et al., 2015).
In 1998, because of the possible health risks, the maximum contaminant level of HAA5 was set to 60 μg L-1 by the USEPA. In Canada, the limit has been set at 80 μg L-1 since 2008. The World Health Organization (WHO) has set up guidelines for chlorinated HAAs (MCAA: 20 μg L-1, DCAA: 50 μg L-1, TCAA: 200 μg L-1), but not for brominated HAAs. Neither the European Union nor Türkiye has set a limit value yet. However, the amount of HAA9 in bromine-rich waters is 20-50% higher
than HAA5, and it is important to consider HAA9 in such waters because brominated species are potentially more carcinogenic than chlorinated species (Health Canada, 2008; Thompson et al., 2015).
Monitoring HAAs in the drinking water network is a complex process. Various parameters, such as the disinfection plan and chemicals used (chlorine or chlorine/chloramine or ozone/ chlorine), water treatment processes, water source characteristics, bromide content, pH of chlorinated and distributed water, temperature, concentration of total and free chlorine, residence time, distribution system characteristics, and total organic carbon (TOC), affect the formation of HAAs. The formation kinetics, formation and stability of HAAs are still not completely understood. It is known that HAAs form faster than THMs, that some species decompose as pH increases, and that some species biodegrade in the absence of residual chlorine (Uyak et al., 2014; Thompson et al., 2015).
The formation of HAAs in chlorinated water varies considerably depending on the season and the length of the distribution system. These variations depend on the quality of the raw and treated water and on the operating parameters of the treatment plant as well. There are studies showing that the concentration of HAAs tends to first increase and then decrease with extended residence time in the water network (Uyak et al., 2014, Thompson et al., 2015). Because of all these reasons, monitoring seasonal changes in HAAs in drinking water systems as a function of the length of the distribution system is important for protecting public health and providing healthy drinking water.
In a study conducted by Uyak et al. (2014), seasonal and spatial variation in HAAs was observed in drinking water distribution networks fed by 3 different drinking water treatment plants in Istanbul. The highest median HAA9 concentrations were observed in the spring and summer seasons, while the lowest concentrations were obtained in the autumn and winter periods. DCAA and TCAA were identified as the most significant HAA9 components. It was observed that the seasonal average values of HAA9 in all three distribution systems remained below 60 μg L-1, while the HAA9 concentration in only one sample was measured to be 100.16 μg L-1 during the sampling period.
According to a study that was conducted in Istanbul surface water sources (Büyükcekmece and Ömerli Lakes, between February 2010 and February 2011) by Avsar et al. (2014); the most important HAA9 formation was caused by hydrophobic (HPO) and hydrophilic (HPI) fractions of NOM, respectively. According to Avsar et al. (2015), which was conducted for the same water sources as Avsar et al. (2014), organic substances with a molecular size below 1 kDa were found to be effective in the formation of HAA9.
Uyak et al. (2007) studied Terkos, Büyükcekmece and Ömerli Lakes, Istanbul, with different bromide and organic matter concentrations, and observed the effect of this difference on DBP formation in terms of contact time, pH, chlorine dose and specific ultraviolet absorbance parameters. The predominant species of HAA was TCAA, followed by DCAA, with 60%, 49%, and 66% of total HAA in Terkos, Büyükcekmece, and Ömerli, respectively.
In the study of Ates et al. (2007), a total of 29 surface waters from different regions of Türkiye were sampled seasonally and DBP formation potential was determined. The results showed that dissolved organic carbon (DOC) content was low in all water samples and ranged from 0.91 to 4.42 mg-L-1. The ranges of annual average total THM and HAA concentrations were 21-189 and 18-149 μg-L-1, respectively. Although the amount and distribution of DBPs vary by water source and season, chloroform and trichloroacetic acid (TCAA) are the most important species. The lack of a consistent trend in seasonal variations in water bodies suggests that the characteristics of dissolved organic matter (DOM) and its reactivity with chlorine vary seasonally in almost all water bodies.
Chen et al. (2008) investigated the formation potential for THMs and HAAs in a traditional water treatment plant in northern China. The highest concentrations of THMs and HAAs (each almost 500 μg-L-1) were detected in autumn and the lowest in spring (no more than 100 μg-L-1). Organic matter and algae were found to be significant DBP precursors. The hydrophobic acid fraction has the highest THM and HAA formation potential. Algae contribute about 20% to 50% of the total DBP formation potential during an algal bloom.
Gan et al. (2013) measured DBPs from the distribution systems of 10 water treatment plants in 3 provinces in China. The median of THM and HAA levels ranged from 0.7-62.7 μg-L-1 and 0.3-81.3 μg-L-1, respectively. Chloroform, DCAA and TCAA were the dominant species observed in Guangzhou and Foshan water, while brominated THMs predominated in water from Zhuhai. THMs and HAAs showed clear seasonal variations with the total concentrations higher in winter than in summer.
Ghoochani et al. (2013) examined the variation of organic matter and HAA formation through samples collected from 3 major rivers (raw water) and 3 water treatment plant outlets (chlorinated water) supplied by these rivers in Tehran, Iran. Changes in the total organic matter (TOC), ultraviolet absorbance (UV254), and specific ultraviolet absorbance (SUVA) were measured in raw water samples. HAAs were also measured in chlorinated water samples. The seasonal average concentration of TOC for the 3 rivers and HAAs for the 3 water treatment plants in were 4.00, 2.41 and 4.03 mg-L-1 and 48.75, 43.79 and 51.07 μg-L-1 for spring, summer and autumn, respectively. Seasonal variation indicated that HAA levels were much higher in spring and autumn, whereas TOC concentrations were similarly higher.
Golea et al. (2017) investigated the effect of DOM in THM and HAA formation in raw and treated surface waters. DBP formation potential in surface water sources has been studied with reference to the key water quality determinants (WQDs) of UV absorption (UV254), colour, and DOM concentration. The DOM in the raw waters was found to comprise 30-84% (average 66%) of the more reactive HPO fraction, with this proportion falling to 18-63% (average 50%) in the treated water. Results suggest UV254 to be as good an indicator of DBPFP as DOC or HPO for the raw waters, with values ranging from 0.79 to 0.82 for THMs and from 0.71 to 0.73 for HAAs for these three determinants. For treated waters the corresponding values were significantly lower, reflecting the lower HPO concentration.
Guilherme et al. (2014) investigated the occurrence of regulated and non-regulated DBPs in the drinking water of small systems in 2 provinces in Canada. It was reported that average measured concentrations of these compounds was much higher than that reported in the literature for medium and large systems. The measured average value for THMs was 75 μg-L-1 and for HAAs was 77 μg-L-1. Investigated DBPs decreased between the autumn and winter and then increased to eventually reach a maximum in late summer.
Rodriguez et al. (2004) investigated the seasonal and spatial variation of post-chlorination DBPs in a drinking water distribution system located in a region where very significant seasonal variations in water temperature and surface water quality occur. The analysis of a large number of collected samples showed that the seasonal and geographical variations of THMs and HAAs were of particular importance in this region. THM levels were found to be about 5 times higher on average in summer and autumn than in winter, while average HAA levels were about 4 times higher in spring than in winter.
Rodriguez et al. (2007) studied HAA formation during the treatment process in 2 facilities where surface water is pre-chlorinated. Samples were collected over 1 year at 4 stations in order to investigate both seasonal and spatial variations of HAAs. The results revealed that the formation of HAAs was highest during the pre-chlorination process, where precursor compounds and pre-chlorination dose were both higher and more variable, and that formation lasted from the pre-chlorination point until the settled water occurred, due to remaining levels of residual chlorine. It was identified that DCAA was the predominant HAA species.
To understand water quality variability in small systems, Scheili et al. (2015) monitored water quality in 25 small municipal systems in 2 Canadian regions from the water source to the end of the distribution system. The database obtained was used to create a global portrait of physical, chemical, and microbiological water quality parameters. It was observed that the values of DOM varied during the different seasons, with maxima in autumn for both provinces. In the regions studied, the highest THM and HAA values were reached in the warmer seasons (summer, autumn), as observed in previous studies with large systems. Observed THM and HAA levels were 3 times higher in systems in the province of Newfoundland and Labrador than in the province of Quebec.
Serodes et al. (2003) chlorinated seasonally treated waters from 3 major drinking water supplies in the Quebec City region and studied the formation of THM and HAA. They concluded that chloroform was the predominant compound for THM species, while dichloroacetic acid and trichloroacetic acid were the most abundant for DBP species due to low bromide concentrations in the raw waters. Significant differences in DBP formation were observed, mainly due to the type of disinfectant used for raw water in the three utilities. The use of pre-ozonation as opposed to pre-chlorination (or direct chlorination) in one of the utilities appears to be the primary factor contributing to that utility's ability to meet current THM and future HAA standards.
In this study, HAA formation and health risk via ingestion were investigated in 2 networks fed by groundwater and surface water, where the organic matter level is low, when chlorination is not properly utilized (under uncontrolled conditions). HAAs are of special importance in these networks, since the networks are short and HAAs are formed faster than other DBPs. In addition, no study has been found in the literature evaluating the formation of HAA under insufficient chlorination conditions in groundwater with low NOM levels. There is also no study apparent in the literature on whether HAA formation will pose a risk in low organic content waters under insufficient chlorination conditions. In this study, answers to all these questions were sought. Although the formation of HAA is important and may pose a risk in Türkiye, there is no limit value being applied yet.
MATERIALS AND METHODS
Sampling points
This study investigated the quality of raw water sources used in Mus Province city centre, the seasonal and spatial variance of HAAs formed after chlorination of these sources, and the risk to human health via ingestion. Therefore, sampling and analytical studies were conducted on the dates of 20 July 2017 (summer); 26 October 2017 (autumn); 8 January 2018 (winter); and 7 March 2018 (spring) in the city centre of Mus Province, to characterize the summer, autumn, winter, and spring seasons. Figure 1 shows the location of Mus, networks and sampling points used in the study.
The drinking water network for Mus city centre is provided from groundwater extracted by 17 existing boreholes around the main pumping station (Point 1 in Fig. 1). The water taken through the boreholes is pumped to the tank of the main pumping station, and released to the water network after chlorination via liquid sodium hypochlorite solution (NaOCl). There is also another small network in the city centre. Water from a mountain spring (surface water) is fed to the Muratpasa water tank, chlorinated with NaOCl, and pumped to the small water network (Point 5 in Fig. 1). Figure 2 shows photographs of the water tanks.
The characteristics of water networks and sampling points are shown in Table 1. The points in Table 1 are arranged in the order relating to the water path between source and water network.
It was observed that the water drawn from 17 boreholes in the vicinity of the main pumping station, Station 1, reached the main pumping station where it was mixed in the tank, chlorinated, and sent to the Reservoir 3 at Point 9 and released to the network. Seasonal sampling and analyses were conducted at Points 2, 9, 7, 10, 4 and 3 of this network. Additionally, seasonal sampling and analyses were conducted for Muratpasa reservoir, where the mountain spring was located, and at Points 6 and 8 of the network supplied from this reservoir. HAAs from post-chlorination DBPs in the reservoirs and water distribution systems of 2 different distribution networks were monitored. The sampling points in both networks are listed in Table 1, give in order from the source to the final distribution point.
One-time sampling was conducted in the context of 4 different seasons from 2 networks consisting of 10 points in total. Water was wasted for at least 1 min in each fountain before sampling. Samples were taken in polyethylene sample containers and transferred to the laboratory for further analysis.
Analytical methods
As part of the study, the water quality parameters and post-chlorination-formed HAA species were measured in 4 seasons in 2 water reservoirs and water networks where the existing water is supplied in the reservoirs in the city centre of Mus..
The parameters measured, the devices used and the measurement methods of the devices are given in Table 2. Detailed analytical methods are given in Avsar and Toröz (2018); Avsar et al. (2014); Avsar et al. (2015) and Avsar et al. (2020).
Conductivity, pH, ORP, free and total chlorine, and turbidity were measured on-site after sampling. Than samples were dechlorinated with 0.1 mL of 100 mg-mL-1 Na2S solution and transferred to the laboratory for further analysis, given in Table 2.
HAA analysis was conducted according to USEPA 552.3 liquid-liquid micro-extraction method via a GC equipped with μECD detector. The method consists of sample extraction and methyl ester conversion of HAA species. Further information about device, method and detection limits is given in Avsar and Toröz (2018).
RESULTS
The research carried out consisted of 2 stages. In the first stage, sampling and analysis were carried out for 2 different networks. In the second stage, according to the HAA analysis results obtained in the first stage, risk analysis was conducted to determine whether drinking these waters poses a human health risk.
Analytical results
The water quality parameters for the samples taken from the main reservoir and its network in the 4 seasons are compared with Turkish Standards (TS 266, 2005: water intended for human consumption) in Table 3. Minimum, maximum and mean values for the main reservoir are given in Table 4.
A comparison of seasonal results for Muratpasa water reservoir and its network with Turkish Standards of is given in Table 5. Minimum, maximum and mean values of the results for Muratpasa network are given in Table 6.
HAA concentrations recorded in 2 reservoirs and their networks are given in Tables 7 and 8.
Sampling points for both water supplies are listed in the tables in an order that matches the route the water takes in the water network.
When the water quality results are examined, it can be seen that chlorination was insufficient in both water sources. Free chlorine was detected at the main reservoir outlet (Point 2) in 4 seasons (min: 0.2; max: 1.3 and mean: 0.9 mg-L-1). However, in general, free chlorine in the main network is depleted as it goes from reservoir outlet (Point 2) to network end-point (Point 3). At Point 3, no free chlorine was detected in the water during any sampling period (Tables 3-4).
Except for the last point (Point 8: min: 0; max: 0.6; mean: 0.2 mg-L-1), no chlorine was found in the network during the sampling period in the Muratpasa reservoir and network (Tables 5-6). This is related to frequent power cuts in the city. When the electricity is off, the chlorine dosing system is disabled. The dosing system is not activated automatically when the electricity is re-supplied to the system. Manual start-up of the dosing system is required. This prevents sufficient chlorine dosing to the system.
TOC (min: 0.0021; max: 0.3553; mean: 0.1787 mg-L-1), TN (min: 1.9166; max: 2.4552; mean: 2.2773 mg-L-1) and turbidity (min: 0.10; max: 0.65; mean: 0.27 NTU) values in the main reservoir were generally at low levels. It was observed that the nitrate value (min: 2.00; max: 4.80; mean: 3.55 mg-L-1) remained below the TS 266 limit value throughout the monitoring period. The UV254 parameter (min: 0.002; max: 0.0140; mean: 0.0063 cm-1), which is an indicator of the organic content in the water, is similarly low, along with the TOC values. These results indicate that there is no significant pollution of the groundwater, in general.
TOC (min: 0.1088; max: 0.3052; mean: 0.2070 mg-L-1) and TN values (min: 0.6358; max: 1.0441; mean: 0.8729 mg-L-1) in the Muratpasa reservoir were also low. However, from time to time, the limit value is exceeded in terms of turbidity in the reservoir (max: 4.19 NTU) and network (max: 2.11 NTU). It is thought that this situation is due to the leakages that occur due to the age of the pipelines.
The low UV254 values in both networks indicate low organic content in the waters. There was no significant change in conductivity or ORP values either. There was no significant change in water quality parameters at the measurement points of both networks. It is thought that the changes at specific measurement points that can be seen in the parameters from time to time are related to the network leakages that occur from time to time at these points.
USEPA National Primary Drinking Water Regulation (1994) states that in order to prevent DBP formation, the TOC concentration in the water should be reduced to below 2 mg-L-1 before chlorination. However, although the TOC and UV254 parameters in both networks are considerably lower than the values specified in the publications referenced in the introduction, it was determined that the USEPA HAA5 limit value of 60 μgL-1 is exceeded (max: 68.87 μgL-1) in the main network at times. HAA9 values reach values of up to 91.54 μgL-1. In Muratpasa network, the HAA5 limit value was not exceeded. However, despite the lack of sufficient chlorine in the water, concentrations close to the limit value (max HAA5: 54.95 μgL-1) were determined, while maximum HAA9 concentration was determined as 55.07 μgL-1. On the other hand, MCAA can occasionally exceed the WHO limit value of 20 μgL-1 in both networks. This shows that there is potential for HAA formation in the case of adequate chlorination of the water, and that the water includes precursor compounds for DBP formation.
The fact that there is not enough chlorine in the water most of the time made it impossible to make a seasonal assessment of HAA formation. In both networks, HAA components could not be detected in the water in the winter and spring periods. Likewise, although the amount of bromide in both water supplies is highest in the winter and spring periods, the absence of HAA detection during these periods makes it impossible to evaluate the effect of bromide on HAA formation potential.
In both networks, the most important HAA component was determined as MCAA. In general, the irregularity of chlorination in the networks prevents the evaluation of the residence time in the both networks. However, considering the summer period in which HAA types were detected in both networks, the highest HAA5 and HAA9 concentrations were determined towards the end in the main network and at the last point in the Muratpasa network.
The low bromide level in both water sources limits the formation of brominated HAAs in the water. Brominated species were not detected in water for most of the sampling period.
Risk assessment
Despite the lack of sufficient chlorination and the low organic matter content in both networks, it was observed that HAA species could form and exceed the limit values from time to time. In this context, the effect of consuming these waters on public health in terms of HAA compounds was determined through a risk assessment.
The measurement of cancer risk for DBPs is performed from 3 perspectives: through oral ingestion, dermal absorption, and inhalation exposure. However, since there are only risk factors for oral ingestion of HAA components (DCAA and TCAA) in the literature, it is not possible to perform measurements for dermal absorption and inhalation exposure. The oral ingestion-related risk is calculated using the following equation (Gan et al., 2013; Avsar et al., 2020):
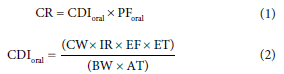
where: CR is cancer risk from HAA component ingestion; CDIora] is chronic daily ingestion of that species (oral: mg-kg-1-day-1); PForal is potential factor or slope factor (oral: mg-kg-1-day-1)
Among the HAAs examined in the study, there are PForal values for DCAA and TCAA reported in the literature as 0.05 and 0.07, respectively (Gan et al., 2013). The variables in Eq. 2 and the values used to calculate them are listed in Table 9.
Given the variables in Table 9, the measured risk values for the highest concentrations obtained in 2 different water supplies for DCAA and TCAA are given in Table 10.
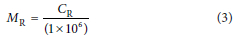
According to the EPA, a probability of occurrence of an event of more than 1 in 1 million means that the minimum or negligible risk level for that event has been exceeded (Gan et al., 2013; Avsar et al. 2020). In this context if the estimated CR is greater than 1 million it indicates a health risk. Alternatively, multiple rate (MR) values can be estimated using Eq. 3.
The risk assessment considered the highest concentrations detected in the network to determine the worst case for the HAA compounds that were used as the basis for the assessment. In this context, the risk level related to DCAA in the main network was found to be 18.7 times higher for women and 16.5 times higher for men, based on the components for which a risk assessment was performed. Since TCAA is not detectable in the network, there is no risk in relation to this component.
In the Muratpasa water network, on the other hand, it was observed that the maximum concentration determined for DCAA exceeds the risk level 15.2-fold for women and 13.4-fold for men. The concentration determined in relation to TCAA does not pose a risk for men or women. However, since it was found that the level of free chlorine in the network does not meet the required level, it should be noted that there may be an increase in the risk level if there is adequate chlorination in the supplies. The risk assessment, therefore, should be repeated using values obtained after adequate chlorination in the system.
Quantitative differences in the variables underlying the calculation for men and women lead to different results, so that the risk values calculated for women are higher at the same concentration.
CONCLUSIONS AND RECOMMENDATIONS
In the study, seasonal changes in water quality parameters in 2 water sources and connected water supplies in Mus city center, and HAA formation as a result of chlorination, were monitored. Both water supplies have undergone many revisions since their construction, but it was not possible to obtain a plan or project on which these revisions were plotted. The networks need to be observable and controllable for the distribution of healthy water. Therefore, a sound network plan should be created, first and foremost.
The first phase of the study consisted of water quality analyses. Chlorine, turbidity, pH, temperature, alkalinity, TOC, TN, ammonia, bromide, UV254, conductivity and ORP parameters were measured.
It was found that several quality parameters can sometimes be outside the limit range given in TS 266. During the monitoring period, adequate and necessary chlorination was not performed in both water supplies. In this context, the chlorination process carried out by the Mus Municipality in the reservoirs and in the network should be monitored regularly. In addition, due to the frequent power outages, it would be beneficial to support the chlorination plant with a generator.
It was observed that the pH falls below 6.5 in winter at Point 6 of the Muratpasa network. This is believed to be a local problem that does not affect the entire network, and it would be beneficial to periodically review the network to identify such local problems and develop solutions.
Turbidity levels exceeded the limit at some locations in both supplies and in the Muratpasa reservoir, especially in the spring season. The high turbidity value in the Muratpasa reservoir indicates that the residence time is not sufficient to allow for solids to settle out or that the reservoir is contaminated or not sufficiently cleaned.
In the second phase of the work, seasonal and spatial monitoring for HAAs in the network was conducted. However, since no chlorine was detected in the water most of the time during the study period, it was not possible to obtain sufficient data to determine the HAA formation potential in the water or the spatial variation. In this case, it will be useful to determine the HAA formation potential in the laboratory by taking raw water from both reservoirs on a seasonal basis.
Given the obtained HAA measurements, it was noted that:
• The HAA5 concentration in the central network exceeds the limit from time to time, while the limit is not exceeded in Muratpasa, but HAA5 levels may exceed the limits if the necessary chlorination is carried out in both waters.
• The limits for MCAA given by the World Health Organization are exceeded from time to time.
• Currently, there appears to be a potential risk to women and men from both supplies with respect to the DCAA component via ingestion.
ACKNOWLEDGMENT
We would like to thank Bitlis Eren University Scientific Research Projects (BEBAP) for providing resources for the performance of our experimental studies with its support in the project numbered 2017.07.
AUTHOR CONTRIBUTIONS
EA (Associate Professor) wrote the manuscript, conducted all the experiments and visited facilities. AK (MsD student) wrote the manuscript and conducted the experiments.
ORCIDS
Edip Avsar: https://orcid.org/0000-0001-6249-4753
Adile Kiliç: https://orcid.org/0000-0003-2222-1704
REFERENCES
ATES N, KAPLAN S, SAHlNKAYA E, YETlS Ü, DlLEK FB and KlTl$ M (2007) Occurrence of disinfection by-products in low DOC surface waters in Turkey. J. Hazardous Mater. 142 526-534. https://doi.org/10.1016/j.jhazmat.2006.08.076 [ Links ]
AVSAR E, TORÖZ 1, HANEDAR A and YILMAZ M (2014) Chemical characterization of natural organic matter and determination of disinfection by-product formation potentials. Istanbul Ömerli and Büyükcekmece surface waters case study. Fresenius Environ. Bull. 23 (2a) 494-501. [ Links ]
AVSAR E, TOROZ I and HANEDAR A (2015) Physical characterisation of natural organic matter and determination of disinfection by product formation potentials in 1stanbul surface waters. Fresenius Environ. Bull. 24 (9) 2773-2770. [ Links ]
AVSAR E, DENlZ AVSAR D and HAYTA $ (2020) Evaluation of disinfection by-product (DBP) formation and fingerprint in a swimming pool in Bitlis/Turkey: a case study. Environ. Forensics 21 (3-4) 375-385. https://doi.org/10.1080/15275922.2020.1772413 [ Links ]
AVSAR E and TORÖZ 1 (2018) Seasonal determination and investigation of disinfection by product formation potentials (DBPFPs) of surface waters, 1stanbul Ömerli and Büyükcekmece Case Study. Anadolu Univ. J. Sci. Technol. B - Theor. Sci. 6 (1) 22-35. https://doi.org/10.20290/aubtdb.333707 [ Links ]
CHEN C, ZHANG XJ, ZHU LX, LlU J, HE WJ and HAN HD (2008) Disinfection by-products and their precursors in a water treatment plant in North China: Seasonal changes and fraction analysis. Sci. Total Environ. 397 140-147. https://doi.org/10.1016/j.scitotenv.2008.02.032 [ Links ]
GAN W, GUO W, MO J, HE Y, L1U Y, L1U W, L1ANG Y and YANG X (2013) The occurrence of disinfection by-products in municipal drinking water in China's Pearl River Delta and a multi pathway cancer risk assessment. Sci. Total Environ. 447 108-115. https://doi.org/10.1016/j.scitotenv.2012.12.091 [ Links ]
GHOOCHANl M, RASTKARl N, NODEHl RN, MAHVl AH, NASSER1 S and NAZMARA S (2013) Study on the TOC concentration in raw water and HAAs in Tehran's water treatment plant outlet. J. Environ. Health Sci. Eng. 11 (28) 1-6. http://doi.org/10.1186/2052-336X-11-28 [ Links ]
GOLEA DM, UPTON A, JARVlS P, MOORE G, SUTHERLAND S, PARSONS SA and JUDD SJ (2017) THM and HAA formation from NOM in raw and treated surface waters. Water Res. 112 226-235. https://doi.org/10.1016/j.watres.2017.01.051 [ Links ]
GUlLHERME S and RODRlGUEZ MJ (2014) Occurrence of regulated and non-regulated disinfection by-products in small drinking water systems. Chemosphere 117 425-432. https://doi.org/10.1016/j.chemosphere.2014.08.002 [ Links ]
HEALTH CANADA (2008) Guidelines for Canadian Drinking Water Quality: Guideline Technical Document Haloacetic Acids. Water, Air and Climate Change Bureau, Healthy Environments and Consumer Safety Branch, Health Canada, Ottawa, Ontario. [ Links ]
ÖZDEMlR K (2021) Investigation of trihalomethane formation after chlorine dioxide preoxidation followed by chlorination of natural organic matter. Environ. Protect. Eng. 47 (2) 125-137. https://doi.org/10.37190/epe210209 [ Links ]
ÖZDEMlR K (2020) Chlorine and chlorine dioxide oxidation of natural organic matter in water treatment plants. Environ. Protect. Eng. 46 (4) 87-97. https://doi.org/10.37190/epe200407 [ Links ]
RODRlGUEZ MJ, SERODES JB and LEVALLOlS P (2004) Behavior of trihalomethanes and haloacetic acids in a drinking water distribution system. Water Res. 38 4367-4382. https://doi.org/10.1016/j.watres.2004.08.018 [ Links ]
RODRlGUEZ MJ, SERODES J and ROY D (2007) Formation and fate of haloaceticacids (HAAs) with in the water treatment plant. Water Res. 41 4222-4232. https://doi.org/10.1016/j.watres.2007.05.048 [ Links ]
SCHElLl A, RODRlGUEZ MJ and SADlQ R (2015) Seasonal and spatial variations of source and drinking water quality in small municipal systems of two Canadian regions. Sci. Total Environ. 508 514-524. https://doi.org/10.1016/j.scitotenv.2014.11.069 [ Links ]
SERODES JB, RODRlGUEZ MJ, Ll H and BOUCHARD C (2003) Occurrence of THMs and HAAs in experimental chlorinated waters of the Quebec City area (Canada). Chemosphere 51 253-263. https://doi.org/10.1016/S0045-6535(02)00840-8 [ Links ]
THOMPSON KC, GILLESPIE S and GOSLAN EH (2015) Disinfection By-Products in Drinking Water. Royal Society of Chemistry, Cambridge. 368 pp. https://doi.org/10.1039/9781782622710 [ Links ]
TURKISH STATISTICAL INSTITUTE (2010) Height and weight statistics. URL: http://www.milliyet.com/ (Accessed 7 March 2018). [ Links ]
TURKISH STATISTICAL INSTITUTE (2018) Life tables 2014-2016. URL: http://www.tuik.gov.tr/ (Accessed 7 March 2018). [ Links ]
USEPA (United States Environmental Protection Agency) (1994) National Primary Drinking Water Regulations; Disinfectants and Disinfection Byproducts; Proposed Rule. Fed. Reg. 59:145:38668. (July 29, 1994). [ Links ]
UYAK V, ÖZDEMlR K and TORÖZ l (2007) Multiple linear regression modeling of disinfection by-products formation in Istanbul drinking water reservoirs. Sci. Total Environ. 378 269-280. https://doi.org/10.1016/j.scitotenv.2007.02.041 [ Links ]
UYAK V, SOYLU S, TOPAL T, KARAPINAR N, ÖZDEMlR K, OZAYDIN S and AV$AR E (2014) Spatial and seasonal variations of disinfection by products (DBPs) in drinking water distribution systems of Istanbul city, Turkey. Environ. Forensics 15 (2) 190-205. https://doi.org/10.1080/15275922.2014.890145 [ Links ]
 Correspondence:
Edip Avjar
Email:edip.avsar@bilecik.edu.tr
Received: 18 June 2022
Accepted: 14 July 2023

