


Servicios Personalizados
Articulo
 Inglés (pdf)
 Articulo en XML
 Referencias del artículo
Indicadores

Links relacionados
-
 Citado por Google
 -
 Similares en Google
Compartir

 Permalink
Water SA
versión On-line ISSN 1816-7950
versión impresa ISSN 0378-4738
Water SA vol.49 no.3 Pretoria jul. 2023
http://dx.doi.org/10.17159/wsa/2023.v49.i3.4050
RESEARCH PAPER
Selenium quantification in wastewaters from selected coal-fired power plants and river waters in South Africa using ICP-MS
Harold H ShiriI; Taddese W GodetoI; Philiswa N NomngongoII; Orpah ZinyembaI
IDepartment of Chemical Sciences, University of Johannesburg, Kingsway Campus, PO Box 524, Auckland Park 2006, South Africa
IIDepartment of Chemical Sciences, University of Johannesburg, Doornfontein Campus, PO Box 17011, Doornfontein 2028, South Africa
ABSTRACT
South Africa mainly relies on Eskom's coal-fired power plants for electricity generation. However, the use of coal causes several adverse environmental impacts, including the release of selenium into the hydrosphere. Selenium is an essential nutrient for humans, animals, and microbes, but excess selenium is toxic. This paper describes the determination of total dissolved selenium in wastewater from selected coal-fired power plants and river waters near coal-fired power plants in South Africa. A sensitive and robust inductively coupled plasma mass spectrometry (ICP-MS) method for determining total dissolved selenium in wastewater and river water was developed using a certified reference material (NIST SRM 1640a Trace Elements in Natural Water). The results agreed with the certified values, with percentage recoveries ranging from 92-96%. The method detection limit was 0.13 μg/L. Total Se concentrations in wastewater samples from Kriel and Lethabo Power Stations ranged between 4.86 and 8.53 μg/L, and in river water samples from the Olifants and Wilge Rivers, the concentrations ranged from 2.63-8.20 μg/L. These results indicate that the Se levels in the wastewater are too low to pose a health hazard to humans and livestock but pose an environmental threat to aquatic life. The low concentrations in the river samples also show that there may be slight Se pollution (regarding aquatic life) from the selected coal-fired power plants in South Africa. There may be slight Se pollution (with regards to aquatic life) from Duvha and Kendal Power Stations because an increase from 2-8 μg/L was observed in river water samples collected near these selected coal-fired power plants.
Keywords: ICP-MS, selenium, wastewater, water quality, South Africa
INTRODUCTION
The use of coal in South Africa, primarily for electricity generation, is unlikely to change significantly in the next few decades owing to the relative lack of suitable alternatives (Doyle, 2015). The use of this fossil fuel, nonetheless, is one of the prime anthropogenic activities that pollute the atmosphere, biosphere, and hydrosphere (Zvereva and Krupskaya, 2013; Hendryx et al., 2020). Pollutants emanating from coal and coal combustion include particulate matter, sulphur dioxide (SO2), nitrogen oxides (NOx), heavy metals, and trace elements (Hg, As, Se, Cd, Cr) (Simons, 1993; Dabrowski et al., 2008; Xu et al., 2017). Some pollutants partition into the water used extensively in various stages of power generation. The power plants generate highly contaminated wastewater (Ribeiro et al., 2010; Vig et al., 2022).
The scientific literature on South African water and wastewater reveals a strong focus on physicochemical parameters (pH, electrical conductivity, temperature, dissolved oxygen, total dissolved solids, alkalinity, hardness), nutrient load (Cl, SO4, NO3, NH4), and total concentrations of major and minor elements (Al, Cr, Fe, K, Mn, Na, Zn) (Edokpayi et al., 2017; Agoro et al., 2018; Nyamukamba et al., 2019; Madilonga et al., 2021). The literature shows a lack of information on the concentration of toxic trace elements (As, Cd, Hg, Se and Pb) in wastewater from South Africa's coal-fired power plants. An element ofparticular interest is selenium (Se), also derived from coal. Selenium is essential in trace amounts for humans, animals, and many organisms due to its antioxidant effects and as a constituent of selenoproteins (Weekley and Harris, 2013; Hossain et al., 2021). However, exposure to large amounts of Se and its salts can be toxic and may cause neurotoxic effects (Vinceti et al., 2014; Ding et al., 2022), unsteady gait, fever, nausea, hair loss, liver, kidney, and heart problems (Kumkrong et al., 2018). Selenium is a chalcogen associated with sulphur-containing minerals, particularly high-sulphur coals (Gorchev and Ozolins, 2011; Lenz and Lens, 2009); consequently, process and wastewater streams from coal-fired power plants can contain elevated concentrations of selenium, far exceeding many discharge limits (Petrov et al., 2012; Stefaniak et al., 2018).
The total content of Se provides a valuable indication of deficiency or pollution intensity. Analysis of Se has been complex, mainly because environmental concentrations are naturally low. Recent improvements in analytical methods enable the routine determination of Se in water samples, even at low concentrations (Johnson et al., 2009; Etteieb et al., 2020a). Regulations are becoming increasingly stringent because Se tends to bioaccumulate up to 100-350 000 times. The implication is that even a trace concentration of 0.1 μg/L in wastewater can easily be elevated to toxic levels; hence, there is a need for analytical methods capable of accurately analysing sub-μg/L concentrations of Se in the presence of interfering matrix components (Lemly, 2004; Tan et al., 2016). Various discharge limits have been set depending on country and region; for instance, the effluent water discharge limit in British Columbia, Canada, is 2 μg/L, while in Japan and Korea, it is 100 μg/L and 1 μg/L, respectively (Tan et al., 2016). United States Environmental Protective Agency (USEPA) wastewater hazard index is 5 μg/L for chronic aquatic life toxicity (Santos et al., 2015) and 20 μg/L for acute aquatic life toxicity (Park et al., 2016; Tan et al., 2016). South Africa's upper limit gazetted by the Department of Water Affairs and Forestry (DWAF) for total selenium in drinking water and water for livestock is 50 μg/L; the limit for water for human consumption and irrigation is 20 μg/L, and the limit for freshwater for aquatic life is 2 μg/L (DWAF, 1996a; DWAF, 1996b).
To comply with these regulations, analytical methods that have been used to quantify total Se include colourimetry, total reflectance-x-ray fluorescence (TXRF) (Li et al., 2014), hydride generation atomic fluorescence spectrometry (HG-AFS) (Shishov et al., 2018), flame atomic absorption spectroscopy (FAAS) (Pettine et al., 2015), graphite furnace-AAS (GF-AAS) (Zacharia et al., 2018), voltammetry (Ashournia and Aliakbar, 2009; Devi et al., 2017), ICP-MS (Etteieb et al., 2020b), and inductively coupled plasma optical emission spectrometry (HG-ICP-OES) (Tyburska et al., 2011; Luo et al., 2017). The American Society for Testing Materials (ASTM) D 3859-08 standard test methods for selenium in waters and wastewaters include the determination of dissolved and total recoverable Se. Two less expensive and widely applied methods are atomic absorption techniques, for example, gaseous hydride AAS and GFAAS (ATSDR, 2003). In the past, fluorimetry was commonly used to determine Se in environmental samples, but more sensitive instrumental methods are replacing it. ICP-OES and ICP-MS are presently the most utilised techniques (Gu et al., 2015; Wieczorek et al., 2017; Etteieb et al., 2020b; Okonji et al., 2021) for Se quantification in aqueous samples. ICP-MS detection of Se is more favoured because of its sensitivity, even without hydride generation or other forms of preconcentration. It offers good selectivity, much simpler spectra than optical techniques, low detection limits (ng/L-μg/L depending on the cleanliness of the laboratory), wide dynamic range, the ability to take isotopic measurements, and low sample consumption (Nemeth and Dernovics, 2015; Kumkrong et al., 2018). Aqueous samples that are analysed using ICP-MS usually require the least sample preparation.
Selenium has been an important subject in numerous investigations because of its dual role as an essential trace element for humans, animals, organisms, and crops, but detrimental at high concentrations. A literature survey reveals that although Se pollution and deficiency is a global concern, there have been no efforts to address this issue in Southern Africa. This lack of effort in addressing this concern is alarming, especially considering that coal mining and combustion (some of the major anthropogenic sources of Se) have been and continue to be practised at a large scale in this region. To address this issue, our study investigated total Se in the effluent (treated wastewater samples) from selected coal-fired power plants and selected rivers (also close to coal-fired power plants).
In view of the above, this study reports a method developed for the determination of Se in wastewater from coal-fired power plants and river water. The developed method was successfully applied to treated wastewater samples from Kriel and Lethabo Power Stations and Wilge and Olifants Rivers water samples. It was important to develop a robust ICP-MS method for the determination of total dissolved Se in both effluent and river water with the least sample preparation and offering very low LOD (which was achieved because samples were only filtered, acidified and analysed). LOD values can be compared with those reported in previous studies (Kumkrong et al., 2018). This is crucial so that the method can be used routinely to analyse effluent and river water samples. It should be noted that the method incorporated 89Y as an IRS rather than the routinely used 72Ge. The 72Ge was (i) highly interfered with by 56Fe16O+ because of the Fe present in the samples (generally, Fe is present in many water samples, and it is crucial to use an IRS with the least or no interferences), and (ii) trace amounts of 72Ge were observed in the samples, and this would inevitably skew the overall results.
This was pivotal in indicating Se status in wastewater from coal-fired power stations and natural waters near the power plants and assessing regulatory compliance. The study facilitates both managerial and technological solutions to the quantification of Se and is vital in making more accurate assessments of the environmental impact and health risks. This study also opens the doorway for more research to be carried out and to gather significant data for South African regulatory bodies to make informed decisions regarding Se. Countries such as the USA, Canada, UK, France, Germany, India, Japan and China have set discharge limits for Se, and a developing country such as South Africa should also develop its limits through investigations similar to our study rather than solely rely on or adopt umbrella discharge limits set by international organisations.
METHODS
Sampling
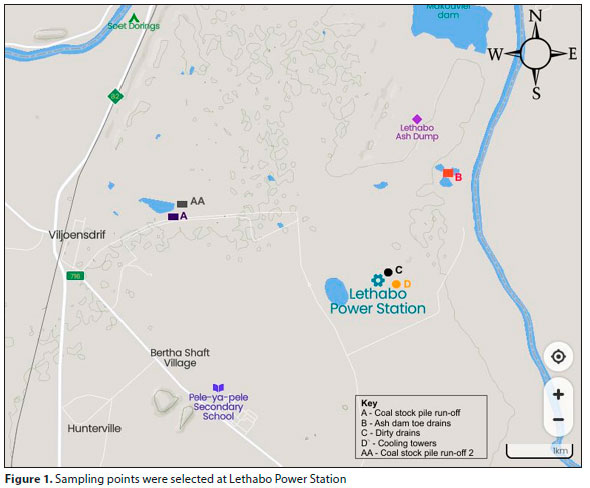
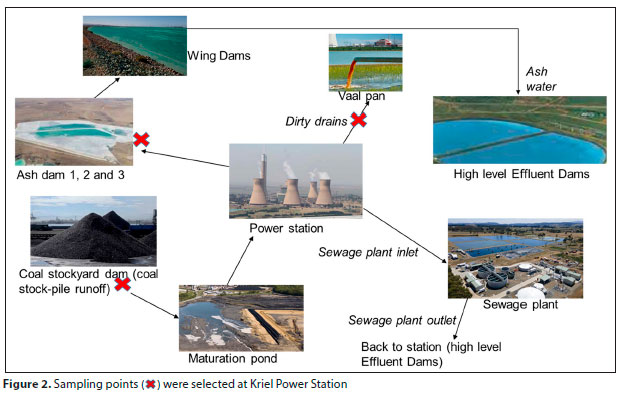
The first batch of samples was received from the Lethabo Power Station (located between Vereeniging and Sasolburg in the Free State Province) and the Kriel Power Station (located between the towns of Kriel and Ogies in the Mpumalanga Province). The sampling points at Lethabo indicated in Fig. 1 were ash dam toe-drains, coal stockpile run-off, cooling towers, and dirty drains. The same sampling points were selected at Kriel, excluding the cooling towers sample. Figure 2 illustrates these selected sampling sites. The second set of samples was collected at Olifants River Site A and Site B (see coordinates in Table 1) near Duvha Power Station, approximately 15 km east of eMalahleni in Mpumalanga, and Wilge River near Kendal Power Station located 40 km southwest of eMalahleni in the Mpumalanga district.
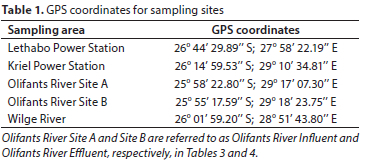
The GPS coordinates for all the sampling sites are shown in Table 1. Sampling at Lethabo and Kriel Power Stations was done during the dry season (i.e., from late April to June), while sampling at Olifants and Wilge Rivers was done during the onset of the wet season in November. Lethabo Power Station is located within Fezile Dabi District Municipality, and during the dry season the area receives an average rainfall of 2.5 mm. Temperatures can vary from -1°C to 20°C and relative humidity from 20% to 90% in winter (Weather Spark, 2023; DMR, 2017). Kriel Power Station and the selected sampling sites at Olifants and Wilge Rivers fall under Nkangala District Municipality. During the wet season, the rainfall received varies from 180-500 mm, and the average minimum and maximum temperatures are 10°C and 35°C, respectively (NDM, 2015).
During each sampling programme, the physicochemical parameters measured were temperature, pH, and electrical conductivity (EC). Water samples were collected using a clear acrylic Kemmerer Sampler for surface water and a beaker scoop similar to the Telescoop beaker scoop (600 mL) for the shallow regions of the rivers. Samples were filtered through 0.45 μιη filter paper into high-density polyethylene (HDPE) bottles. Each filtered sample was preserved in 1% HNO3, transported in a portable ice chest with ice to the laboratory, and stored in the refrigerator at 4°C before analysis.
Reagents
All reagents were of high analytical purity and were used without further purification. Ultra-pure water (specific resistivity 18.2 MOcm) was used for all dilutions and rinsing of the apparatus used in all the experiments. Sigma-Aldrich (Fluka) supplied HNO3 (>69%) for trace analysis. The stock solutions used to prepare standards included 1 001 μg/mL of Se and 1 000 μg/mL of yttrium (89Y) from Specpure (Alfa Aesar, USA). The initial calibration verification (ICV) standard was prepared from a 100 mg/L Merck (Darmstadt, Germany) multi-element standard for ICP containing the analyte of interest (Se).
All solutions were stored in HDPE bottles. An acid bath (10% v/v HNO3) was prepared for thoroughly cleaning glassware and polyethylene vials. The glassware and vials were soaked for a minimum of 12 h, rinsed several times with deionised water, followed by the final rinse with Milli-Q water, and then placed in the oven for drying at 60°C. A NIST SRM 1640a Water Reference Material (USA) was used to optimise method parameters and validate results.
Apparatus and instrumentation
Ultra-pure water was obtained from a Milli-Q Direct 8 water purification system (Millipore SAS, Molsheim, France). All glassware, microwave vessels, and centrifuge vials used were dried in a Lasec Oven Series 2000 (South Africa). An Orion pH meter (model 520A, Boston, USA) was used for pH determination in the laboratory, and an S2K712 pocket ISFET pH meter (Shindengen, Japan) was used for measuring both pH and temperature in the field. An Orion conductivity meter (manufactured by Thermo Scientific in Singapore) was used to measure electrical conductivity. Samples were filtered using Pall acrodisc membrane syringe filters, 25 mm with GxF/0.45 μηι GHP (Sigma-Aldrich). A Perkin Elmer NexION 300X ICP-MS (Waltham, Massachusetts, USA) with an S10 autosampler, PolyScience 3370 chiller, and Perkin Elmer ELAN 6100 ICP-MS with AS-91 autosampler, cyclonic spray chamber, crossflow nebuliser, a kinetic energy discrimination (KED) collision cell and PolyScience recirculator/chiller (California, USA) was used for the quantitative determination of Se. The analysis of Se was conducted at KED mode and using He as an inert gas to minimise the polyatomic interferences.
Total dissolved Se analysis
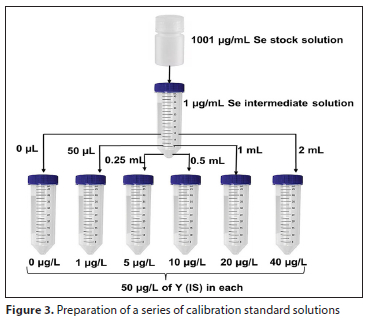
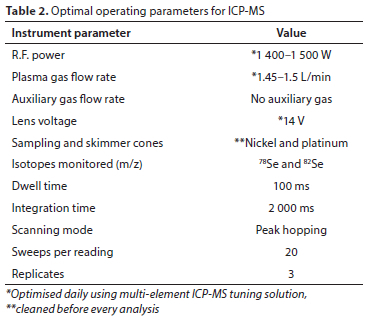
Selenium was quantified using the external calibration method. As shown in Fig. 3, calibration standards were prepared. 89Y was used as an internal standard. The ICV solution prepared was 20 μg/L, and the continuous calibration verification (CCV) was performed periodically (after every 10 samples) by analysing the midpoint concentration standard. Samples were prepared using either a 10-fold or 5-fold dilution factor. All dilutions of standards and samples were done using 1% HNO3 prepared from HNO3 (>69%) and ultra-pure water. The parameters for operating the ICP-MS were set as outlined in Table 2.
Method validation
Selenium exists in trace amounts; thus, the laboratory environment, instrumentation, and materials were thoroughly cleaned. HDPE apparatus were mainly used to eliminate the adsorption of Se to the walls of the glass material and metal contaminants from the glass material. Rinsing was done several times (at least 5 times) using ultra-pure water. Apparatus were kept in clean plastic bags when not in use. The reagents used were for trace and ultra-trace analysis. Calibration standards were freshly prepared before analysis. Membrane filters were used instead of ashless filter papers, which may contain trace elements at high concentrations. A NIST SRM 1640a Water Reference Material was used to validate the method. ICV and CCV were performed during the determination of total Se. The limits of detection (LOD) and quantification (LOQ) were determined by analysing 10 reagent blanks. LOD and LOQ were then calculated using the criterion based on 3 times the standard deviation of the reagent blanks and 10 times the standard deviation of the reagent blanks, respectively. Samples were prepared in triplicate to determine the precision of the results. In a few cases, samples were analysed in a different laboratory to support quality control/quality assurance (QC/QA).
RESULTS AND DISCUSSION
Physico-chemical properties
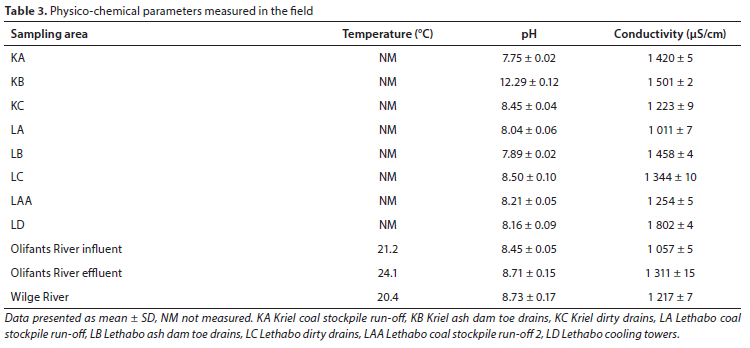
The pH values measured in the wastewater and river water samples are listed in Table 3. Generally, the wastewater pH values were 7.75-8.75, except for the Kriel ash dam toe-drain sample. The pH value for this sample was not within the South African guidelines of 5.5-9.5 for pH in effluents that can be discharged into a river (DWAF, 1995; Morrison et al., 2001). Hence, the wastewater pH has to be adjusted appropriately before discharging into the aquatic environment. The pH values in the river water samples were close to 8 and fell within the South African recommended pH range in water for domestic use (6-9) and recreation (6.5-8.5) (DWAF, 1995). Thus, based on these guidelines, the pH of the river water will not adversely affect its use for domestic or recreational purposes.
Water's electrical conductivity (EC) is a useful indicator of the water's total salt content. Salts can impact the capacity of an analytical method to qualitatively identify and quantify target elements (especially trace elements) in environmental and other samples (Zoorob et al., 1998; Bagwandin, 2016). Electrical conductivity values varied between 1 004 μS/cm and 1 806 μS/cm in wastewater from coal-fired power plants. The maximum permissible value set in the South African water quality guideline for EC in the effluent released into rivers is 1 500 μS/cm (DWAF, 1999 ). The Lethabo cooling towers sample exceeded this limit, and this can be expected because high evaporation takes place in the cooling towers leaving residual water with concentrated salts.
Nonetheless, the EC in wastewater from the coal-fired power plants does not appear to be a cause for concern because all the other measured values were within the acceptable limit (see Table 3).
Interestingly, secondary removal of the salts contributing to the electrical conductivity of the wastewater can be achieved if the wastewater passes through wetlands. This process would remove some dissolved salts that may have 'survived' the primary treatment process. The result would be much lower EC readings.
The EC in rivers in this study ranged between 1 052 μS/cm and 1 326 μS/cm. The South African acceptable limit for conductivity in the domestic water supply is 700 μS/cm (DWAF, 1996c). This limit was exceeded in the river water, which is a cause of concern because the large number of inhabitants of informal settlements along the Olifants and Wilge Rivers use the river water untreated. Although the reported EC readings are unlikely to cause imminent health effects, the water will have a noticeable salty taste. Another important observation is that the EC at Olifants River Site A (before the Duvha Power Station) was less than at Olifants River Site B (after the Duvha Power Station), an increase from 1 052 μS/cm to 1 326 μS/cm, which potentially indicates a contribution from the power plant effluent. All samples received and collected generally had values <2 000 μS/cm. Water samples with values >2 000 μS/cm may affect Se analysis if not adequately diluted because of a more complex matrix (Fernandez-Turiel et al., 2000), and this was not the case in our investigation. However, the river water's EC may ultimately have a significantly large negative impact if consumed without treatment, particularly in areas with poor sanitation where the community uses unpurified water obtained directly from the river (for example, Masakhane village near Olifants River).
Total Se in wastewater and river waters
Over the past several decades, Se levels in wastewater and natural waters continue to be a subject of intense interest. The scientific community also recognises that speciation analysis of Se provides a more relevant indicator of the element's potential adverse effects on the environment, because Se toxicity, reactivity, mobility, and bioavailability depend on its chemical nature. Nevertheless, determining the total Se concentration in environmental and wastewater samples is still vital. This is because most regulatory frameworks used in different regions of the world have set the upper limits for monitoring Se in terms of total concentrations (Brandt et al., 2017; Kumkrong et al., 2018). Knowledge of total Se concentration is also important because it is the foundation of speciation studies. It helps in determining accurate mass balance evaluations and provides the basis for calculating the recovery and the ratio of the identified Se species compared to total Se (Nemeth and Dernovics, 2015; Kumkrong et al., 2018; Chen et al., 2021). This section presents the results and detailed discussions of the method developed to quantify the total dissolved Se and the application of the developed method to real samples.
ICP-MS calibration using external standard calibration technique
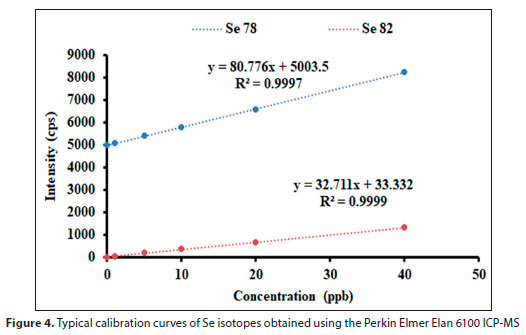
In this investigation, external calibration was employed. The external calibration technique is mainly recommended if the sample matrix is not complex and the differences between the matrices of the standards and the sample have no effect on the calibration function (Cuadros-Rodríguez et al., 2001; Koscielniak et al., 2011). External calibration was applicable to our study since wastewater samples were received after treatment resulting in samples with a simpler matrix. Furthermore, an internal standard described in the preceding section was used to suppress or enhance the signal arising from matrix components and the stability of instrument signal throughout the analysis. Typical regression lines (including correlation coefficient of determination and line equation) obtained during the sample analysis are indicated in Fig. 4. The correlation coefficients (R2) of calibration curves based on 5 standards for the selected Se isotopes were in the range of 0.9993-0.9999, showing good linearity.
Internal standardisation
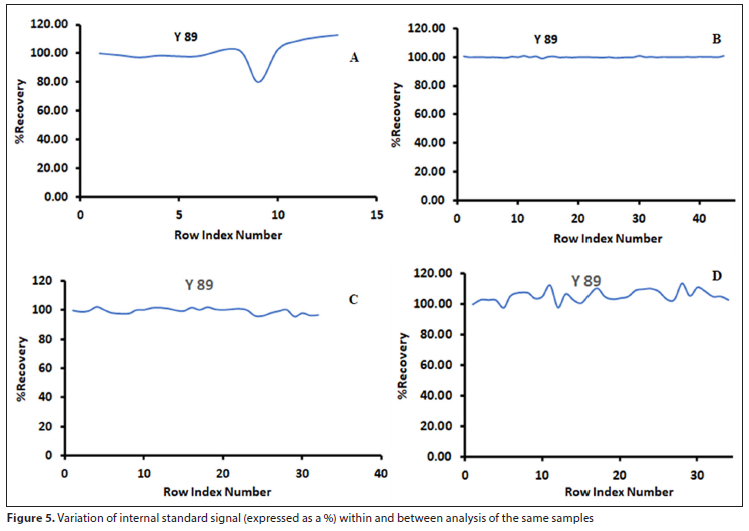
In ICP-MS measurements, the analytical data can be affected by suppression or enhancement of signal arising from matrix components and instrument stability throughout the sample analysis. The magnitude of the signal suppression or enhancement is known to occur regularly on the mass number, and the use of an internal standard with a mass number close to that of the analyte under investigation is recommended for correcting the effect of non-spectral interferences (Vanhaecke et al., 1992). Using an internal standard and incorporating the abovementioned criterion, improves precision and accuracy of the analytical method. The internal standard is added to each sample and standard solution before the analysis, during sample preparation (offline addition) or during analysis (online addition). The choice of the internal standard to be used depends on the task in question. An element that is selected must, ideally, be in the same average mass range as the element(s) being analysed. This selected element must not be present in the samples or should occur in the samples only in negligible concentrations (Vanhaecke et al., 1992). 89Y was selected as the internal reference standard (IRS) to correct for matrix effects, checking instrument stability, and correcting for variation of instrument response with analysis time. The selection was based on the intermediate-mass range that Se isotopes fall within. Other factors that were considered were the first ionisation potential of the IRS and analyte, interferences on the IRS, and the presence/absence of 89Y in the samples. 72Ge has been routinely used as an internal standard for Se analysis (Wieczorek et al., 2017; Hirtz and Günther, 2020), but the presence of Fe in the samples potentially causes interference from 56Fe16O+ [48]; hence 89Y was selected. Ideally, an internal standard should produce a stable signal throughout the analysis, but in practical situations, minor fluctuations are expected, and this was best achieved once in Fig. 5b. In other cases, the signal remained reasonably stable in standard, blank, and sample solutions (Fig. 5 a, c, and d), with a few signal fluctuations observed. The fluctuations indicated some degree of signal enhancement or suppression. Nevertheless, all the obtained recoveries were within the acceptable range, that is, between 80 and 120% (Rambla-Alegre et al., 2012). These results indicate the suitability of 89Y for use as an internal standard to correct for matrix effects in the waste and natural water sample solutions.
Method validation and selection of isotopes
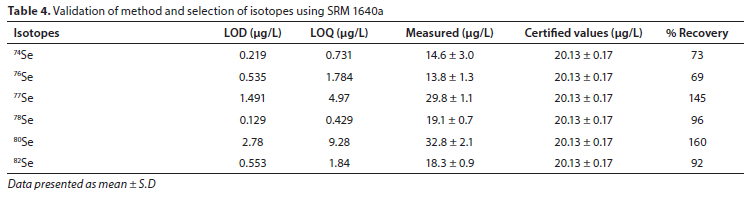
This research developed an ICP-MS method to determine total Se concentration in wastewater samples from coal-fired power plants and river water samples. The method was developed using certified reference material, NIST SRM 1640a Trace Elements in Natural Water. Analyses were done in triplicate to assess the precision and reproducibility of the results in terms of relative standard deviation. The LOD and LOQ used for the determination of Se are provided in Table 4, and typical correlation coefficient values of calibration curves, showing good linearity, are indicated in Fig. 4.
Ideally, the most abundant 80Se should be the isotope of choice for Se analysis; however, it suffers interferences from the massive flow of the argon plasma gas. The Se isotopes that gave the best recoveries, 78Se, and 82Se as indicated by the results in Table 4, were selected in subsequent analysis. 82Se is less abundant but has been routinely used with another less abundant isotope (76Se), because these two isotopes both have less polyatomic interferences. However, 76Se had a poor recovery (69%), much less than the minimum acceptable 80%, and it was apparent that 78Se was the other isotope to be used. It can be argued that 78Se is subject to strong interference by 40Ar38Ar+ and 38Ar40Ca+, each at m/z = 78 (May et al., 1998), but 40Ar38Ar+ interference can also be corrected by blank subtraction because it is stable and independent of individual samples. 38Ar also has an abundance of 0.0629%, which is relatively low. This generally means that the sensitivity of 38Ar polyatomic interference will be very low given the above relative abundance. For these reasons, 78Se has also been routinely used to analyse water samples (Smith and Compton, 2004; Pettine et al., 2015; Kleckner et al., 2017). Thus, using 78Se and 82Se, the standard reference material (SRM) 1640a, percentage recoveries ranged from 92% to 96%, with RSDs below 4%, which were both within the acceptable ranges. The method detection limit was 0.13 μg/L, and the limit of quantity was 1.84 μg/L. These values are relatively low compared to the literature values (0.064-7 μg/L) reviewed by Kumkrong et al (2018), which indicated that our developed method could be used for routine analysis of Se in water samples.
Analysis of real samples
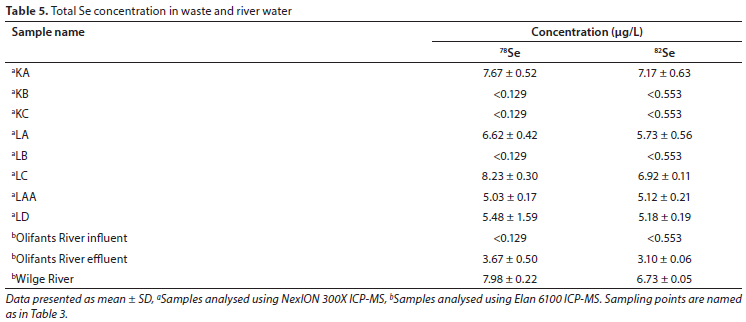
The developed method for the total determination of Se was applied to wastewater and natural water samples. All samples were analysed in triplicate (n = 3) to evaluate precision (%RSD), and the reported results are mean concentrations. After all corrections by the internal standard (89Y), the concentration value of Se in a given sample must be higher than LOQ for it to be acceptable. This criterion was not met for Kriel ash dam toe-drains, Kriel dirty drains, Lethabo dirty drains, and Olifants River influent samples. The two Se isotopes selected for this method also showed similar results. The results are presented in Table 5. The total Se concentrations were generally less than 10 μg/L.
The total Se concentrations in natural waters, according to global reports, were reported to range from 0.1-400 μg/L [53], and it can be seen that the measured concentrations in the selected rivers and dams fall in the lower boundary of this range. There is a slight increase from the Olifants River Site A (undetectable concentrations) to the Olifants River Site B (detectable concentrations). This slight rise can be attributed to the Duvha coal-fired power plant, which is close to the river. The rise is greater than 2 μg/L and exceeds the stipulated freshwater value for aquatic life limit of 2 μg/L (Kumkrong et al., 2018). This rise in Se concentrations is a cause of concern for aquatic life, and a practical solution is required from the power station.
The wastewater from coal-fired power plants in the USA, Canada, Europe, and China contains Se in concentrations ranging from 1-10 mg/L, particularly the flue-gas-desulfurisation (FGD) wastewater (Santos et al., 2015). The values obtained in this study were far less than this range. The South African coal-fired power plants utilise pulse jet fabric filters (FFs) or electrostatic precipitators (ESPs) and flue gas conditioning (FGCs) systems to trap the flue gas pollutants (mainly SOx). These systems are not efficient in trapping volatile trace elements such as Se and As (Dabrowski et al., 2008; Shah et al., 2008; Tian et al., 2021).
Thus, Se may escape into the atmosphere resulting in low Se concentration in the generated coal-fired power plant wastewater. The quantity of Se in the wastewaters from coal-fired power plants can vary depending on the type of coal used. Wagner and Tlotleng (2012) determined the average Se concentrations to be 0.99 ± 0.24 μg/g in South African coal, implying lower concentrations in wastewaters owing to losses during the cleaning of the coal and other processes (for example, leaching and percolation during storage). However, in this investigation another major reason for the low concentrations obtained is that the wastewater samples were received after treatment.
CONCLUSION
A method for determining Se in wastewater samples from coal-fired power plants and natural (river) waters located near the power stations was successfully developed using ICP-MS. The method requires the least sample preparation and has competitive LOD (0.13 μg/L) and LOQ (1.84 μg/L); thus, it can be routinely used for Se analysis in water samples. 78Se and 82Se give more accurate and precise results when analysing the water samples using ICP-MS in standard mode and 89Y is a suitable IRS that can be substituted for 72Ge in Se analysis. The Se concentrations obtained in real samples do not exceed the stipulated South African Se hazard index for drinking water, water for livestock, water for human consumption, and irrigation. However, the treated wastewater is unsuitable for discharge in river/surface water because Se concentration exceeds the limit for freshwater for aquatic life. The slight increase of Se concentration from the Olifants River Site A to the Olifants River Site B can be attributed to the Duvha coal-fired power plant in proximity to the river. This increase poses a threat to aquatic life in the Olifants River but is of minor concern for humans, livestock, and irrigation. There may be a cause of concern for Se deficiency because Se is essential at low concentrations, i.e. ~ 50 μg/L per day. South African coal-fired power plants need to improve and incorporate wastewater treatment technologies that efficiently remove Se to comply with all regulatory frameworks gazetted for Se.
ACKNOWLEDGEMENTS
We thank former UJ Spectrum Instrument Scientist, Dr Eve Kroukamp and the University of Johannesburg for the facility.
ORCID
Philiswa N Nomngongo: https://orcid.org/0000-0001-7615-0548
REFERENCES
AGORO MA, OKOH OO, ADEFISOYE MA and OKOH AI (2018) Physicochemical properties of wastewater in three typical South African sewage works. Pol. J. Environ. Stud. 27 (2) 491-499. https://doi.org/10.15244/pjoes/74156 [ Links ]
ASHOURNIA M and ALIAKBAR A (2009) Determination of selenium in natural waters by adsorptive differential pulse cathodic stripping voltammetry. J. Hazardous Mater. 168 (1) 542-547. https://doi.org/10.1016/j.jhazmat.2009.02.070 [ Links ]
ATSDR (Agency for Toxic Substances and Disease Registry) (2003) Toxicological profile of selenium. URL: https://www.atsdr.cdc.gov/toxprofiles/tp92.pdf (Accessed 15 September 2015). [ Links ]
BAGWANDIN R (2016) An evaluation of chromatographic modes for the determination of rare earth elements in geological materials by HPLC-ICP-MS. MSc dissertation, University of Kwa-Zulu Natal, Durban. [ Links ]
BRANDT JE, BERNHARDT ES, DWYER GS and DI GIULIO RT (2017) Selenium ecotoxicology in freshwater lakes receiving coal combustion residual effluents: a North Carolina example. Environ. Sci. Technol. 51 (4) 2418-2426. https://doi.org/10.1021/acs.est.7b03074 [ Links ]
CHEN S, LIU L and TANG D (2021) Determination of total and inorganic selenium in selenium-enriched rice, tea, and garlic by high-performance liquid chromatography-inductively coupled plasma mass spectrometry (HPLC-ICP-MS). Anal. Lett. 54 (11) 1809-1825. https://doi.org/10.1080/00032719.2020.1825466 [ Links ]
CONDE JE and SANZ ALAEJOS M (1997) Selenium concentrations in natural and environmental waters. Chem. Rev. 97 (6) 1979-2004. https://doi.org/10.1021/cr960100g [ Links ]
CUADROS-RODRlGUEZ L, GÁMIZ- GRACIA L, ALMANSA-LÓPEZ EM and BOSQUE-SENDRA JM (2001) Calibration in chemical measurement processes. II. A methodological approach. Trends Anal. Chem. 20 (11) 620-636. https://doi.org/10.1016/S0165-9936(01)00111-X [ Links ]
DABROWSKI JM, ASHTON PJ, MURRAY K, LEANER JJ and MASON RP (2008) Anthropogenic mercury emissions in South Africa: Coal combustion in power plants. Atmos. Environ. 42 (27) 6620-6626. https://doi.org/10.1016/j.atmosenv.2008.04.032 [ Links ]
DMR (Department of Mineral Resources, South Africa) (2017) Basic Assessment Report and Environmental Management Programme. URL: https://sahris.sahra.org.za/sites/default/files/additionaldocs/DBAR_0.pdf (Accessed 20 April 2023). [ Links ]
DWAF (Department of Water Affairs and Forestry, South Africa) (1995) Procedures to assess effluent discharge impacts (first edition). WRC Report No TT 64/94. [ Links ]
DWAF (Department of Water Affairs and Forestry, South Africa) (1996a) South African Water Quality Guidelines (second edition). Volume 8: Field Guide. URL: http://www.dwa.gov.za/iwqs/wq_guide/Pol_saWQguideFRESHFieldguidevol8.pdf (Accessed 6 April 2023). [ Links ]
DWAF (Department of Water Affairs and Forestry, South Africa) (1996b) South African Water Quality Guidelines (second edition). Volume 7: Aquatic Ecosystems. URL: https://www.dws.gov.za/iwqs/wq_guide/edited/Pol_saWQguideFRESH_vol7_Aquaticecosystems.pdf (Accessed 6 April 2023). [ Links ]
DWAF (Department of Water Affairs and Forestry, South Africa) (1996c) South African Water Quality Guidelines (second edition). Volume 1: Domestic Use. URL: https://www.dws.gov.za/Groundwater/documents/Pol_saWQguideFRESHDomesticusevol1.pdf (Accessed 6 April 2023). [ Links ]
DWAF (Department of Water Affairs and Forestry, South Africa) (1999) Government Gazette No. 20526 8 October 1999. URL: https://faolex.fao.org/docs/pdf/saf47843.pdf (Accessed 20 June 2018). [ Links ]
DEVI P, JAIN R, THAKUR A, KUMAR M, LABHSETWAR NK, NAYAK M and KUMAR P (2017) A systematic review and meta-analysis of voltammetric and optical techniques for inorganic selenium determination in water. Trends Anal. Chem. 95 69-85. https://doi.org/10.1016/j.trac.2017.07.012 [ Links ]
DIKIO ED (2010) Water quality evaluation of Vaal River, Sharpeville and Bedworth lakes in the Vaal region of south Africa. Res. J. Appl. Sci. Eng. Technol. 2 (6) 574-579. [ Links ]
DING W, WANG S, GU J and YU L (2022) Selenium and human nervous system. Chin. Chem. Lett. 108043. https://doi.org/10.1016/j.cclet.2022.108043 [ Links ]
DOYLE D (2015) Sustainable Energy Briefing 27: Eye on Eskom's commitment to air quality at Medupi. URL: https://earthlife.org.za/wp-content/uploads/2020/06/SE-Briefing-27-Commitment-by-Eskom.pdf (Accessed 5 June 2016). [ Links ]
EDOKPAYI JN, ODIYO JO and DUROWOJU OS (2017) Impact of wastewater on surface water quality in developing countries: a case study of South Africa. In: Tutu H (ed.) Water Quality. IntechOpen. https://doi.org/10.5772/66561 [ Links ]
ETTEIEB S, MAGDOULI S, ZOLFAGHARI M and BRAR S (2020a) Monitoring and analysis of selenium as an emerging contaminant in mining industry: A critical review. Sci. Total Environ. 698 134339. https://doi.org/10.1016/j.scitotenv.2019.134339 [ Links ]
ETTEIEB S, MAGDOULI S, ZOLFAGHARI M and BRAR SK (2020b) Monitoring and analysis of selenium as an emerging contaminant in mining industry: A critical review. Sci. Total Environ. 698 134339. https://doi.org/10.1016/j.scitotenv.2019.134339 [ Links ]
FERNANDEZ-TURIEL JL, LLORENS JF, LÓPEZ-VERA F, GÓMEZ-ARTOLA C, MORELL I and GIMENO D (2000) Strategy for water analysis using ICP-MS. Fresenius' J. Anal. Chem. 368 (6) 601-606. https://doi.org/10.1007/s002160000552 [ Links ]
GORCHEV HG and OZOLINS G (2011) WHO guidelines for drinking-water quality. WHO Chronicle 38 (3) 104-108. https://doi.org/10.1016/S1462-0758(00)00006-6 [ Links ]
GU Y-G, LIN Q, YU Z-L, WANG X-N, KE C-L and NING J-J (2015) Speciation and risk of heavy metals in sediments and human health implications of heavy metals in edible nekton in Beibu Gulf, China: A case study of Qinzhou Bay. Mar. Pollut. Bull. 101 (2) 852-859. https://doi.org/10.1016/j.marpolbul.2015.11.019 [ Links ]
HENDRYX M, ZULLIG KJ and LUO J (2020) Impacts of coal use on health. Annu. Rev. Public Health 41 397-415. https://doi.org/10.1146/annurev-publhealth-040119-094104 [ Links ]
HIRTZ A and GÜNTHER K (2020) Determination of total selenium and extractability of selenium in commercially available dietary supplements by inductively coupled plasma-mass spectrometry (ICP-MS). Anal. Lett. 53 (16) 2529-2544. https://doi.org/10.1080/00032719.2020.1746328 [ Links ]
HOSSAIN A, SKALICKY M, BRESTIC M, MAITRA S, SARKAR S, AHMAD Z, VEMURI H, GARAI S, MONDAL M, BHATT R and co-authors (2021) Selenium biofortification: Roles, mechanisms, responses and prospects. Molecules 26 (4). https://doi.org/10.3390/molecules26040881 [ Links ]
HUIZENGA JM, SILBERBAUER M, DENNIS R and DENNIS I (2013) An inorganic water chemistry dataset (1972-2011) of rivers, dams and lakes in South Africa. Water SA 39 (2) 335-340. https://doi.org/10.4314/wsa.v39i2.18 [ Links ]
JOHNSON CC, FORDYCE FM and RAYMAN MP (2009) Symposium on 'Geographical and geological influences on nutrition'. Factors controlling the distribution of selenium in the environment and their impact on health and nutrition. Conference on 'Over- and undernutrition: Challenges and approaches'. Proceedings of the Nutrition Society 69 (1) 119-132. https://doi.org/10.1017/S0029665109991807 [ Links ]
KLECKNER AE, KAKOUROS E and ROBIN STEWART A (2017) A practical method for the determination of total selenium in environmental samples using isotope dilution-hydride generation-inductively coupled plasma-mass spectrometry. Limnol. Oceanogr. Meth. 15 (4) 363-371. https://doi.org/10.1002/lom3.10164 [ Links ]
KOSCIELNIAK P, WIECZOREK M, KOZAK J and HERMAN M (2011) Generalized calibration strategy in analytical chemistry. Anal. Lett. 44 (1-3) 411-430. https://doi.org/10.1080/00032719.2010.500782 [ Links ]
KUMKRONG P, LEBLANC KL, MERCIER PHJ and MESTER Z (2018) Selenium analysis in waters. Part 1: Regulations and standard methods. Sci. Total Environ. 640-641 1611-1634. https://doi.org/10.1016/j.scitotenv.2018.05.392 [ Links ]
LEMLY AD (2004) Aquatic selenium pollution is a global environmental safety issue. Ecotoxicology and Environ. Saf. 59 (1) 44-56. https://doi.org/10.1016/S0147-6513(03)00095-2 [ Links ]
LENZ M and LENS PNL (2009) The essential toxin: The changing perception of selenium in environmental sciences. Sci. Total Environ. 407 (12) 3620-3633. https://doi.org/10.1016/j.scitotenv.2008.07.056 [ Links ]
LI Q, ZHENG H, ZHU Z and TANG Z (2014) Electrodeposition as a preconcentration and sample preparation technique for trace selenium and tellurium determination by x-ray fluorescence spectrometry. Anal. Lett. 47 (5) 843-854. https://doi.org/10.1080/00032719.2013.853180 [ Links ]
LUO J, XU F, T.U. J, WU X and HOU X (2017) Amine-functionalised titanium metal organic framework for photochemical vapor generation for determination of selenium by inductively coupled plasma optical emission spectrometry. Microchem. J. 132 245-250. https://doi.org/10.1016/j.microc.2017.02.005 [ Links ]
MAY TW and WIEDMEYER RH (1998) A table of polyatomic interferences in ICP-MS. Atomic Spectrosc. 19 (5) 150-155. [ Links ]
MORRISON G, FATOKI OS, PERSSON L and EKBERG A (2001) Assessment of the impact of point source pollution from the Keiskammahoek Sewage Treatment Plant on the Keiskamma River-pH, electrical conductivity, oxygen-demanding substance (COD) and nutrients. Water SA 27 (4) 475-480. https://doi.org/10.4314/wsa.v27i4.4960 [ Links ]
NEMETH A and DERNOVICS M (2015) Application of hyphenated analytical techniques in the investigation of selenium speciation of different plants. PhD School/Program, Corvinus University of Budapest. https://doi.org/10.14267/phd.2015054 [ Links ]
NDM (Nkangala District Municipality) Air Quality Management Plan (2015) Draft V2. URL: https://cer.org.za/wp-content/uploads/2016/08/NKAN-AQMP_DraftV2-2015-05-06-AE-Public-LowRes-Draft-Version-2.pdf (Accessed 21 April 2023). [ Links ]
NYAMUKAMBA P, MOLOTO MJ, TAVENGWA N and EJIDIKE IP (2019) Evaluating physicochemical parameters, heavy metals, and antibiotics in the influents and final effluents of South African wastewater treatment plants. Pol. J. Environ. Stud. 28 (3) 1305-1312. https://doi.org/10.15244/pjoes/85122 [ Links ]
OKONJI SO, ACHARI G and PERNITSKY D (2021) Environmental impacts of selenium contamination: a review on current-issues and remediation strategies in an aqueous system. Water 13 (11) 1473. https://doi.org/10.3390/w13111473 [ Links ]
PARK Y, YU J and LEE T (2016) Microbial selenite reduction with organic carbon and electrode as sole electron donor by a bacterium isolated from domestic wastewater. Bioresour. Technol. 212 182-189. https://doi.org/10.1016/j.biortech.2016.04.033 [ Links ]
PETROV PK, CHARTERS JW and WALLSCHLÄGER D (2012) Identification and determination of selenosulfate and selenocyanate in flue gas desulfurisation waters. Environ. Sci. Technol. 46 (3) 1716-1723. https://doi.org/10.1021/es202529w [ Links ]
PETTINE M, MCDONALD TJ, SOHN M, ANQUANDAH GAK, ZBORIL R and SHARMA VK (2015) A critical review of selenium analysis in natural water samples. Trends Environ. Anal. Chem. 5 1-7. https://doi.org/10.1016/j.teac.2015.01.001 [ Links ]
RAMBLA-ALEGRE M, ESTEVE-ROMERO J and CARDA-BROCH S (2012) Is it really necessary to validate an analytical method or not? That is the question. J. Chromatogr. A 1232 101-109. https://doi.org/10.1016/j.chroma.2011.10.050 [ Links ]
RIBEIRO J, DA SILVA EF and FLORES D (2010) Burning of coal waste piles from Douro Coalfield (Portugal): Petrological, geochemical and mineralogical characterisation. Int. J. Coal Geol. 81 (4) 359-372. https://doi.org/10.1016/j.coal.2009.10.005 [ Links ]
SANTOS S, UNGUREANU G, BOAVENTURA R and BOTELHO C (2015) Selenium contaminated waters: an overview of analytical methods, treatment options and recent advances in sorption methods. Sci. Total Environ. 521 246-260. https://doi.org/10.1016/j.scitotenv.2015.03.107 [ Links ]
SARA JR, SMIT WJ, ERASMUS LJC, RAMALEPE TP, MOGASHOA ME, RAPHAHLELO ME, THERON J and LUUS-POWELL WJ (2014) Ecological status of Hout River Dam, Limpopo province, South Africa, using fish condition and health assessment index protocols: a preliminary investigation. Afr. J. Aquat. Sci. 39 (1) 35-43. https://doi.org/10.2989/16085914.2013.848181 [ Links ]
SHAH P, STREZOV V, PRINCE K and NELSON PF (2008) Speciation of As, Cr, Se and Hg under coal fired power station conditions. Fuel 87 (10-11) 1859-1869. https://doi.org/10.1016/j.fuel.2007.12.001 [ Links ]
SHISHOV A, WIECZOREK M, KOSCIELNIAK P, DUDEK-ADAMSKA D, TELK A, MOSKVIN L and BULATOV A (2018) An automated continuous homogeneous microextraction for the determination of selenium and arsenic by hydride generation atomic fluorescence spectrometry. Talanta 181 359-365. https://doi.org/10.1016/j.talanta.2018.01.033 [ Links ]
SIMONS R (1993) Trace element removal from ash dam waters by nanofiltration and diffusion dialysis. Desalination 89 (3) 325-341. https://doi.org/10.1016/0011-9164(93)80145-D [ Links ]
SMITH M and COMPTON JS (2004) Matrix effects in the ICP-MS analysis of selenium in saline water samples. In: Proceedings of the 2004 Water Institute of Southern Africa Biennial Conference, 25-28 May 2014, Mbombela. [ Links ]
STEFANIAK J, DUTTA A, VERBINNEN B, SHAKYA M and RENE ER (2018) Selenium removal from mining and process wastewater: a systematic review of available technologies. J. Water Supply: Res. Technol. 67 (8) 903-918. https://doi.org/10.2166/aqua.2018.109 [ Links ]
TAN LC, NANCHARAIAH YV, VAN HULLEBUSCH ED and LENS PNL (2016) Selenium: environmental significance, pollution, and biological treatment technologies. Biotechnol. Adv. 34 (5) 886-907. https://doi.org/10.1016/j.biotechadv.2016.05.005 [ Links ]
TIAN C, GONG B, WANG X, ZHAO Y and ZHANG J (2021) Ash formation and trace elements associations with fine particles in an ultra-low emission coal-fired power plant. Fuel 288 119718. https://doi.org/10.1016/j.fuel.2020.119718 [ Links ]
TYBURSKA A, JANKOWSKI K and RODZIK A (2011) Determination of arsenic and selenium by hydride generation and headspace solid phase microextraction coupled with optical emission spectrometry. Spectrochim. Acta B. https://doi.org/10.1016/j.sab.2011.03.010 [ Links ]
VANHAECKE F, VANHOE H, DAMS R and VANDECASTEELE C (1992) The use of internal standards in ICP-MS. Talanta 39 (7) 737-742. https://doi.org/10.1016/0039-9140(92)80088-U [ Links ]
VIG N, RAVINDRA K and MOR S (2022) Heavy metal pollution assessment of groundwater and associated health risks around coal thermal power plant, Punjab, India. Int. J. Environ. Sci. Technol. https://doi.org/10.1007/s13762-022-04284-8 [ Links ]
VINCETI M, MANDRIOLI J, BORELLA P, MICHALKE B, TSATSAKIS A and FINKELSTEIN Y (2014) Selenium neuro-toxicity in humans: Bridging laboratory and epidemiologic studies. Toxicol. Lett. 230 (2) 295-303. https://doi.org/10.1016/j.toxlet.2013.11.016 [ Links ]
WAGNER NJ and TLOTLENG MT (2012) Distribution of selected trace elements in density fractionated Waterberg coals from South Africa. Int. J. Coal Geol. 94 225-237. https://doi.org/10.1016/j.coal.2012.01.005 [ Links ]
WEATHER SPARK (2023) Climate and average weather year-round in Vereeniging. URL: https://weatherspark.com/y/94195/Average-Weather-in-Vereeniging-South-Africa-Year-Round#Sections-Humidity (Accessed 20 April 2023). [ Links ]
WEEKLEY CM and HARRIS HH (2013) Which form is that? The importance of selenium speciation and metabolism in the prevention and treatment of disease. Chem. Soc. Rev. 42 (23) 8870-94. https://doi.org/10.1039/c3cs60272a [ Links ]
WIECZOREK M, TOBIASZ A, DUDEK-ADAMSKA D, WALAS S and KOSCIELNIAK P (2017) Analytical strategy for the determination of selenium in biological materials by inductively coupled plasma-mass spectrometry with a dynamic reaction cell. Anal. Lett. 50 (14) 2279-2291. https://doi.org/10.1080/00032719.2016.1273361 [ Links ]
XU Y, H.U. J, YING Q, HAO H, WANG D and ZHANG H (2017) Current and future emissions of primary pollutants from coal-fired power plants in Shaanxi, China. Sci. Total Environ. 595 505-514. https://doi.org/10.1016/j.scitotenv.2017.03.267 [ Links ]
ZACHARIA A, GUCER $, ARABADJI M and CHEBOTAREV A (2018) Direct atomic absorption spectrometric determination of selenium in biological fluids by a graphite filter furnace atomiser with carbon thread. Anal. Lett. 51 (15) 2390-2400. https://doi.org/10.1080/00032719.2018.1424887 [ Links ]
ZAMXAKA M, PIRONCHEVA G and MUYIMA N (2004) Microbiological and physico-chemical assessment of the quality of domestic water sources in selected rural communities of the Eastern Cape Province, South Africa. Water SA 30 (3) 333-340. https://doi.org/10.4314/wsa.v30i3.5081 [ Links ]
ZOOROB GK, MCKIERNAN JW and CARUSO JA (1998) ICP-MS for elemental speciation studies. Microchim. Acta 128 (3) 145-168. https://doi.org/10.1007/BF01243044 [ Links ]
ZVEREVA VP and KRUPSKAYA LT (2013) Environmental assessment of coal ash ponds of thermal power plants in the south of the Russian Far East. Russ. J. Gen. Chem. 83 (13) 2668-2675. https://doi.org/10.1134/S1070363213130124 [ Links ]
 Correspondence:
Orpah Zinyemba
Email:ozinyemba@uj.ac.za
Received: 31 January 2023
Accepted: 6 July 2023

