


Serviços Personalizados
Artigo
 Inglês (pdf)
 Artigo em XML
 Referências do artigo
Indicadores

Links relacionados
-
 Citado por Google
 -
 Similares em Google
Compartilhar

 Permalink
Water SA
versão On-line ISSN 1816-7950
versão impressa ISSN 0378-4738
Water SA vol.49 no.3 Pretoria Jul. 2023
http://dx.doi.org/10.17159/wsa/2023.v49.i3.4038
RESEARCH PAPER
The water quality status of estuarine micro-system types along the coast of KwaZulu-Natal Province, South Africa
GC BateI; DA LemleyI, II; M NunesI, II; JB AdamsI, II
IBotany Department and the Institute for Coastal and Marine Research, Nelson Mandela University, Gqeberha, South Africa
IIDSI/NRF Research Chair in Shallow Water Ecosystems, Nelson Mandela University, PO Box 77000, Gqeberha 6031, South Africa
ABSTRACT
A survey of the quality of water flowing from micro-system types to the ocean, along the subtropical east coast of South Africa, showed a wide variation in the concentrations of total nitrogen, phosphorus and phytoplankton biomass in the different systems located, in many cases, only a short distance from each other along the coastline. The origins of the high phytoplankton growth indicate pollutants caused by the land-use in this highly populated coastal region. The main agricultural activities in the area are sugarcane, permanent orchards, and forestry. The levels of N and P in the water varied from 'good' to 'poor', i.e., TN 0.15-3.99 mg-L-1, TP 0.02-0.33 mg-L-1 and chlorophyll-a from 0 to almost 45 Mg-L-1. Rapid coastal population densification appears to have been the cause of the pollution levels measured for total nitrogen, phosphorus, and phytoplankton biomass. Most of the micro-systems with a total modified peri-catchment above 80% were enriched by both TN and TP. While the hypothesis tested was that the main cause was residential development (e.g., septic tank effluent), it was not possible to show any statistical significance to support such a specific conclusion. Although these systems are small individually, the great number along the coastline warrants recognition as important sources of freshwater inflow and nutrients to the marine environment.
Keywords: coastal pollution, population, agriculture, wastewater, phytoplankton
INTRODUCTION
Nine estuary types and three micro-system types are nationally recognised in South Africa. Of these ecosystem types, micro-systems include micro-estuaries and micro-outlets (Bate et al., 2017), as well as coastal waterfalls, which have only recently been included in the formal classification scheme for estuaries (Van Niekerk et al., 2019a). These small systems (< 2 ha in area or < 200 m in length) are characterised by small permanent or ephemeral coastal waterbodies with limited estuarine functionality (Bate et al., 2017; Magoro et al., 2020a; Van Niekerk et al., 2020). While most of these systems fall within the subtropical bioregion, previous ecological assessments have largely been focused within the southern warm-temperate bioregion. In that region the diversity and abundance of biotic assemblages (i.e., phytoplankton, microphytobenthos, zooplankton, macrozoobenthos, and fish) were found to differ between micro-estuaries and micro-outlets (Dalu et al., 2018, 2020; Magoro et al., 2019, 2020a, 2020b).
Of the 127 South African subtropical micro-systems identified, 63 are situated along the KwaZulu-Natal (KZN) coastline (Van Niekerk et al., 2020). Of these, 13% are micro-estuaries and 87% are the smaller micro-outlets. The preponderance of micro-systems in KZN, in comparison to the rest of South Africa, is likely caused by the steep coastal topography, the high mean annual precipitation (600-1 200 mm), and the permeable sandy soils associated with coastal dunes (King, 1997; Van Niekerk et al., 2019a). The economic development in coastal cities has increased the demand for urban housing (Adams et al., 2020). Rapid land-use change and expansion in urban coastal areas causes both non-point and point-source pollution (Nie et al., 2018). Thus, differentiating between whether these KZN micro-systems are just an effect arising from catchment characteristics or the result of increased anthropogenic run-off requires investigation.
A qualitative assessment by Bate et al. (2017) was the first study to describe the KZN subtropical micro-systems that emphasised the need for fine-scale spatial delineation of catchment land-use practices and water quality assessments. It was suggested that while these systems are small individually, the great number along the coastline warrants recognition as important sources of freshwater inflow and nutrients to the marine environment. Changes in freshwater inflow, land-use alterations, and the influx of dissolved and particulate loads into estuaries and coastal waters are key anthropogenic stressors (Mitchell et al., 2015).
Sensitive and broadly applicable indicators are routinely used to detect ecological change (Paerl et al., 2010). Since microalgae form a critical base component of estuarine food webs, these communities are usually among the first to respond to anthropogenic impacts and, thus, these primary producers are generally used as indicators of ecosystem health (Lemley et al., 2016). Therefore, the aims of this study were to (i) assess the water quality and phytoplankton characteristics of the micro-systems along the KZN coast, and (ii) identify any potential source of pollution through the analysis of land-use change within the micro-system peri-catchments. The initial hypothesis was that micro-systems impacted by residential development close to the ocean (i.e., seepage from septic tanks) would be more affected by a higher availability of total nitrogen and phosphorus compared to those impacted by agriculture or natural habitat.
MATERIALS AND METHODS
Study site description
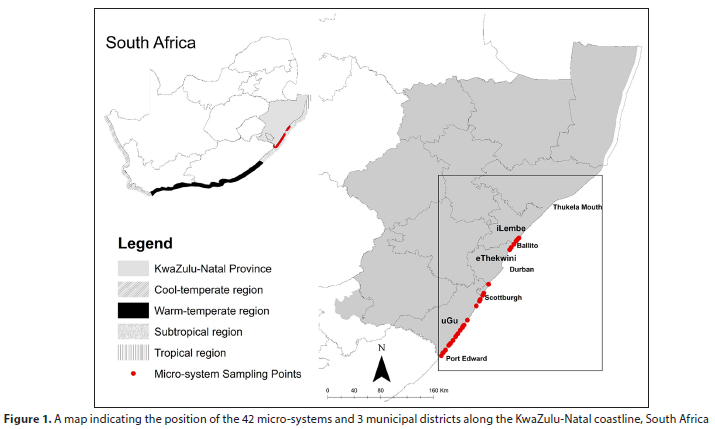
The KZN Province is situated on the north-east coast of South Africa (Fig. 1). The 570 km of coastline extends across the subtropical and tropical biogeographical regions, encompassing a variety of independent outlet drainage systems (Begg, 1978, 1984). These include six of the nine primary estuary ecosystem types and the recently described micro-system types (Bate et al., 2017; Van Niekerk et al., 2020). Habitat degradation driven by urbanisation has contributed to the poor condition of many of the small, sensitive estuaries in this province. These systems are impacted by poor water quality and changes in mouth state associated with existing wastewater discharges, polluted catchment run-off (i.e., agricultural return-flow and diffuse urban runoff), and flow modification (Van Niekerk et al., 2019b; Adams et al., 2020).
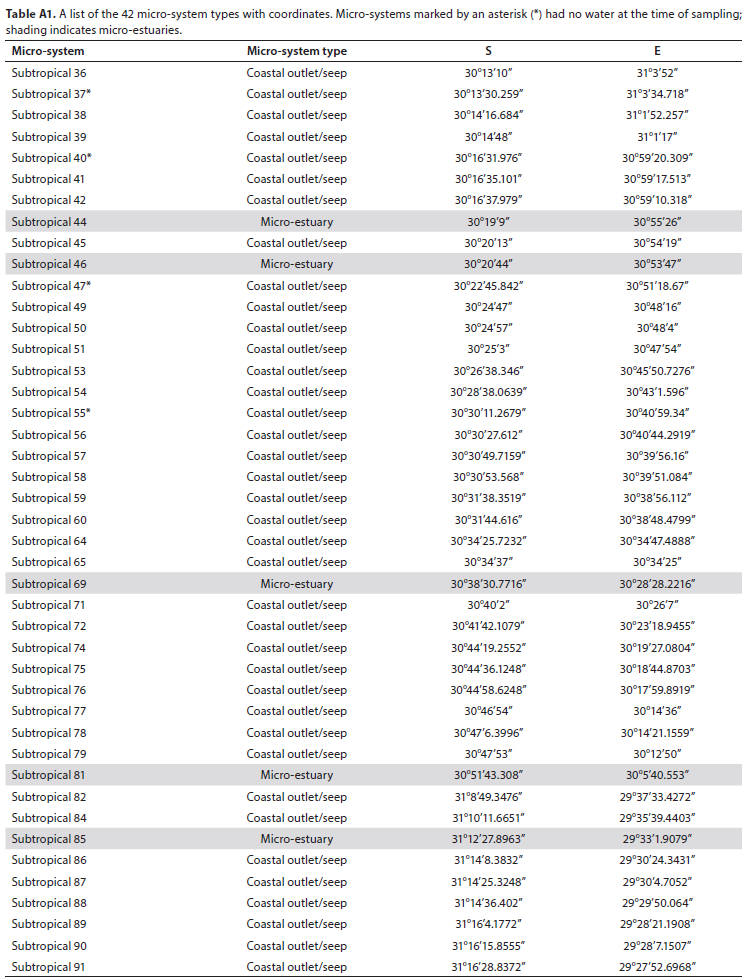
Single point sample collections were conducted in August 2021 at 42 pre-selected micro-systems across one metropolitan (eThekwini) and two district (Ugu and iLembe) municipalities (Fig. 1). The KZN coastline is divided into north and south coasts, with the north coast stretching from Ballito to Thukela Mouth and the south coast stretching from Port Edward to Scottburgh. The micro-system type selection criteria were based on the spatial representations of the entire KZN coastline and the presence of a freshwater outlet/seep. Other considerations in the data-collection strategy included ease of access and safety. Table A1 with the coordinates of each study system is provided in the Appendix.
Water quality variables
The physico-chemical variables, including temperature (°C), salinity, dissolved oxygen (mg-L-1) and pH, were measured using a Hanna HI98194 multiprobe at the mid-point of the water column. Because of the long distances between sampling points, there was only time during the field visits for a single point to be measured within each micro-system. Depth measurements (m) were done using a measuring stick. A single water sample for total nitrogen (TN) and total phosphorus (TP) were collected in each microsystem at the mid-point of the water column using a 500 mL weighted pop-bottle. The collected water samples were stored in 250 mL acid-washed polyethylene screw-cap bottles and frozen to -20°C until analysis. The persulphate digestion method was used for the simultaneous detection of TN and TP (Koroleff, 1983).
Phytoplankton biomass and community composition
Using chlorophyll-α (Chl-a) concentration as a proxy for phytoplankton biomass and phytoplankton taxa for community composition, water samples were collected at the mid-point of the water column using a 500 mL weighted pop-bottle at a single point within each micro-system. For Chl-a, duplicate water samples were gravity-filtered through plastic Millipore towers using Munktell MGC glass fibre filters (1.2 μηι pore size). The duplicate filters were kept cool in the field and then frozen once sampling was completed. The Chl-a was extracted overnight in the laboratory with 10 mL of 95% ethanol (Merck 4114) at 1-2°C. The extract was filtered, and the light absorbance of the filtrate was read at 665 nm before and after acidification with 1N HCl, using a GBC UV/VIS spectrophotometer (GBC UV/VIS 916, GBC Scientific Equipment Pty Ltd., 1995). The equation used to calculate Chl-a concentration was that of Hilmer (1990), derived from Nusch (1980):
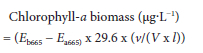
where:
Eb665 = absorbance at 665 nm before acidification
Ea665 = absorbance at 665 nm after acidification
v = volume of solvent used for the extraction (mL)
V = volume of sample filtered (L)
l = path length of spectrophotometer cuvette (cm)
29.6 = constant calculated from the maximum acid ratio
(1.7) and the specific absorption coefficient of chlorophyll a in ethanol (82 g-L-1-cm-1).
A presence-absence approach was applied to record the occurrence of benthic algal growth within each micro-system. This method is routinely used for surveying individual plants or vegetation communities and consisted of a simple observation of whether benthic algae were present in the micro-system or not (Bonham, 2013).
For phytoplankton community composition, the water samples (250 mL) were preserved with 1 mL of 25% glutaraldehyde solution. Two drops of Rose Bengal were added to a known volume of preserved water sample and poured into a 26.5 mm internal diameter Utermöhl settling chamber. The cells were allowed to settle for 24 h before identification using a Zeiss IM 35 inverted microscope at the maximum magnification of 630 X. Either a minimum of 200 frames or 200 cells were counted for each sample. The cells were classified according to phytoplankton classes and cell densities were calculated using the equation described by Snow et al. (2000):

where:
r = radius of settling chamber (mm)
A = area of each frame (mm2)
C = number of cells in each frame
V = volume sample in the settling chamber (mL)
Land-use types
The 2017 KZN Land-Cover Sentinel 2 Equivalent dataset was used to extract and calculate (in hectares) the land-use type distribution landwards of each micro-system, using ESRI ArcMap 10.5.1 software. The total land-use for each micro-system was obtained using a 1 km contour area (Taljaard et al., 2017). A 1 km contour area was selected to ensure the inclusion of intensive land-use activities - particularly agricultural - which occur outside the immediate adjacent catchment (i.e., 500 m) to these systems. Size and intensity of land-use upstream of a system may, in some instances, supersede the water quality signal from the larger catchment and subsequently become the key determinant of the water quality status of the micro-system inflow (Taljaard et al., 2017). The 2017 KZN Land-Cover Sentinel 2 Equivalent dataset was selected as it represents an overall mapping accuracy of 97.7% due to the incorporation of enhanced spectral content provided by the Sentinel 2 imagery, as well as multi-seasonal imagery that covers the full dynamic range of seasonal landscape characteristics. A total of 47 different land-cover classes have been delineated, of which the individual class mapping accuracy level ranges between 86% and 100% (EKZNW and GeoTerralmage, 2018).
Data analyses
The R programming language (Version 4.1.3, R Core Team, 2022) was used for all data analyses. The Shapiro-Wilks test was used to test for data normality. The association between the concentrations of the water quality variables and selected microalgal variables (phytoplankton biomass, community composition and benthic algae presence-absence) was tested using the parametric Pearson correlation coefficient, or Spearman's rank correlation when data were non-parametric. All data analyses were tested at a significance level of oc < 0.05.
RESULTS
Water quality variables
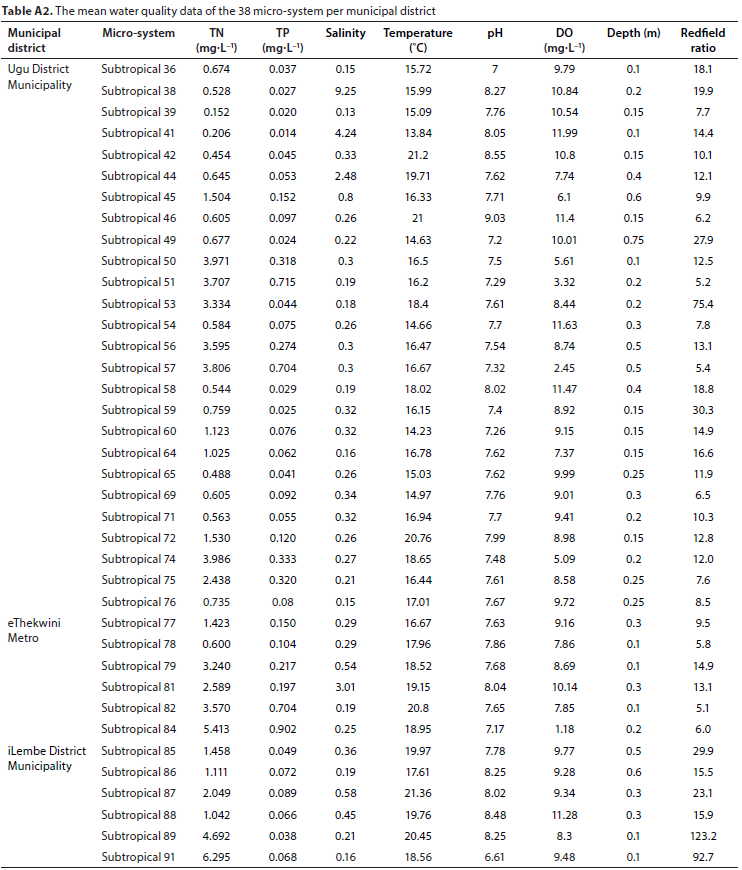
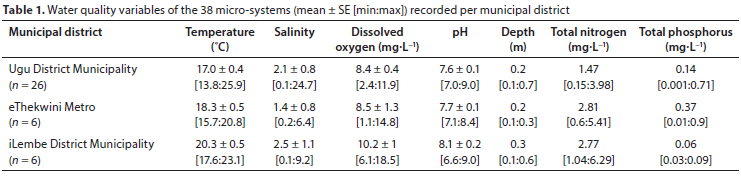
A total of 38 micro-systems were sampled along the length of the KZN coast in August 2021. Four of the pre-selected 42 microsystems were unable to be sampled due to a lack of a measurable water body (see Table A1, Appendix). Water chemistry data were summarised according to the municipal division because development plans and service delivery (e.g., sewage and sanitation) are likely different between the governing authorities (Table 1).
Results of the chemistry measurements for each micro-system are presented in Table A2 (Appendix). Water temperatures within the micro-systems ranged between 17.0°C and 19.6°C. Mean salinity values for most of the micro-systems were characteristic of oligohaline conditions (0.5-5), but with maximum salinity values in eThekwini and iLembe representing mesohaline conditions (5-18) and with polyhaline conditions (18-30) in Ugu. These shallow micro-systems (0.1 m > but < 0.75 m) were generally well oxygenated (>8 mg-L-1) with hypoxia (minimum < 3 mg-L -1) only evident in eThekwini (i.e., Subtropical 84) and Ugu (i.e., Subtropical 57) systems. The pH values were within the typical range (7.0 to 8.5, see Snow and Taljaard, 2007) for estuarine waters, with the exception of Subtropical 46 (9.0) and 91 (6.6). Total nitrogen (TN) and phosphorus (TP) concentrations exceeded eutrophic thresholds (TN > 1.2 mg-L-1 and TP > 0.07 mg-L-1; see Paulic et al., 1996) in both Ugu and eThekwini. Despite the evident enrichment of TN in the iLembe systems, mean TP concentrations were low (< 0.07 mg-L-1) indicating a good water quality. Maximum TN and TP concentrations were recorded in Ugu and eThekwini in Subtropicals 51, 57, 81, and 82 (see Table A2, Appendix). Both TN and TP showed a negative association (P < 0.05) with pH (rTH= -0.43, rTP = -0.32) and DO (rTH = -0.63, rTP= -0.81), suggesting biochemical cycling, i.e., in situ-remineralisation and biological uptake.
Land-use types
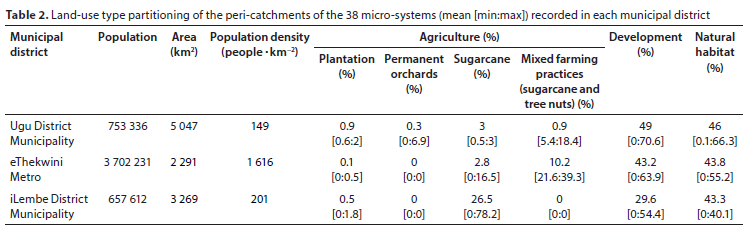
Three primary land-use types were identified within the 1 km peri-catchment of the micro-systems using the KZN LandCover Sentinel 2 Equivalent dataset. These include agriculture, development and natural habitat. Agriculture was further sub-divided into plantations, permanent orchards, sugarcane farming and mixed farming practices (Table 2). Most of the peri-catchments of the micro-systems in Ugu District consisted of development (49%), natural habitat (46%) and sugarcane farming (3%). In eThekwini, which also had the highest population density (1 616 per km2), the micro-system's peri-catchment consisted of development (43.2%), natural habitat (43.8%) and mixed farming (10.2%). Sugarcane farming (26.5%), development (29.5%) and natural habitat (43.3%) were characteristic of the micro-system peri-catchments in the iLembe District.
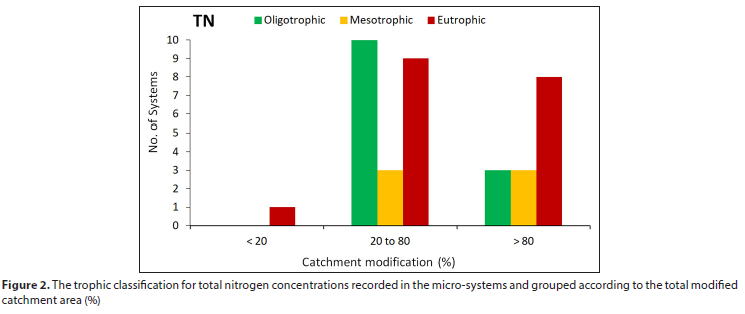
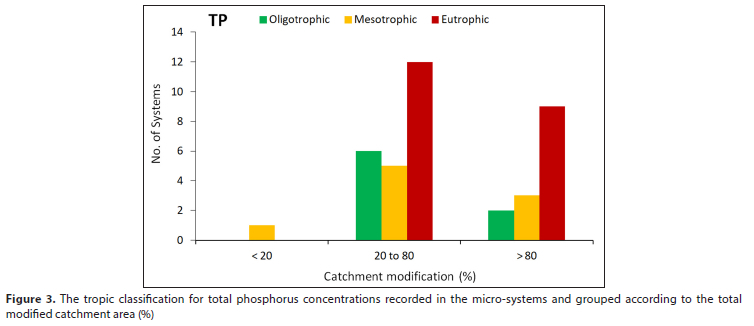
The micro-systems were grouped according to the total modified catchment (Figs 2 and 3). The trophic classifications for TN and TP were used to visualise any possible association between the anthropogenic land-use change (i.e., catchment modification of agriculture and development) and total nutrient concentrations. The ratio of micro-systems impacted by nutrient pollution increased concomitant with the size of modified catchment. Most of the micro-systems with a total modified peri-catchment above 80% were enriched by both TN and TP (Figs 2 and 3).
Phytoplankton biomass and community composition
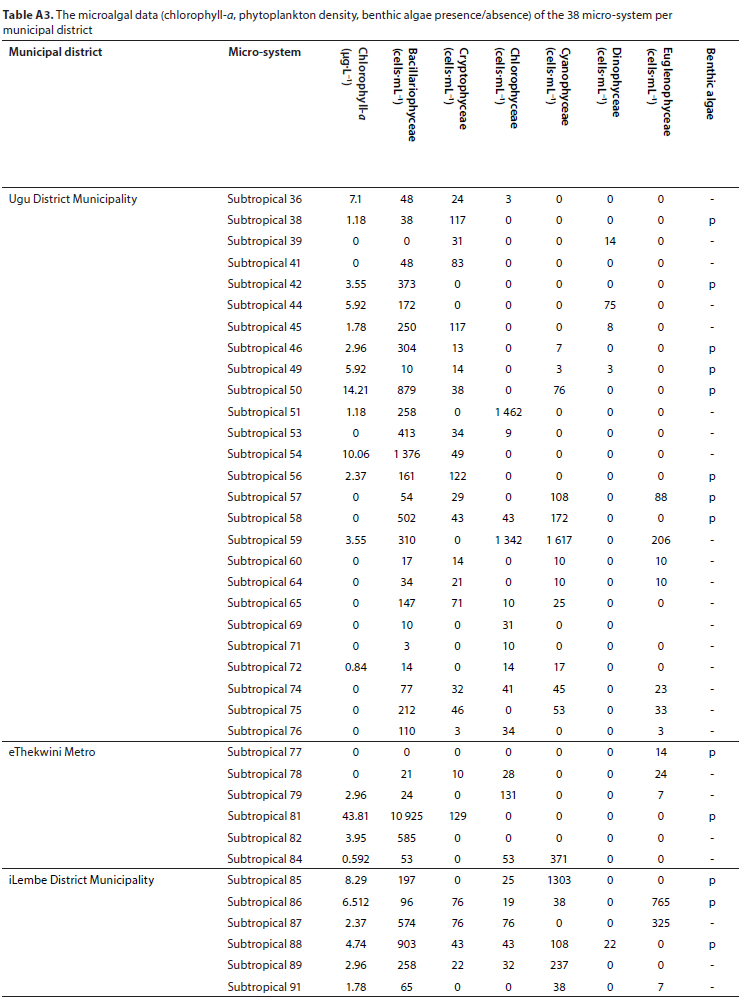
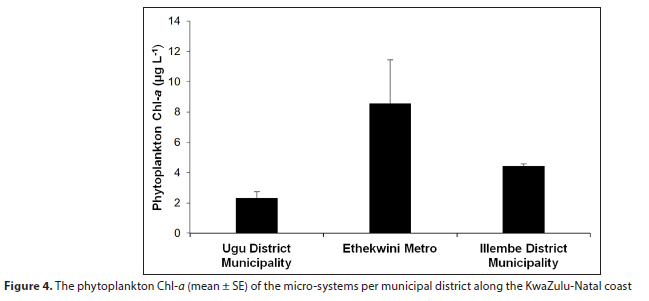
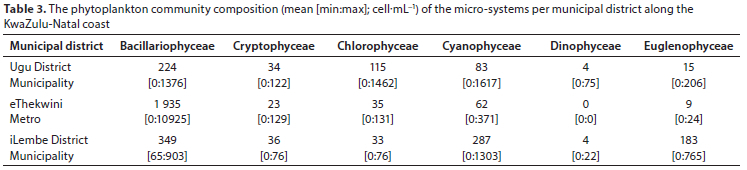
Mean phytoplankton Chl-a concentrations in the micro-systems ranged between 2.3 and 8.5 μg-L-1 (Fig. 4). High mean Chl-a concentrations were recorded in the eThekwini systems (8.5 ± 2.8 μg-L-1), while the lowest were recorded in the Ugu District systems (2.3 ± 0.4 μg-L-1). Subtropical 81 in eThekwini was the only micro-system where bloom concentrations (> 20 μg-L-1) were observed (Table A3, Appendix). A total of 6 phytoplankton functional groups were recorded. These included Bacillariophyceae, Cryptophyceae, Chlorophyceae, Cyanophyceae, Dinophyceae, and Euglenophyceae (Table 3). The dominant phytoplankton functional groups differed between the municipal districts. The micro-systems in the Ugu District were characterised by a co-dominant phytoplankton community of Bacillariophyceae (224 cells-mL-1) and Chlorophyceae (115 cells-mL-1). In the eThekwini metro systems, Bacillariophyceae (1 935 cells-mL-1) primarily dominated the phytoplankton community, with Cyanophyceae (62 cells-mL-1) and Chlorophyceae (35 cells-mL-1) identified as sub-dominant groups. No Dinophyceae were recorded in eThekwini. The micro-systems in iLembe were characterised by a co-dominant phytoplankton community of Bacillariophyceae (349 cells-mL-1) and Cyanophyceae (287 cells-mL-1). Bacillariophyceae showed a positive association (P < 0.05) with temperature (r = 0.3) and mean Chl-a (r = 0.3). A negative relationship was recorded between Cryptophyceae and temperature (r = -0.43), while increased salinity (r = 0.3) appeared to favour Cryptophyceae growth (P < 0.05). A positive relationship was recorded between Cyanophyceae and TN (r = 0.4).
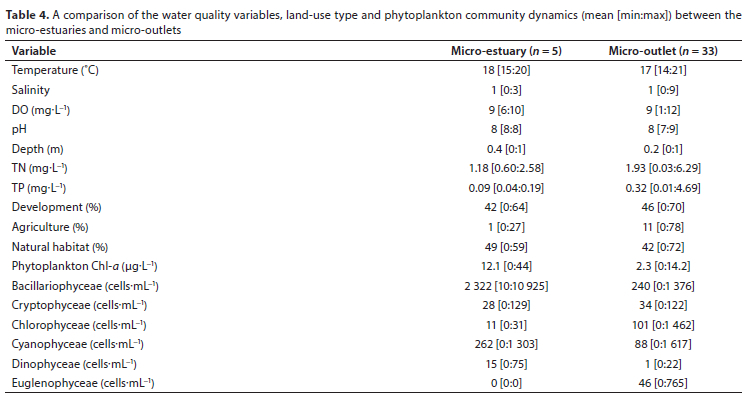
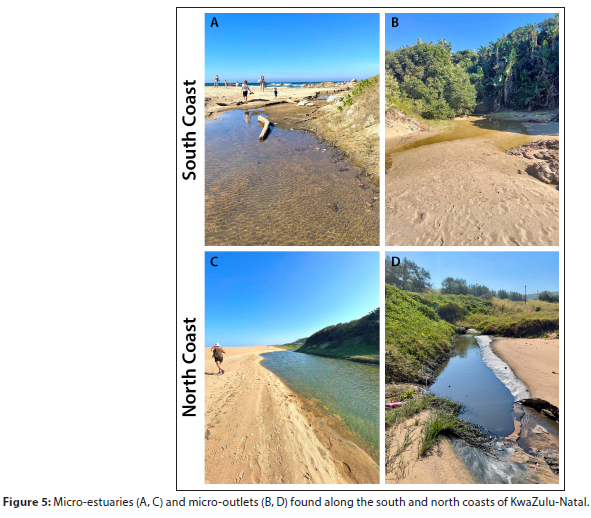
Micro-estuaries versus micro-outlets
Mean water temperature, salinity, DO, and pH were similar between systems (Table 4). Micro-estuaries and micro-outlets (Fig. 5) were generally fresh to oligohaline (> 0.5 but < 5) with an isolated instance of increased salinity (~ 9) recorded in micro-outlet Subtropical 38. According to the DO range, micro-estuaries were categorised by well-oxygenated (> 4 mg-L-1) conditions, whereas 33% of micro-outlets experienced near-anoxic (2.5 mg-L-1) to supersaturated (10 mg-L-1) DO levels. Mean total depth (m), phytoplankton Chl-a concentrations, Bacillariophyceae, and Cyanophyceae abundance were higher in the micro-estuaries compared to the micro-outlets. Micro-outlets presented with a higher availability of TP and had an increased abundance of Euglenophyceae (Table 4). With regards to land-use change, both micro-estuaries and micro-outlets were approximately equally impacted by development (42-46%), but the incidence of agricultural activities within the peri-catchment of micro-outlets was higher (11%) compared to micro-estuaries (1%).
DISCUSSION
Development (i.e., urbanisation) contributed the largest fraction (> 40%) of land-use change for the micro-systems situated within the Ugu and eThekwini areas (Nie et al., 2018). Nobre et al. (2020) showed that the percentage of anthropogenic land-use adjacent to small and shallow lakes was the key factor related to impaired lake water quality. Both the Ugu and eThekwini Metro microsystems were characterised by oligohaline conditions. High levels of impervious surfaces associated with urbanisation can lead to localised increased surface runoff (Han et al., 2017). In KZN, many small estuaries receive nutrient-enriched freshwater effluent discharges and diffuse runoff that increases the nutrient concentrations and reduces salinity (Adams et al., 2016).
The mean TP concentrations (~0.37 mg-L-1) recorded within microsystems in eThekwini were 2 to 6 times higher than other municipal areas. A study on regions of a subtropical microtidal lagoon showed phosphorus enrichment to be higher in urbanised rivers compared to non-urbanised rivers (Cabral and Fonseca, 2019).
The population density and human-led development are substantially higher in the eThekwini area, with approximately 1 616 people per km2 (Table 2). Nutrient enrichment in South African estuaries is generally caused by the disposal of municipal wastewater and diffuse urban runoff (Adams et al., 2020). This is especially evident in densely populated coastal settlements that lack reticulated sewage systems, where untreated sewage enters rivers and estuaries via stormwater runoff.
The mean TN concentrations observed in the micro-systems in the Ugu area were lower compared to the micro-systems in eThekwini and iLembe despite having the largest contribution of development (49%) within the peri-catchment. Anthropogenic pollutants carried along surface or subsurface pathways can be reduced when large proportions of land covered by forested areas and natural vegetations are present within the catchment (Nobre et al., 2020). Of all the municipal areas, Ugu had the highest percentage natural habitat (46%). This, coupled with the overall lower population density (i.e., 149 persons per km2), likely contributed to the lower concentrations of TN exported to the Ugu waterbodies.
Instances of hypoxia were recorded in Subtropical 57 (Ugu) and Subtropical 84 (eThekwini). Increased nutrient availability is well known to stimulate higher phytoplankton growth that can lead to bloom formation. Hypoxic conditions develop once the bloom organic material sinks to the bottom water where it decomposes. Yet, phytoplankton biomass (< 5 ug Chl-a-L-1) was low and Cyanophyceae abundance (dominant phytoplankton group) was less than 400 cells-mL-1 in both systems (see Table A3, Appendix). Results showed an inverse relationship between the total nutrients, DO, and pH, suggesting that in-situ remineralisation processes may be responsible for the hypoxic incidences. Remineralisation of organic matter not only increases nutrient availability but also causes hypoxia and lower pH (Snow and Taljaard et al., 2007; Feely et al., 2010). The iLembe micro-systems were characterised by higher DO (>10 mg-L-1) and pH (>8). Benthic algal mats were visible in 50% ofthese micro-systems (see Table A3). In the southern warm-temperate micro-systems, higher pH corresponded with increased algal growth (Human at al., 2018). Benthic algal mats are often dominated by filamentous cyanobacteria or by biofilms of epipelic diatoms that can be macroscopically recognisable when the microphytobenthos is abundant (Spetter et al., 2015). Benthic algae at the sediment surface produce oxygen. In turn, pH is affected by the photosynthetic CO2 assimilation (Revsbech et al., 1988; MacIntyre et al., 1996). As a result, supersaturated DO conditions typically coincide with higher pH (Revsbech et al., 1988), as was observed in the iLembe micro-systems during this study.
Mesohaline conditions were unique to the micro-systems within iLembe, where sugarcane farming practices (26.5%) and development (29.5%) contributed almost equally to the recorded land-use change. Additionally, and in contrast with the micro-systems south of the iLembe District, only TN exceeded the eutrophic threshold. Agricultural return-flow is the highest contributor to water quality deterioration in South African estuaries, but it often causes moderate nutrient pollution in estuaries nationally. Diffuse urban runoff and wastewater effluent discharge are responsible for heavy to severe nutrient pollution (Adams et al., 2020). As human activities have altered the N:P ratio in water, the global ratio of anthropogenic inputs is now estimated at up to 30:1, which is much higher than the average for ocean water and plankton, i.e., up to the 16:1 Redfield ratio (Penuelas and Sardans, 2022). This anthropogenic N:P ratio was exceeded in 50% of the micro-systems recorded in the iLembe District (see Table A2, Appendix). A similar nitrogen-phosphorus imbalance was observed in northern Queensland (Australia) where the use of fertilizer for sugarcane and banana cultivation increased the nitrate concentrations into adjacent streams and rivers which led to a much higher N:P ratio than the Redfield ratio, causing possible P limitation (Tanaka et al., 2021).
Variations in algal abundance and community composition are largely driven by bottom-up controls such as temperature, salinity, turbidity, hydrodynamics, and nutrient concentrations (Lemley et al., 2016; Wang and Zhang, 2020). With the exception of Subtropicals 50 and 81, the phytoplankton Chl-a concentrations for the micro-systems (see Table A3, Appendix) were within the range (0 to 10 μg-L-1) reported for temporarily closed estuaries (TCEs) (Perissinotto et al., 2010). These findings are in line with the observations of phytoplankton biomass in the southern warm-temperate (winter rainfall areas) micro-systems that were also reported as comparable to smaller TCEs. Higher phytoplankton biomass coincided with the winter season, when increased nutrients were available following catchment flooding (Dalu et al., 2018). Despite the excess TN (> 0.5 mg-L-1) and TP (> 0.05 mg-L-1) availability in most of the KZN micro-systems, phytoplankton biomass remained below bloom concentrations (< 20 μg L-1). This highlights the influence of other factors that facilitate the loss of phytoplankton biomass (e.g., grazing, flushing, cell death, and sedimentation), and which were not accounted for due to the limitations of a single spatial ecological assessment (Lemley et al., 2015; Roelke and Spatharis, 2015; Chorus and Spijkerman, 2021). However, benthic algal mats on the sediment surface were observed in some micro-systems (see Table A3). Microalgal biomass in the sediment has been shown to be substantially higher in comparison to the water-column in subtropical TCEs (Perissinotto et al., 2010). Therefore, future research efforts should include investigating the benthic microalgal community and their link to groundwater-sourced nutrients, as it may also be contributing a significant fraction of the total primary biomass within these micro-systems.
Bacillariophyceae (i.e., diatoms) were identified as the dominant phytoplankton group in the micro-systems, followed by Cyanophyceae, Chlorophyceae, and Euglenophyceae. Diatoms thrive in warmer temperatures and are generally the predominant phytoplankton group in estuaries (Lemley et al., 2016; Bharathi et al., 2022). However, due to their r-selected strategies it can be expected that diatoms would respond to a lower N:P ratio and would be outcompeted ifN:P in the environment increases (Glibert, 2020). This was observed in Subtropical 59 and 85 (see Table A3), where Cyanophyceae reached abundances above 1 000 cells-mL-1 and out-competed Bacillariophyceae when the N:P ratio peaked at 30:1, which coincided with oligohaline conditions. Globally, Cyanophyceae inhabits the widest variety of freshwater habitats (Wehr et al., 2015). In addition, increases in N loads tend to favour the proliferation of Cyanophyceae, while the excessive N availability can lead to a decline in the dissolved silicate (DSi) to nitrogen ratio required by diatoms for growth (Wehr et al., 2015; Wang and Zhang, 2020; Chorus and Spijkerman, 2021). When phytoplankton communities become dominated by non-diatom species due to a potential shift in the DSI:N ratio (< 1), the risk of the occurrence of harmful algal blooms increases (Kaiser et al., 2013).
Despite the similarities in mean temperature, salinity, DO and pH, the phytoplankton community dynamics were found to differ between micro-estuaries and micro-outlets. The small size and shallow depth of the micro-systems increases their susceptibility to anthropogenic activities (Suari et al., 2019). Concomitant with the shallower water depths, higher mean TN and TP concentrations were observed in the micro-outlets. Similarly, a study by Human et al. (2018) reported higher availability of total oxidised nitrogen in micro-outlets compared to micro-estuaries during winter. However, the southern warm-temperate micro-outlets are located within relatively pristine catchments (Human et al., 2018), whereas the KZN micro-outlets are largely impacted by urbanisation and agricultural activities. Results from this study showed that the trophic classification of the micro-systems was associated with the severity of the catchment modification, i.e., >80% modified for TN and >20% modified for TP. Total phosphorus typically increases with wastewater discharge, artificial drainage, and erosion (Tanaka et al., 2021). The excess catchment-derived nutrient availability was evidenced by the composition of phytoplankton communities in the micro-outlets, consisting of Chlorophyceae, Cyanophyceae and Euglenophyceae. These phytoplankton groups share habitat preferences by favouring standing or slow-flowing freshwater, rich in nutrients and organic matter (Wehr et al., 2015).
Riverine transport represents the primary pathway of nitrogen and phosphorus exports into the nearshore marine environment from anthropogenic land-based sources (Kaiser et al., 2013; Fredston-Hermann et al., 2016). Individual estuarine health is important as it contributes to the overall resilience (e.g., recruitment, flood recovery, and genetic exchange) of the network of estuaries along a section of coast (Van Niekerk et al., 2019a). The poor health state of many of the small estuaries within the three municipal districts has led to a 300 km functional gap in the network of estuaries in the subtropical bioregion (Van Niekerk et al., 2019a, 2019b). For example, a study by Moodley (2021) revealed anthropic levels of heavy metals in fish species found along the Durban coastline, linked to the intensification of industrial development and urbanisation within the catchment. As the frequency of extreme rainfall events is expected to increase along the KZN coast, it can be anticipated that diffuse agricultural runoff and contaminated stormwater runoff will only intensify in the future (Van Niekerk et al., 2019c). The threat that runoff poses to the coastal ocean is a growing concern among governments and conservation organisations globally (Fredston-Hermann et al., 2016). Three of the five KZN marine protected areas (i.e., Trafalgar MPA, Protea Banks MPA and Aliwal Shoal MPA) are situated along the 300 km impacted coastline (SAAMBR, 2022). Excessive nutrient loading can hinder the conservation success of marine areas selected for fish and habitat protection by facilitating the growth of algal blooms, hypoxic events, or reduced coral recovery (Mitchell et al., 2015; Fredston-Hermann et al., 2016; He and Silliman, 2019). Urgent management intervention is required to improve the degraded health status of the KZN micro-systems as the longterm cumulative impact of exporting anthropogenic-induced nutrients via the micro-systems and estuaries to the coast could be devastating, as shown by the closure of central beaches due to poor water quality following flood damage to existing WWTW infrastructure within the eThekwini area (Makhanya, 2022; Singh, 2022)
CONCLUSION
There is evidence that micro-estuaries have some characteristics that differ to those of micro-outlets. A review by Magoro et al. (2020b) on the southern warm-temperate micro-systems highlighted several biotic and abiotic differences, with micro-estuaries exhibiting higher diversity. The subtropical micro-estuaries presented with a deeper water column and lower concentrations of TP. The reduced availability of TP can be attributed to the low contribution of agricultural activities to the land-use type partitioning of the peri-catchments. The diatom abundance was 9-fold higher in the micro-estuaries compared to the micro-outlets, while freshwater groups like Chlorophyceae and Euglenophyceae were either present at low abundances or absent. As micro-outlets are elevated above mean sea level, mixing of sea and freshwater is limited (Van Niekerk et al., 2020). Diatoms are typically the main primary producers in estuaries owing to their euryhaline capacity, which allows this phytoplankton class to adapt to significant variations in salinity (Haraguchi et al. 2015; Glibert 2020; Conceicäo et al. 2021). The spatial and temporal distribution, abundance, and functional characteristics of estuarine biological communities are shaped by fluctuations in the ambient chemical and physical gradients (Da Costa Santana, 2018).
The broad classification of the land-use type partitioning of the peri-catchments limited any fine-scale identification of possible sources of pollution (e.g., seepage from septic tanks), and thus the hypothesis that residential development would be the primary source of nutrient enrichment could not be validated. The need for updated and/or detailed systematic topographic surveys of the South African coastline remains a key data requirement. These surveys are urgently needed to support estuarine planning processes and ecological assessments of change (Van Niekerk et al., 2019c). The question of where the highly polluted water is coming from is an important one. If the source of most of the pollution is from septic systems, then control will fall under numerous autonomous local municipalities. If, on the other hand, the source is from wastewater treatment plants there is the possibility of central government control. This is because the South African legal framework is largely sectoral, covering several government departments. Source identification needs to be prioritised for future investigations as this is necessary to engage with the correct government department for the effective mitigation, management, and control of anthropic pressures in these systems (Van Niekerk et al., 2019c). This study offers a baseline understanding of the water quality and phytoplankton dynamics of the subtropical micro-systems along the KZN coast.
ACKNOWLEDGEMENTS
This work is based on the support by Nelson Mandela University and the DSI/NRF Research Chair in Shallow Water Ecosystems (UID: 84375) that provided the equipment to undertake the field surveys and laboratory analyses. Mrs Anneke Botha of the Finance Department Nelson Mandela University is thanked for facilitating the finances. The National Research Foundation (NRF) of South Africa is thanked for providing postdoctoral fellowship funding to Dr Monique Nunes (grant number: 132717) and the Nelson Mandela University is thanked for providing postdoctoral fellowship funding to Dr Daniel A Lemley.
AUTHOR CONTRIBUTIONS
GCB conceptualised the study, led the interpretation of results, led the writing, performed critical revisions of the manuscript, and provided the funding. MN assisted in the data collection, data analysis, interpretation and assisted with the writing. DAL assisted in data collection, data analysis, interpretation and performed critical revisions of the manuscript. JBA assisted with data interpretation and performed critical revisions of the manuscript.
ORCIDS
GC Bate: https://orcid.org/0000-0001-8691-9250
DA Lemley: https://orcid.org/0000-0003-0325-8499
M Nunes: https://orcid.org/0000-0002-6538-1815
JB Adams: https://orcid.org/0000-0001-7204-123X
REFERENCES
ADAMS JB, TALJAARD S, VAN NIEKERK L and LEMLEY DA (2020) Nutrient enrichment as a threat to the ecological resilience and health of microtidal estuaries. Afr. J. Aquat. Sci. 45 1-18. https://doi.org/10.2989/16085914.2019.1677212 [ Links ]
ADAMS JB, COWIE M and VAN NIEKERK L (2016) Assessment of completed ecological water requirement studies for South African estuaries and responses to changes in freshwater inflow. WRC Report No. KV 352/15. Water Research Commission, Pretoria. [ Links ]
BATE GC, NUNES M, ESCOTT B, MNIKATHI A and CRAIGIE J (2017) Micro-estuary - a new estuary type recognized for South African conditions. Trans. R. Soc. S. Afr. 72(1) 1-8. https://doi.org/10.1080/0035919X.2016.1259689 [ Links ]
BEGG GW (1978) The estuaries of Natal. Natal Town and Regional Planning Report 41. Oceanographic Research Institute, Durban. [ Links ]
BEGG GW (1984) The comparative ecology of Natal's smaller estuaries. Natal Town and Regional Planning Report 62. Oceanographic Research Institute, Durban. [ Links ]
BHARATHI MD, VENKATARAMANA V and SARMA VVSS (2022) Phytoplankton community structure is governed by salinity gradient and nutrient composition in the tropical estuarine system. Continental Shelf Res. 234 104643. https://doi.org/10.1016/jxsr.2021.104643 [ Links ]
BONHAM CD (2013) Measurements for Terrestrial Vegetation (2nd edn). John Wiley & Sons, New York. ISBN 978-0-4709-7258-8. [ Links ]
CABRAL A and FONSECA A (2019) Coupled effects of anthropogenic nutrient sources and metea-oceanographic events in the trophic state of a subtropical estuarine system. Estuar. Coast. Shelf Sci. 225 106228. https://doi.org/10.1016Zj.ecss.2019.05.010 [ Links ]
CHORUS I and SPIJKERMAN E (2021) What Colin Reynolds could tell us about nutrient limitation, N:P rations and eutrophication control. Hydrobiologia 848 95-111. https://doi.org/10.1007/s10750-020-04377-w [ Links ]
CONCEIÇÃO LP, DE JESUS AFFE HM, DA SILVA DML and DE CASTRO NUNES JM (2021) Spatio-temporal variation of the phytoplankton community in a tropical estuarine gradient, under the influence of river damming. Reg. Stud. Mar. Sci. 43 101642. https://doi.org/10.1016/j.rsma.2021.101642 [ Links ]
DA COSTA SANTANA RM, DOLBETH M, DE LUCENA BARBOSA JE and PATRICIO J (2018) Narrowing the gap: Phytoplankton functional diversity in two disturbed tropical estuaries. Ecol. Indic. 86 81-93. https://doi.org/10.1016/j.ecolind.2017.12.003 [ Links ]
DALU T, MAGORO M, NAIDOO L, WASSERMAN R, HUMAN L, ADAMS J, PERISSINOTTO R, DEYZEL S, WOOLDRIDGE T and WHITFIELD A (2020) Microphytobenthos diversity and community structure across different micro-estuaries and micro-outlets: effects of environmental variables on community structure. Environ. Pollut. 206 114097. https://doi.org/10.1016/j.envpol.2020.114097 [ Links ]
DALU T, MAGORO ML, TONKIN JD, HUMAN LRD, PERISSINOTTO R, DEYZEL SHP, ADAMS JB and WHITFIELD AK (2018) Assessing phytoplankton composition and structure within micro-estuaries and micro-outlets: a community analysis approach. Hydrobiologia 818 177-191. https://doi.org/10.1007/s10750-018-3605-0 [ Links ]
EZEMVELO KZN WILDLIFE (EKZNW) and GEOTERRAIMAGE (2018) Updating the existing KZN Provincial Land-Cover Map (2011) to 2017: Data Users Report and Metadata (version 001). Unpublished report, Biodiversity Research and Assessment, Ezemvelo KZN Wildlife, Pietermaritzburg. [ Links ]
FEELY RA, ALIN SR, NEWTON J, SABINE CL, WARNER M, DEVOL A, KREMBS C and MALOY C (2010) The combined effects of ocean acidification, mixing, and respiration on pH and carbonate saturation in an urbanized estuary. Estuar. Coast. Shelf Sci. 88 442-449. https://doi.org/10.1016/j.ecss.2010.05.004 [ Links ]
FREDSTON-HERMANN A, BROWN CJ, ALBERT S, KLEIN CJ, MANGUBHAI S, NELSON JL, TENEVA L, WENGER A, GAINS SD and HALPERN BS (2016) Where does river runoff matter for coastal marine conservation? Front. Mar. Sci. 3 273. https://doi.org/10.3389/fmars.2016.00273 [ Links ]
GLIBERT PM (2020) Harmful algae at the complex nexus of eutrophication and climate change. Harmful Algae 91 101583. https://doi.org/10.1016/j.hal.2019.03.001 [ Links ]
HAN D, CURREL MJ, CAO G and HALL B (2017) Alternations to groundwater recharge due to anthropogenic landscape change. J. Hydrol. 544 545-557. https://doi.org/10.1016/j.jhydrol.2017.09.018 [ Links ]
HARAGUCHI L, CARSTENSEN J, ABREU PC and ODEBRECHT C (2015) Long-term changes of the phytoplankton community and biomass in the subtropical shallow Patos Lagoon Estuary, Brazil. Estuar. Coast. Shelf Sci. 162 76-87. https://doi.org/10.1016/j.ecss.2015.03.007 [ Links ]
HILMER T AND BATE GC (1990) Covariance analysis of chlorophyll distribution in the Sundays River estuary, Eastern Cape. S. Afr. J. Aquat. Sci. 16 37-59. https://doi.org/10.1080/10183469.1990.10557366 [ Links ]
HUMAN LRD, MAGORO ML, DALU T, PERISSINOTTO R, WHITFIELD AK, ADAMS JB, DEYZEL SHP and RISHWORTH GM (2018) Natural nutrient enrichment and algal responses in near pristine micro-estuaries and micro-outlets. Sci. Total Environ. 624 946-954. https://doi.org/10.1016/j.scitotenv.2017.12.184 [ Links ]
KAISER D, UNGER D, QIU G, ZHOU H and HUAYANG G (2013) Natural and human influences on nutrient transport through a small subtropical Chinese estuary. Sci. Total Environ. 450-451 92-107. https://doi.org/10.1016/j.scitotenv.2013.01.096 [ Links ]
KING G (1997) The Development potential of KwaZulu-Natal aquifers for rural water supply. MSc Thesis, Rhodes University. [ Links ]
KOROLEFF F (1983) Simultaneous oxidation of nitrogen and phosphorus compounds by persulfate. In Grasshoff K, Eberhardt M and Kremling K (eds.) Methods of Seawater Analysis (2nd edn.). Verlag Chemie, Weinheimer, FRG. [ Links ]
LEMLEY DA, ADAMS JB and BATE GC (2016) A review of microalgae as indicators in South African estuaries. S. Afr. J. Bot. 107 12-20. https://doi.org/10.1016/j.sajb.2016.04.008 [ Links ]
LEMLEY DA, ADAMS JB, TALJAARD S and STRYDOM NA (2015) Towards the classification of eutrophic condition in estuaries. Estuar. Coast. Shelf Sci. 164 221-232. https://doi.org/10.1016/j.ecss.2015.07.033 [ Links ]
MAGORO M, PERISSINOTTO R and WHITFIELD AK (2020b) Micro-estuaries and micro-outlets as incipient estuarine systems - Does size and coastal connectivity count? Sci. Total Environ. 703 134707. https://doi.org/10.1016/j.scitotenv.2019.134707 [ Links ]
MACINTYRE HL, GEIDER RJ and MILLER DC (1996) Microphytobenthos: The ecological role of the "secret garden" of unvegetated, shallow-water marine habitats.I. Distribution, abundance and primary production. Estuaries 19 (2) 186-201. https://doi.org/10.2307/1352224 [ Links ]
MAKHANYA S (2022) 'Fix the sewerage crisis, or vacate office' - DA ultimatum to ANC run eThekwini. IOL Daily News 3 November 2022. URL: https://www.iol.co.za/dailynews/news/kwazulu-natal/fix-the-sewerage-crisis-or-vacate-office-da-ultimatum-to-anc-run-ethekwini-0aef506f-e62c-4c68-8793-9a7b39dd0184 (Accessed 3 November 2022). [ Links ]
MAGORO M.L, DALU T, HUMAN LRD, PERISSINOTTO R, DEYZEL SHP, WOOLDRIDGE TH, ADAMS JB and WHITFIELD AK (2019) Characterization of selected micro-estuaries and micro-outlets in South Africa using microalgal, zooplanktonic and macrozoobenthic assemblages. Afr. J. Aquat. Sci. 44 (4) 313-327. https://doi.org/10.2989/16085914.2019.1677211 [ Links ]
MAGORO ML, PERISSINOTTO R, TATENDA D and WHITFIELD AK (2020a) Fish and tadpole composition as an indication of differences between micro-estuaries and micro-outlets in the Eastern Cape Province, South Africa. Estuar. Coast. Shelf Sci. 242 106865. https://doi.org/10.1016/j.ecss.2020.106865 [ Links ]
MITCHELL SB, JENNERJAHN TC, VIZZINI S and ZHANG W (2015) Changes to process in estuaries and coastal waters due to intense multiple pressures - An introduction and synthesis. Estuar. Coast. Shelf Sci. 156 1-6. https://doi.org/10.1016/j.ecss.2014.12.027 [ Links ]
MOODLEY R, MAHLANGENI NT and POOVENDHREE R (2021) Determination of heavy metals in selected fish species and seawater from the South Durban Industrial Basin, KwaZulu-Natal, South Africa. Environ. Monit. Assess. 193 206. https://doi.org/10.1007/s10661-021-09014-0 [ Links ]
NIE J, FENG H, WITHERELL BB, ALEBUS M, MAHANJAN MD, ZHANG W and YU L (2018) Cause, assessment, and treatment of nutrients (N and P) pollution in rivers, estuaries, and coastal waters. Curr. Pollut. Rep. 4 154-161. https://doi.org/10.1007/s40726-018-0083-y [ Links ]
NOBRE RLG, CALIMAN A, CABRAL CR, ARAÜJO GUÉRIN J, DANTAS FCC, QUESADO LB, VENTICINQUE EM, GUARIENTO RD, AMADO AM, KELLY P, VANNI MJ and CARNEIRO LS (2020) Precipitation, landscape properties and land use interactively affect water quality of tropical freshwaters. Sci. Total Environ. 716 137404. https://doi.org/10.1016/j.scitotenv.2020.137044 [ Links ]
NUSCH EA (1980) Comparison of different methods for chlorophyll and phaeopigment determination. Arch. Hydrobiol. Beiheft Ergebnise Limnol. 14 14-36. [ Links ]
PAERL HW, ROSSIGNOL KL, HALL SN, PEIERLS BJ and WETZ MS (2010) Phytoplankton community indicators of short- and longterm ecological change in the anthropogenically and climatically impacted Neuse River Estuary, North Carolina, USA. Estuar. Coasts 33 485-497. https://doi.org/10.1007/s12237-009-9137-0 [ Links ]
PAULIC, M, HAND J and LORD L (1996) 1996 Water-Quality Assessment for the State of Florida, Section 305(B) Main Report. Florida Dept. of Environmental Protection, Tallahassee. [ Links ]
PENUELAS J and SARDANS J (2022) The global nitrogen-phosphorus imbalance. Science. 375 (6578) 266-267. https://doi.org/10.1126/science.abl4827 [ Links ]
PERISSINOTTO R, STRETCH DD, WHITFIELD AK, ADAMS JB, FORBES AT and DEMETRIADES NT (2010) Chapter 1: Ecosystem functioning of temporarily open/closed estuaries in South Africa. In: Crane JR and Solomon AE (eds.). Estuaries: Types, Movement Patterns and Climatic Impacts. Nova Science Publishers, Inc., New York. [ Links ]
REVSBECH NP, NIELSEN J and HANSEN PK (1988) Chapter 4: Benthic primary production and oxygen profiles. In: Blackburn TH and S0rensen J (eds) Nitrogen Cycling in Coastal Marine Environments. John Wiley & Sons Ltd, New York. [ Links ]
R DEVELOPMENT CORE TEAM (2022) R: A Language and Environment for Statistical Computing. Version 4.1.3. R Foundation for Statistical Computing, Vienna, Austria. URL: https://www.r-project.org/ (Accessed January 2022). [ Links ]
ROELKE DL and SPATHARIS S (2015) Phytoplankton succession in recurrently fluctuating environments. PLoS ONE 10(3) e0121392. https://doi.org/10.1371/journal.pone.0121392 [ Links ]
SAAMBR (South African Association for Marine Biological Research) (2022) Marine protected areas (MPAs). URL: https://www.saambr.org.za/marine-protected-areas-mpas/ (Accessed 12 June 2022). [ Links ]
SINGH K (2022) eThekwini Municipality closes south region beaches due to poor water quality, public banned from water activities. Mercury News. 28 September. URL: https://www.iol.co.za/mercury/news/ethekwini-municipality-closes-south-region-beaches-due-to-poor-water-quality-public-banned-from-water-activities-d85c6cbd-d2a1-4355-b106-73de8989482e (Accessed 3 November 2022). [ Links ]
SNOW GC and TALJAARD S (2007) Water quality in South African temporarily open/closed estuaries: a conceptual model. Afr. J. Aquat. Sci. 32 (2) 99-111. https://doi.org/10.2989/AJAS.2007.32.2.1.198 [ Links ]
SNOW GC, ADAMS JB and BATE GC (2000) Effect of river flow on estuarine microalgal biomass and distribution. Estuar. Coast. Shelf Sci. 51 255-266. https://doi.org/10.1006/ecss.2000.0638 [ Links ]
SPETTER CV, BUZZI NS, FERNANDES EM, CUADRADO DG and MARCOVECCHIO JE (2015) Assessment of the physicochemical conditions sediments in a polluted tidal flat colonized by microbial mats in Bahia Blanca Estuary (Argentina). Mar. Pollut. Bull. 91 (2) 491-505. https://doi.org/10.1016/j.marpolbul.2014.10.008 [ Links ]
SUARI Y, AMIT T, GILBOA M, SADE T, KROM MD, GAFNY S, TOPAZ T and YAHEL G (2019) Sandbar breaches control of the biogeochemistry of a micro-estuary. Front. Mar. Sci. 6 224. https://doi.org/10.3389/fmars.2019.00224 [ Links ]
TALJAARD S, SLINGER JH and VAN NIEKERK L (2017) A screening model for assessing water quality in small, dynamic estuaries. Ocean Coast.Manage. 146 1-14. https://doi.org/10.1016/j.ocecoaman.2017.05.011 [ Links ]
TANAKA Y, MINGGAT E and ROSELI W (2021) The impact of tropical land-use change on downstream riverine and estuarine water properties and biogeochemical cycles: a review. Ecol. Process. 1-21. https://doi.org/10.1186/s13717-021-00315-3 [ Links ]
VAN NIEKERK L, ADAMS J.B, ALLAN DG, TALJAARD S, WEERTS SP, LOUW D. TALANDA C and VAN ROOYEN P (2019b) Assessing and planning future estuarine resource use: A scenario-based regional-scale freshwater allocation approach. Sci. Total Environ. 657 1000-1013. https://doi.org/10.1016/j.scitotenv.2018.12.033 [ Links ]
VAN NIEKERK L, TALJAARD S, ADAMS JB, BACHOO S, GEORGE C, DE VILLIERS P, LAMBERTH SJ, SINK K, MACKAY FC, PARAK P and MURISON G (2019c) Chapter 11 Government's response to declining estuarine ecosystems. In: South African National Biodiversity Assessment 2018: Technical Report. Volume 3: Estuarine Realm. Report Number: SANBI/NAT/NBA2018/2019/Vol3/A. South African National Biodiversity Institute, Pretoria. [ Links ]
VAN NIEKERK L, ADAMS JB, JAMES NC, LAMBERTH SJ, MACKAY C, TURPIE JK, RAJKARAN A, WEERTS SP and WHITFIELD AK (2020) An Estuary Ecosystem Classification encompassing biogeography, size and types of diversity that supports estuarine protection, conservation and management. Afr. J. Aquat. Sci. 45 199-216. https://doi.org/10.2989/16085914.2019.1685934 [ Links ]
VAN NIEKERK L, LAMBERTH SJ, JAMES N, TALJAARD S, THERON A, KRUG M and ADAMS JB (2019a) Chapter 10. How vulnerable are SA estuaries to climate change? In: South African National Biodiversity Assessment 2018: Technical Report. Volume 3: Estuarine Realm. Report Number: SANBI/NAT/NBA2018/2019/Vol3/A. South African National Biodiversity Institute, Pretoria. [ Links ]
WANG J and ZHANG Z (2020) Phytoplankton, dissolved oxygen and nutrient patterns along a eutrophic river-estuary continuum: Observation and modelling. J. Environ. Manage. 261 110223. https://doi.org/10.1016/j.jenvman.2020.110233 [ Links ]
WEHR JD, SHEATH RG and KOCIOLEK JP (2015) Freshwater Algae of North America, Ecology and Classification (2nd edn). Academic Press, USA. [ Links ]
 Correspondence:
GC Bate
Email: bategc@gmail.com
Received: 8 November 2022
Accepted: 27 June 2023
APPENDIX

