


Serviços Personalizados
Artigo
 Inglês (pdf)
 Artigo em XML
 Referências do artigo
Indicadores

Links relacionados
-
 Citado por Google
 -
 Similares em Google
Compartilhar

 Permalink
Water SA
versão On-line ISSN 1816-7950
versão impressa ISSN 0378-4738
Water SA vol.49 no.3 Pretoria Jul. 2023
http://dx.doi.org/10.17159/wsa/2023.v49.i3.3980
RESEARCH PAPER
Development of a procedure and tool for retrofit hydropower evaluation at South African dams
RE Schroeder; I Loots; M van Dijk; GL Coetzee
Department of Civil Engineering, University of Pretoria, Pretoria, South Africa
ABSTRACT
South Africa is in a critical power situation and is in dire need of additional generation capacity. Thus, renewable energy sources such as wind, solar and hydropower should be evaluated to identify high-potential and cost-effective sites. Rivers in South Africa, as a water-scarce country, are already heavily impounded, meaning that there are limited sites available for conventional hydropower generation. Instead, novel solutions such as retrofitting hydropower installations to existing infrastructure, like existing dams, are required. To estimate the retrofit hydropower potential at dams, a set of five tools was developed using Python 3, known as the University of Pretoria Retrofit Hydropower Evaluation Software (UP-RHES). The UP-RHES screens potential sites where historic flow records are available, then downloads the required flow records from the national database and performs a first-order hydraulic assessment of the site, as well as a first-order life cycle cost analysis. By applying the UP-RHES to 118 dams operated by the Department of Water and Sanitation (DWS), it was found that a total estimated hydropower potential of 128 MW with an annual energy output of between 385 and 469 GWh exists at South African dams. The Vaal, Pongolapoort, Goedertrouw and Blyderivierpoort Dams were found to be feasible sites with a combined capacity of 77 GWh/annum.
Keywords: hydropower, dams, electricity, renewable energy, retrofitting
INTRODUCTION
Building upon the widespread adoption of electricity brought about by the 2nd and 3rd industrial revolutions, the world has entered the 4th industrial revolution, and with it has moved into a digital age. As such, commerce, entertainment and education are all moving into the digital environment. Hence, reliable energy supply has become the foundation of economic activity (World Bank, 2022).
Despite this, 760 million people still do not have access to electricity, with most of these people living in developing Asia and sub-Saharan Africa (World Bank, 2021). This disadvantage is set to compound with the world's shift into the digital environment, as access to electricity is a prerequisite to the opportunities therein.
In particular, South Africa is in a critical power situation and is in dire need of additional generation capacity. To accomplish this, attention must be given to identifying and evaluating sites with possible energy generation capabilities, with specific emphasis on evaluating the potential renewable energy available in and around existing infrastructure. This approach minimises the cost of entry for renewable energy, thereby increasing adoption by making full use of the existing infrastructure.
This task is already being undertaken with the development of the South African hydropower atlas, wherein water distribution networks, pressure-reducing valves and dams have been identified as possible sites for renewable energy generation using retrofit hydropower, with the latter being the focus of this study (Bekker et al., 2021).
HYDROPOWER EVALUATION
The practice of generating energy using water is relatively simple and has been used since the invention of the water wheel. Hydropower is derived from the potential energy of stored water which, when released, can be converted to mechanical power through the use of hydraulic turbines such as Pelton, Francis, or Kaplan turbines. The mechanical power can be used directly or converted to electricity using a generator. However, each conversion induces losses and thus a general efficiency factor is introduced to yield the following equation (BHA, 2005):

where the efficiency, η, density, ρ and gravitational acceleration, g, can be assumed to remain constant. Therefore, the flow, Q, and available head, h, are the two variables required to evaluate the power, P. These variables are independent of each other but must be analysed simultaneously throughout the year to account for fluctuations caused by seasonal differences.
Three distinct methods of hydropower evaluation were identified, each of which has a unique approach to estimating the flow and head at a given site. The methods identified were:
• Duration curve analysis
• Monthly power computations
• Optimisation models
Duration curve analysis is commonly used in hydropower evaluation and provides an estimation of the potential hydropower for a series of exceedance probabilities. Duration curves relate either the flow or head to an exceedance probability by ranking their historic sequences and tabulating the number of times a given value was exceeded (Gulliver and Arndt, 1991). Similarly, a site's historic outflow sequence and its corresponding water level can be used with Eq. 1 to generate a power duration curve, in which the power for each entry in the outflow sequence can be calculated and ranked in descending order. This method allows for statistical confidence to be linked to the estimated potential power of the site, which is beneficial in predicting the long-term performance of the site as well as the expected return period of failure.
Monthly power computations use the average flows and the difference between monthly average headwater and expected tailrace elevations to estimate the average hydropower potential for each month ofthe year. The method was first noted as a method for retrofit hydropower evaluation by Chadderton and Niece (1983), who applied the method to estimate the potential at an existing dam in the USA. The method requires only basic datasets of monthly outflow and water level elevations and estimates the hydropower potential based on the current operation of the site.
In contrast, optimisation models with an objective function of maximising the annual energy output are used to calculate the theoretical available power for a given inflow exceedance probability, subject to the constraints of irrigation, water supply and ecological releases. This method requires significantly more data than the two alternatives, as sequences of all dam abstractions and inflows must be known. However, this yields an accurate and optimised estimation of the hydropower potential of a site and has been used to estimate the retrofit hydropower potential at African dams by Sule et al. (2018), but is not included in the scope of this study.
DEVELOPMENT OF EVALUATION TOOL
To allow for a rapid and realistic first-order estimation of the retrofit hydropower potential at South African dams, a set of 5 tools was developed using Python 3, which is a general-purpose programming language with an emphasis on code readability. These 5 tools are known as the University of Pretoria Retrofit Hydropower Evaluation Software (UP-RHES).
The UP-RHES was developed to identify and evaluate the maximum energy available at South African dams, using their current discharge volumes without considering changing the current operation of the dams. This was done by adapting historic flow and water level data provided by the South African Department of Water and Sanitation (DWS), which maintains a database of verified data on South Africa's water infrastructure. Duration curve analysis and monthly power computations were included in the UP-RHES. However, optimisation, as given by Sule et al. (2018), could not be included as various datasets required to generate the optimisation model were unavailable. This is a shortcoming of optimisation models in developing countries, where consideration for data capturing and availability is often not a priority.
To create a user-friendly environment, each tool is presented using a user interface, and only standard Python libraries were used in the development of the UP-RHES to ensure that the tools will run regardless of differences in Python installations. The tools that comprise the UP-RHES are as follows:
• An initial screening tool that considers some of the environmental and social impacts that may make a site unfeasible
• A dataset downloader that automates the process of downloading datasets from the DWS's website
• A rapid assessment tool
• A scenario assessment tool
• A life cycle cost analysis (LCCA) tool that determines the feasibility of a site at the pre-feasibility level
The UP-RHES identifies and evaluates the maximum energy available at South African dams, at the pre-feasibility level, through a 4-step procedure. The procedure begins by identifying a dam and a release point from the said dam, which is then screened using the initial screening tool to determine whether further investigation of the site is worthwhile. This is followed by a rapid assessment of the hydropower potential at the site, which can be used as starting point for the scenario assessment tool or indicate that the site is unfeasible. Finally, the scenario assessment tool and LCCA tool are used in tandem to evaluate and maximise the feasibility of retrofitting the site through iterative adjustments of the design scenario.
It should be noted that any hydro-installation would be site specific and requires tailored engineering analysis to assess the viability of each site, for various layouts and equipment. The UP-RHES is not an alternative to the engineering design process, but rather serves as supplementary software to filter out sites that are not considered viable. Furthermore, retrofitting hydro-equipment into any dam wall involves inherent dam safety risks. A comprehensive dam safety analysis would be required during the feasibility stage for any site under consideration.
The UP-RHES is available to download, without cost, from the following link: https://tinyurl.com/UPRHES and is compatible with Windows, Linux and macOS devices. This requires the installation of Python without cost, from https://www.Python.org/downloads/.
Initial screening tool
The initial screening tool determines whether further investigation of a site is worthwhile by eliminating unfeasible sites through a series of questions based on the environmental and social viability procedure developed by Van Vuuren et al. (2011), specifically for retrofit hydropower installations at South African dams.
The first set of questions is obvious, such as if there is a demand for electricity at the site and whether an agreement can be made with the dam owner. The second set of questions is a checklist of positive impacts that may be achieved during hydropower development. Finally, the third and fourth sets of questions are checklists of the possible environmental/social impacts that may be experienced during and after the construction of a hydropower station.
The site is deemed feasible so long as all the following criteria are met:
• There is at least one positive impact
• None of the environmental/social impacts has a rating of very high
• Less than half of the environmental/social impacts have a rating of high
Dataset downloader
During the development of the UP-RHES, it was found that downloading the required datasets from the DWS website can be tedious. Thus, the dataset downloader was developed to automate the process of downloading the required datasets. When making a request using the DWS website, the inputs specified by the user are used to generate a uniform resource locator (URL) that opens a web page containing the required dataset. By manipulating the separate components of the URL, the dataset for any combination of site, date and data type can be requested and stored.
This process is repeated to create the entire dataset, or until there is a significant data gap that results in no data being available for that period. In that case, the downloader must be restarted using the next available date. This was left unautomated, as recognising the frequency of data gaps in a dataset is important in determining the quality of the dataset. If the error is frequently encountered for a station, it suggests that the quality of the dataset may be poor, and it may be necessary for the user to investigate the data quality before analysing the data.
Rapid assessment tool
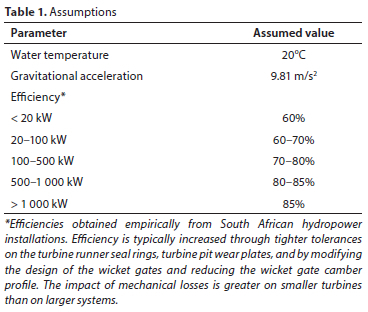
The rapid assessment to ol is the first of the two stages ofhydropower evaluation used in the UP-RHES and estimates the hydropower potential at a dam using monthly power computations, as proposed by Chadderton and Niece (1983). Average monthly power computations provide a useful breakdown of the expected hydropower available throughout the year and are calculated using the monthly average volume that flows through a release point of a dam and the average monthly water level as a percentage of the height of the dam wall. During the procedure the tool assumes the density of water (calculated from the fluid's temperature), gravitational acceleration and efficiency of the turbine; however, these can be overwritten by the user - the default values are listed in Table 1.
The tool begins by importing the dataset and excluding any non-numeric characters, such as '#' or '+, that indicate approximated or missing values. However, the dataset may still be of poor quality and it is recommended that the user inspects the dataset for repeated numbers, data gaps, excessive variance and rounded values to ensure the dataset is of sufficient quality.
Using the imported dataset, the average volume for each month is calculated and converted to flow by assuming that the flow is constant throughout the month. While the assumption fails to account for the timing of the releases it does provide a firstorder estimate of the hydropower potential, which may aid in identifying high-potential sites. Therefore, a filter is imposed to provide a more realistic estimation of the energy available throughout the year.
First, the average volume and standard deviation of the imported dataset are calculated, an upper limit is calculated using Eq. 2, and values that exceed the upper limit are set to the average. This removes outliers, which are representative of floods, to better represent the potential of the site under normal conditions. Equation 2 is an empirical simplification of the hypothesis testing procedure for a normal distribution, where 68, 95, and 99.7% of the values should lie within 1, 2 and 3 standard deviations from the mean, respectively.
Next, the average and standard deviation of the months adjacent to the month with the maximum average volume are calculated. The midpoint of these values is used to calculate a new upper limit, using Eq. 2, and the values that exceed the upper limit are set to the midpoint of averages. This is done to limit the difference in estimated flow between subsequent months to generate a more realistic expectation of the power available throughout the year.

where:
UL = upper limit
Finally, the theoretical power available at the dam is calculated using Eq. 1, by assuming the average volume occurs evenly throughout the month. This results in an estimated hydropower potential and theoretical average energy output for each month. The theoretical hydropower potential of the site is taken as the theoretical power in the maximum month and the potential annual energy is calculated as the sum of the monthly energy outputs.
Scenario assessment tool
The scenario assessment tool is used to evaluate the potential energy output for a given hydropower installation scenario. The tool estimates the amount of energy recoverable for a given combination of turbines by calculating the power duration curve for the site, based on the available historic flow and water level datasets, and evaluating how often the turbine combination can capture the available energy.
The tool generates a daily power duration curve, wherein the flow is taken as the daily average flow of the release point of the dam and the head is calculated as the daily average height between the water level in the dam and the centreline of the turbine, assumed to be installed near the base of the dam wall and discharging to atmospheric pressure.
During the calculations, the tool again assumes the parameters as presented in Table 1, with the user having the ability to override the default values. Additionally, the tool allows for the input or calculation of the head loss in the system using either a percentage of the total head or with Darcy-Weisbach with Von Kármán and Prandtl, shown in Eq. 3, in which the terms represent the friction and local losses, respectively (Chadwick et al., 2013):
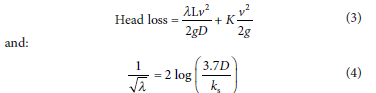
where:
v = velocity (m/s)
D = pipe diameter (m)
kS = absolute roughness (mm)
L = length of pipe (m)
K = local head loss coefficient
Similar to the rapid assessment tool, the scenario assessment tool begins by importing the required datasets while excluding any non-numeric characters, such as '#' or '+, which indicate approximated or missing values, and it remains the user's responsibility to review the quality of the dataset as discussed above.
A daily power table is then generated using the primary dataset of the dam, which contains water levels relative to the crest of the spillway, recorded several times each day. The average of these is calculated and matched to the corresponding average flow, from the gauging station of the abstraction/release point, for the same date.
The available head and average flow are used to calculate the theoretical power for each day using Eq. 1 and a power duration curve is generated by ranking the theoretical daily power outputs in descending order.
The exceedance probability for the theoretical daily power on the power duration curve is calculated as the quotient of the daily power's rank and the total number of entries in the curve. It represents the amount of time according to the historic record that a theoretical power is available. For example, the 100% exceedance probability represents the minimum power estimated, however, this power is available 100% of the time, whereas the ~0% exceedance probability represents the maximum power estimated which only occurred once in the historic record, equivalent to being available ~0% of the time.
Thus, an energy curve is generated by multiplying the theoretical power, on the power duration curve, by its exceedance probability and the number of hours in a year (8 760 h). This allows the annual energy output for a given power to be read off the energy curve. Additionally, the energy curve allows for the determination of the optimal point, wherein maximum energy output is achieved for a fixed power rating, as shown in Fig. 1.
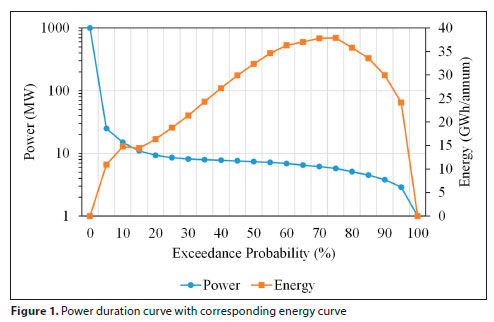
The optimal point on the energy curve represents the maximum energy potential of the hydropower installation scenario if a single turbine was used. Combinations of turbines can operate at multiple power ratings; for example, an installation scenario of three 1 MW turbines could operate at 1, 2 and 3 MW, respectively. The scenario assessment tool accounts for this by estimating the annual energy output of the installation as the sum of the energy outputs for each turbine combination. This is done by adding the respective energy outputs for each power rating that the turbine combination can operate at.
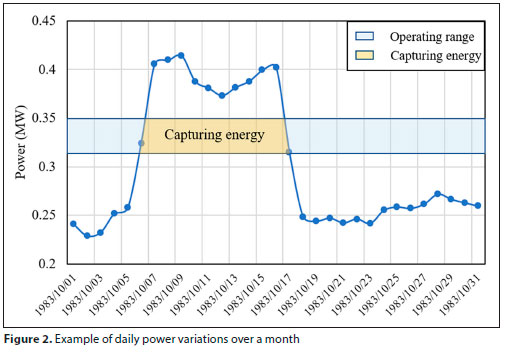
Additionally, turbines, much like pumps, can operate within a narrow range around their respective duty points. As such, the user may specify an operating allowance, which is the percentage of the turbine's rated power by which it may deviate below its rated power. The tool then calculates the energy output for each power value of each combination's operating range, as shown in Fig. 2. In this case, the energy for power ratings below that of the rated power is calculated using an exceedance probability, which is the difference between the subsequent exceedance probabilities. For example, in the case of the rated power of 1 MW having an exceedance probability of 20%, energies for the turbine operating at 0.9 MW are calculated as its exceedance probability, say 21%, minus the previous exceedance probability, to yield a value of 1%. Finally, the tool does not allow operating ranges for different turbine combinations to overlap, by requiring that the number of turbines be greater than the inverse of the operating allowance.
Multi-turbine operation allows the installation to operate across a wider range of the power duration curve, albeit operating at higher power ratings less frequently. However, this should be constrained against the installation costs as, while it may be possible to install a multi-turbine installation that can operate across the entire power duration curve, this would be costly and may be suboptimal. For this reason, the scenario assessment tool should be used in tandem with the LCCA tool to determine the most cost-effective installation scenario.
LCCA tool
The final tool in the UP-RHES is the life cycle cost analysis (LCCA) tool. The tool performs an economic assessment and determines, as a first-order assessment, the feasibility of the site. This is done by estimating the life cycle costs and benefits and, by using those values, calculating the net present value (NPV), benefit-cost (B/C) ratio, levelized cost of energy (LCOE) and internal rate of return (IRR) of the proposed project.
The UP-RHES is a pre-feasibility analysis tool; however, economic analysis and prediction at a pre-feasibility level are often inaccurate. This is due to the use of generalised costing functions and by assuming that economic drivers, such as the inflation rate, are constant throughout the project. However, accurately estimating the final costs and benefits of a project is not the point of a pre-feasibility analysis; rather a general estimation of the magnitude and proportions of the costs and benefits is desired. This allows for feasible sites to proceed to feasibility and detailed levels of analysis, wherein an accurate estimation of the costs and benefits can be developed.
Therefore, the LCCA tool was developed by calibrating the estimated costs using real values of retrofit hydropower projects undertaken in South Africa as presented by Van Vuuren et al. (2011), namely Sol Plaatjie Dam and the estimated costs of retrofitting the Vaal Dam according to the Vaal hydro report. The values of these projects were brought forward using an inflation rate of 6%, and the costs generated by the tool were calibrated such that they underestimate the costs compared to the 'real' values, with minimal errors, while reporting similar project feasibilities based on the IRR.
By underestimating the costs of the project, the tool is more likely to suggest that the site is feasible. This was done to avoid a false negative error, where a feasible site is deemed unfeasible and does not proceed to more detailed levels of analysis. Furthermore, retrofit hydropower is a relatively new field of interest, especially in South Africa, with very few publications available on estimating costs and benefits, thus the calibration was applied to the broad costs of construction, planning and operation and maintenance.
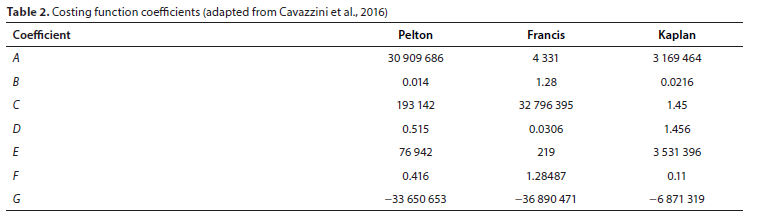
The electromechanical cost for each turbine is estimated according to the formulas proposed by Cavazzini et al. (2016), shown in Eq. 5 and Table 2, brought forward 5 years with an inflation rate of 6% and converted to South African Rands (ZAR) using the inputted ZAR/Euro conversion rate, which by default is set to 17 ZAR/€, but can be adjusted by the user as needed.
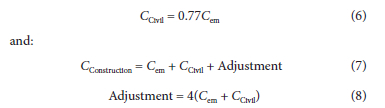
It was assumed that in retrofit hydropower installations, the civil works cost will be less than the cost of the electromechanical equipment. Thus, the civil works are estimated at 77% of the electromechanical costs (Eq. 6), using the cost breakdown illustrated by Ogayar and Vidal (2009).
During calibration it was found that the cost functions by Cavazzini et al. (2016) underestimated the total construction costs for South African projects, thus an adjustment factor was introduced, such that the total construction costs estimated by the tool matched those of the calibration sites, as shown in Eq. 7. The adjustment that resulted in an underestimation of the costs with minimal errors was found to be a factor of 4, shown in Eq. 8. The underestimation was likely due to the costing functions not considering the import, installation and escalation costs of the electromechanical equipment.

where:
C = costs (ZAR; 2021)
H = net head (m)
Q = design flow rate (L/s)
P = design power (kW)
a, b, c, d, e, f and g = coefficients
Using the electromechanical costs, the LCCA tool estimates the planning costs of the project including design and licensing fees. The LCCA tool assumes that a Basic Assessment Report (BAR) will be required for all sites, while only sites with a theoretical available power greater than 20 MW will be subject to an Environmental Impact Assessment (EIA). Additionally, the tool assumes no water use licence will be required as a retrofit hydropower station would be an extension of a current operation that should already be in possession of a licence (or should only require general authorisation).
Annual operation and maintenance are calculated by the tool as the sum of the civil maintenance, electromechanical maintenance, operating costs, insurance and water use tariffs. The default unit sale price of the electricity generated is set to 1.2 ZAR/kWh, based on Eskom's current Ruraflex rate (Eskom, 2021), and may be adjusted by the user as needed. The annual revenue is then calculated as the unit sale price multiplied by the annual energy output of the site.
Finally, the tool calculates the NPV of costs and benefits, respectively, by assuming the construction costs to take place in Year 1, and operation and maintenance costs as well as revenue to begin in Year 2. The estimates of the costs occurring in Year 0 are inflated using the inputted inflation rate, while the annual revenue is increased using a separate energy escalation rate. The estimated costs and benefits for each year in the expected life of the project are brought back to a present value using a geometric annuity, as shown in Eqs 9 and 10, for a distinct discount rate.
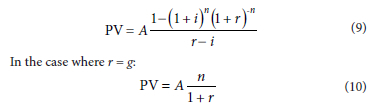
where:
PV = present value of the annuity (ZAR)
i = growth rate of annuity (%)
r = discount rate (%)
n = years
Once the NPV of costs and benefits are known, the NPV, B/C, LCOE and payback period are calculated. The IRR is then calculated by repeating the calculation using an increasing discount rate until the NPV reaches a value of 0, with that discount rate being the IRR.
APPLICATION OF THE UP-RHES: METHODOLOGY
Using the UP-RHES, a first-order estimate of the retrofit hydropower potential of South Africa's dams was made. The approach was designed to estimate the total retrofit hydropower potential at South African dams, identify high-potential dams, and estimate the general feasibility of retrofitting South African dams with hydropower installations.
The approach began by using the rapid assessment tool of the UP-RHES to estimate the total latent hydropower at South African dams. This was done by downloading the monthly volume datasets for each dam operated by the DWS. Datasets were downloaded for the downstream/W-component of each dam, as the flows over the W-component represent the outflows leaving the dam through either the spillway or environmental releases, which if passed through a turbine could generate hydropower, and were assumed to account for the majority of the outflow.
However, several dams' datasets were not available and therefore were excluded from the analysis. This left 118 dams suitable for analysis, which were spread throughout the country. From the rapid assessment, the 10 dams with the greatest potential were identified and included with dams shortlisted by the Department of Energy (DoE) and presented in the National Water Resource Strategy 2 (DWA, 2013). These dams accounted for most of the estimated total potential and as such were subjected to a second round of analysis using the scenario assessment tool. Furthermore, the high-potential dams were grouped according to their respective river systems to identify high-potential dams that may be dependent on the performance of upstream dams.
Finally, the results of the scenario assessment tool were used to perform a LCCA and sensitivity analysis on each of the highpotential dams to estimate the economic feasibility of retrofitting hydropower at South African dams. This was done by calculating the IRRs and average LCOE of the high-potential dams and comparing the LCOE to those of alternative energy sources such as wind, solar and coal.
Dam wall heights are available from both DWS and SANCOLD registers; however, the heights presented vary between the two and are significantly different from those observable using satellite imagery. This was likely due to the depth of the foundation not being known. To account for this, the average monthly water levels for each dam were taken from the expected percentage of storage under very-low conditions, available from the DWS website, and the heights of dam walls were taken from the SANCOLD register.
The efficiency was initially set to 100% to provide an estimation of the magnitude of power at a site, which was then used to select a general efficiency as per the ranges shown in Table 1. During the scenario assessment, it was assumed that the height between the spillway crest and turbine centreline would be equal to the height of the dam and that a 2% head loss would occur. Finally, the economic assessment was conducted for energy escalation, inflation and discount rates of 4, 8, 12 and 16%, and for each combination thereof, with additional assumptions, as follows:
• A design life of 20 years
• exchange rate of 17 ZAR/Euro
• an initial electricity sale price of 1.2 ZAR/kWh
APPLICATION OF THE UP-RHES: RESULTS
The initial analysis, assuming an efficiency of 100%, estimated the retrofit hydropower potential of South African dams to be 128 MW with a gross annual energy output of 567 GWh. Once the efficiencies (Table 1) relevant to each site were applied, the retrofit hydropower potential of South Africa reduced to 108 MW with a gross annual energy output of 478 GWh.
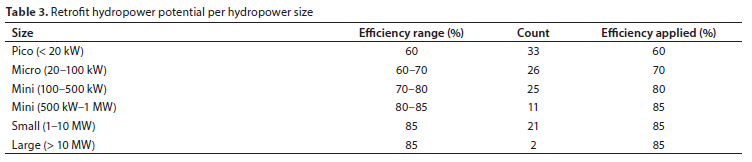
One of the main benefits of storage hydropower is its ability to provide peak clipping during periods of fluctuating demand. However, only two dams (Boegoeberg and Spioenkop) showed a potential greater than 10 MW. This suggests that there are no dams, among those that do not currently have hydropower installations, that can stabilise South Africa's power supply directly. Furthermore, 19.5% of the dams analysed had a potential greater than 1 MW, which accounted for 88% of the total estimated retrofit hydropower potential. This is illustrated in Table 3 and supported the decision to focus the energy and economic feasibility assessments on the top performing sites alone.
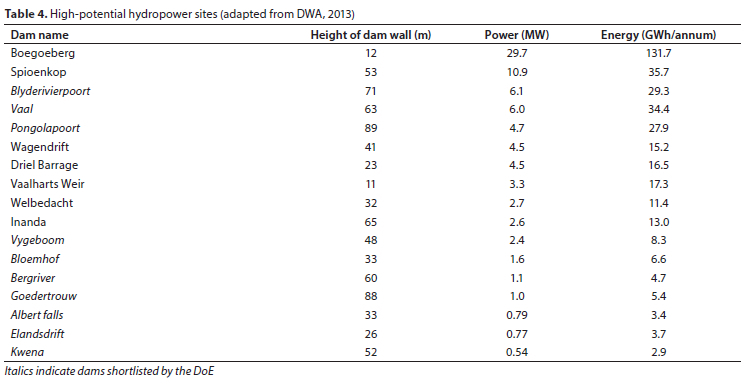
The theoretical power and annual energy output of the 17 high-potential sites are listed in Table 4. The 17 high-potential sites were a combination of the 10 sites with the highest theoretical power outputs and the sites shortlisted by the DoE in the National Water Resource Strategy 2 (DWA, 2013). Two dams were excluded from the shortlisted dams: Ncora Dam and De Hoop Dam. Ncora Dam was excluded as it has been fitted with a hydropower station and De Hoop Dam was excluded due to a poor dataset.
Next, the energy available at the high-potential dams was re-evaluated using the scenario assessment tool for the turbine size (power rating) recommended by the rapid assessment tool. Additionally, the scenario assessment tool produced an optimal turbine power rating that results in maximum energy generation for single turbine installations. However, 6 of the high-potential sites did not have the required datasets available and thus were excluded from the second round of the analysis. These dams were Boegoeberg, Driel Barrage, Welbedacht, Bloemhof, Elandsdrift and Kwena.
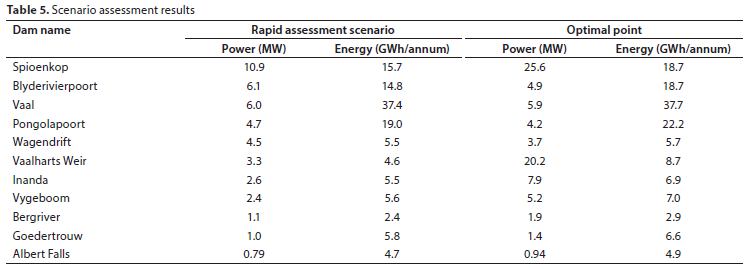
In 9 of the remaining 11 high-potential sites, the scenario assessment tool drastically reduced the theoretical annual energy available and at sites where an increase was found, it was slight. On average the energy reduced with a factor of 0.68, which would suggest that the total annual energy output of South African dams would be between 385 and 420 GWh. However, under the optimal power rating, the range rises to be between 447 and 469 GWh. The results of the scenario assessment are shown in Table 5.
Plotting the location of each of the high-potential sites yielded Fig. 3, in which 3 river systems were found to have highpotential sites that were upstream of each other. Consequently, the hydropower potential of these sites may be dependent on the performance and demands of the upstream and downstream sites. Further investigation is required to accurately predict the potential of these sites, which was outside the scope of this study. The three river systems were as follows: Orange River, Thukela River and Mgeni River.
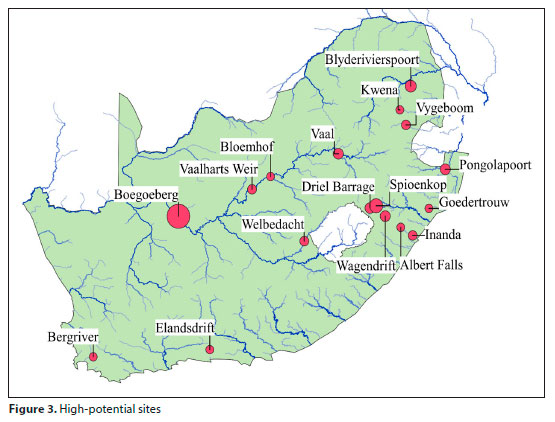
The Orange River contains 4 high-potential dams, beginning with the Vaal Dam and then followed by Bloemhof Dam and Vaalharts Weir before ending at Boegoeberg, which is indirectly supplied by Welbedacht Dam.
The Thukela River contains 2 high-potential dams, starting with Driel Barrage and ending at Spioenkop Dam, with Wagendrift being situated close to both, along a tributary of the Thukela.
The Mgeni River contains 3 high-potential sites, beginning with Albert Falls Dam and ending at Inanda Dam; however, Midmar Dam, upstream of Albert Falls, also showed a significant potential of 0.98 MW and 2.94 GWh per year, and thus was also included in the high-potential sites.
Finally, a LCCA and sensitivity analysis was conducted using the UP-RHES to estimate the economic feasibility of retrofit hydropower in South Africa. The analysis was conducted on the high-potential sites for two alternatives: firstly, using the turbine size (power rating) recommended by the rapid assessment tool with the adjusted energy output suggested by the scenario assessment tool and, secondly, using the optimal single turbine scenario. This was then repeated for each combination of energy escalation, inflation, and discount rates of 4, 8, 12 and 16%.
The first alternative resulted in only the Pongolapoort and Vaal Dams being feasible under a variety of economic conditions, with IRRs ranging from 7 to 38%. Once the energy escalation rate exceeded 12% most of the sites were feasible, except for Bergriver, Inada, Spioenkop, Vaalharts Weir and Wagendrift, which were only feasible under ideal circumstances. However, most sites became infeasible once the inflation rate equalled or exceeded the energy escalation rate, with the only exceptions being the Pongolapoort, Vaal, Blyderivierpoort and Goedertrouw Dams. The second alternative, for optimal single turbine installations, resulted in similar behaviours to the first alternative, with slight differences in IRRs.
Plotting the trend of the energy escalation and inflation rates on the IRRs, as shown in Fig. 4, indicates that the feasibility is predominantly affected by the relationship between the energy escalation and inflation rates. Usually this is irrelevant as the energy escalation and general inflation rates would behave similarly; however, in South Africa the cost of energy has drastically increased compared to the general inflation rate, with energy escalation rates averaging 15% (Eskom, 2021). This suggests that retrofit hydropower may be feasible at South African dams, under the condition that the energy escalation rate stays significantly higher than the general inflation rate.
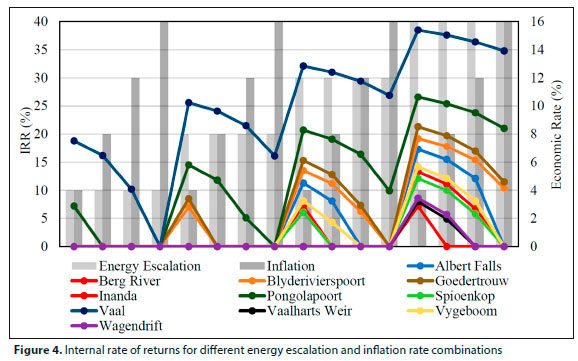
The high-potential sites had an average LCOE of 2.4 ZAR/ kWh, which is well above the global average for hydropower of 1.05 to 1.64 ZAR/kWh, as well as for the average cost of wind, solar and coal in South Africa of 0.62, 0.62 and 1.03 ZAR/kWh, respectively (Bofinger and Stander, 2017). However, the feasible sites had significantly lower average LCOEs of 0.65, 1.11, 1.6 and 1.68 ZAR/kWh for the Vaal, Pongolapoort, Goedertrouw and Blyderivierpoort Dams, respectively.
CONCLUSIONS
The assessment showed that South African dams have a significant latent hydropower potential, with a total estimated hydropower potential of 128 MW with a theoretical energy output of between 385 and 469 GWh/annum. However, most of this potential came from a minority of the analysed dams, with only 23 of the 118 analysed dams exceeding 1 MW in hydropower potential. Furthermore, the feasibility of the high-potential sites is dependent on the energy escalation rate exceeding general inflation rates and, in comparison to alternative forms of renewable energy, retrofit hydropower seems to be prohibitively expensive in many cases. Therefore, the DoE's focus on solar and wind power is warranted for widespread energy generation.
However, the Vaal, Pongolapoort, Goedertrouw and Blyderivier-poort Dams were found to be economically feasible under a wide range of conditions, with a combined energy generation capacity of 77 GWh/annum. Thus, retrofitting the Vaal, Pongolapoort, Goedertrouw and Blyderivierpoort Dams may provide a substantial contribution to South Africa, a country in dire need of additional generation capacity, and these sites should be analysed in greater detail.
ACKNOWLEDGEMENTS
The authors would like to thank the South African Water Research Commission (WRC), who funded the project, and the University of Pretoria for their permission to publish this paper. The opinions and views presented in this paper are, however, those of the authors and do not necessarily reflect those of the WRC nor those of the University of Pretoria.
AUTHOR CONTRIBUTIONS
RE Schroeder: Conceptualisation of methodology, data collection, interpretation of results, and writing of the draft. I Loots: Revision of methodology and draft. M van Dijk: Conceptualisation of the project and revision of the draft. GL Coetzee: Revision of methodology and draft.
ORCIDS
Reinhard Schroeder: https://orcid.org/0000-0002-9145-3632
Ione Loots: https://orcid.org/0000-0003-0715-6852
Marco van Dijk: https://orcid.org/0000-0002-3830-526X
Louis Coetzee: https://orcid.org/0000-0001-9616-6467
REFERENCES
BEKKER A, VAN DIJK M, COETZEE GL and HANSEN C (2021) The development of the South African hydropower atlas. In: SANCOLD 2021 Annual Conference: Resilient Dams in a Challenging Environment, 2-4 November 2021, Pretoria. [ Links ]
BOFINGER, S. and STANDER, J.N (2017) LCOE estimation in aggregated wind/PV study. In: WINDABA 2017, 15-16 November 2017, Cape Town. [ Links ]
BHA (British Hydropower Association) (2005) A Guide to UK Mini-Hydro Developments. The British Hydropower Association, Wimborne, UK. [ Links ]
CAVAZZINI G, SANTOLIN A, PAVESI G and ARDIZZON G (2016) Accurate estimation model for small and micro hydropower plants costs in hybrid energy systems modelling. Energy. 103 746-757. https://doi.org/10.1016/j.energy.2016.03.024 [ Links ]
CHADDERTON RA and NIECE JA (1983) Retrofit of hydropower capacity at Conemaugh dam. Water Resour. Bull. 19 (1) 101-106. https://doi.org/10.1111/j.1752-1688.1983.tb04564.x [ Links ]
CHADWICK A, MORFETT J and BORTHWICK M (2013) Hydraulics in Civil and Environmental Engineering (5th edn). CRC Press, Boca Raton. https://doi.org/10.1201/b14556 [ Links ]
DWA (Department Of Water Affairs, South Africa) (2013) National Water Resource Strategy. June 2013 Second Edition. Department of Water Affairs, Pretoria. [ Links ]
ESKOM (2021) Tariffs & Charges 2021/2022. Eskom, South Africa. [ Links ]
GULLIVER JS and ARNDT REA (1991) Hydropower Engineering Handbook (1st edn). McGraw-Hill, United States of America. [ Links ]
OGAYAR B and VIDAL PG (2009) Cost determination of the electro-mechanical equipment of a small hydro-power plant. Renewable Energ. 34 (6) 6-13. https://doi.org/10.1016/j.renene.2008.04.039 [ Links ]
SULE BF, ADUNKPE TL and SALAMI AW (2018) Evaluation of the reservoir yield and hydropower potential of the Doma Dam, Nasarawa state, north central Nigeria. Int. J. Technol. 1 16-24. https://doi.org/10.14716/ijtech.v9i1.1194 [ Links ]
VAN VUUREN SJ, BLERSCH CL and VAN DIJK M (2011) Modelling the feasibility of retrofitting hydropower to existing South African dams. Water SA 37 (5) 679-692. https://doi.org/10.4314/wsa.v37i5.5 [ Links ]
WORLD BANK (2021) Access to electricity (% of population). URL: https://data.worldbank.org/indicator/EG.ELC.ACCS.ZS?end=2019&name_desc=false&start=2019 (Accessed 16 September 2021). [ Links ]
WORLD BANK (2022) Electricity availability and economic activity: Lessons from developing countries. URL: https://www.worldbank.org/en/events/2020/09/22/electricity-availability-and-economic-activity#1 (Accessed 9 September 2021). [ Links ]
 Correspondence:
Reinhard Schroeder
Email: reinhard.schroeder@aecom.com
Received: 9 February 2022
Accepted: 24 July 2023

