


Serviços Personalizados
Artigo
 Inglês (pdf)
 Artigo em XML
 Referências do artigo
Indicadores

Links relacionados
-
 Citado por Google
 -
 Similares em Google
Compartilhar

 Permalink
Water SA
versão On-line ISSN 1816-7950
versão impressa ISSN 0378-4738
Water SA vol.49 no.3 Pretoria Jul. 2023
http://dx.doi.org/10.17159/wsa/2023.v49.i3.4000
RESEARCH PAPER
Multiple linear regression models for the estimation of water flows for forest management and planning in Türkiye
Hayati ZenginI; Mehmet ÖzcanII; Ahmet Salih DegermenciI; Tarik ÇitgezII
IDepartment of Forest Management and Planning, Faculty of Forestry, Düzce University, Düzce, Türkiye
IIDepartment of Watershed Management, Faculty of Forestry, Düzce University, Düzce, Türkiye
ABSTRACT
While there are many factors, including climatology, geography, topography, vegetation and soil, that affect hydrologic processes, understanding the role of forests seems most essential, due to their manageable nature. In this study, a holistic approach was taken, and possible factors affecting streamflow, including tree, sapling, shrub, herb and soil strata, were measured for 29 small catchments/stream basins located in Turkey. Linear regression models were developed in order to estimate water flow (m3-ha-'). Several models were suggested for use in practice. These models were based on the data on hand and displayed a sufficient level of explained variance in the dependent variable. Model 5, based on the variables of catchment area (ha), drainage density, ratio of coniferous stand areas in the catchment (%), tree volume (m3-ha-'), leaf area index, number of short saplings (number-ha-1), and topsoil sand rate (%), was recommended for flow estimation, achieving a 0.73 adjfi2 value for test data. These variables can be obtained as part of a survey and water managers can use them to estimate water flow of the catchment. The generated models can be used in multiple-use planning of forests, e.g. in adjusting the volume of stands to get optimum benefit from wood and water production. One of the most interesting results and one that was opposite to that documented in the general literature, was the positive correlation between tree volume and flow per hectare, which suggests a strategy of growing older tree stands to enable greater water production.
Keywords: flow, forest, runoff coefficient, sustainability, water yield
INTRODUCTION
The water availability of a region does not solely depend on the amount of precipitation. In fact, attributes like land form, geological and lithological basis, soil characteristics, temperature, precipitation pattern and its seasonal distribution are also important. With their variable structure, forests also play an important role in the hydrological cycle and have an impact on water quality and quantity. As many catchments in Türkiye are more or less covered with forests, applied forestry techniques are one of the most important tools that can contribute to achieving optimal water production goals. As a result, vegetation management is a concept that has recently been emphasized for the sustainability of water resources. One of the key issues faced by forest managers is to adjust their contribution to water resources and ecosystem functioning while also trying to maximize the multiple benefits of forests. In order to achieve this, policies guided by understanding forest and water interactions, and promoting capacity building on forest hydrology, should be implemented. Debates regarding the hydrological role of forests are ongoing. Stolton and Dudley (2007) stated that some of the benefits that are considered to be provided by forests are sometimes misjudged, and argued that, in many cases, forests don't increase the flow of water in catchments - in fact usually the opposite occurs, and they are not very effective in controlling floods. The impact of forests depends on many factors, such as age, tree species, density, soil, climate and management regime.
The topographic characteristics of catchments and forest/soil structure play a role in the quantity and quality of the water that reaches the streams, by affecting the elements of the water budget (interception, evapotranspiration, surface and subsurface flows) and the water collected through them in areas such as dams and ponds. Understanding these relationships and obtaining various data is a prerequisite for successful forest management that meets the demands for various forest services. Determining the water flow in catchments and defining the aforementioned relationships is a complex issue. Even though years have passed since various catchment studies were conducted, the interactions between different tree species and their ages, different soil types and management types and water flow have not been understood at the desired level and it is difficult to make accurate estimations (Stolton and Dudley, 2007).
As it is difficult to determine all the factors related to the hydrological function of forests in a single study, the studies documented in the literature have each addressed the subject by focusing on various specific issues. While some researchers have investigated the effect of vegetation cover and land use in different regions (Stednick, 1996; Sun et al., 2005; Huff et al., 2000; Bent, 2001; Zhang et al., 2013; Van Beusekom, 2014; Quyen et al., 2014; Roberts, 2016), others have attempted to demonstrate the effect of catchment characteristics on water yield or quality (Pilgrim et al., 1982; Price et al., 2011; Dhanya and Sajna, 2014; Meraj et al., 2015).
In order to realize an effective water policy and management, catchment processes and flow dynamics should be understood scientifically (Price, 2011). Among the many factors that affect hydrological processes, forest stands are important due to their manageability and the high human impact on their structure and distribution. The issue of how some forestry practices affect water yield under the same climatic conditions has been emphasized for more than a century in the United States of America, and studies have been carried out at the catchment scale, which is accepted as a hydrological unit (Özhan et al., 2008). Despite the important functions forests perform, the relationships between forest structure and the water cycle are not yet well understood (Wheeling, 2019). This is also valid for most regions of the world - e.g. Sun et al. (2018) pointed out that the effects of forest structure on hydrological processes in China were not fully comprehended.
Ultimately, despite the studies in the literature, general information about the factors affecting hydrological processes in catchments has not yet been compiled. Therefore, the number of regional studies must be increased. For this purpose, water yield measurements were carried out in 29 micro-catchments and data related to the attributes that were thought to influence water flow were collected. Regression models were developed to predict water flow from the unit area of the catchments in the province of Düzce, which is located in the West Black Sea Region of Türkiye.
METHODS
Study area
This study was conducted in 29 catchments located in the north and the southeast of the province of Düzce, the streams of which reach the Düzce plain. The study area is located in West Black Sea region of Türkiye, between 40°37'18" and 41°06'58" N and 30°50'14" and 31°51'13" E. The altitudes of the downstream points of the catchments varied between 520 and 1 530 m amsl (Fig. 1). The catchments were located in mountainous forest areas and generally more than 90% of the catchment areas were covered by forests. The main tree species were fir (Abies nordmanniana), beech (Fagus orientalis) and oak (Quercus sp.). The oaks were located in lowlands, while the beech and fir were located in uplands. Scotch pine (Pinus sylvestris) were also present in the uplands.
The average annual precipitation in Düzce is 818.4 mm, with most of it falling in October and March. The average annual temperature is 13.2°C. The coldest month of the year is January with a mean temperature of 3.9°C, while the hottest month is July with a mean temperature of 22.6°C (Yavuz, 2013).
Characteristics of the catchments
Catchment characteristics are various formal, spatial and hydrological features of catchments, such as elevation, slope, drainage density, stream frequency, that affect the water yield. Zengin et al. (2017) calculated the form factor (F), drainage density (Dd), circularity ratio (Rc), elongation ratio (Re), elevation and slope of the catchments in their study area by using geographic information systems and various equations. The values they determined in order to examine effects on water yield, interactively with other above/below-ground spatial attributes, were also used in this study. The area of the catchments ranges from 8.6-449.3 ha, with most <75 ha. The circularity ratios of the catchments were from 0.4-0.9, while their elongation ratios varied from 0.23-0.50. Form factors were between 0.3 and 1.0, while the drainage densities range from 2.3-5.5. The average slopes of the catchments are 30-55%.
Forest structure
To determine the relationship between forest structure and water yield of the catchments, various structural features of the stands, such as volume, basal area, and tree density, were recorded by a survey. Although the forests covering the catchments were broadly grouped as coniferous, broadleaved, or mixed, these groups consisted of different stands, classified according to the degree of closure, age or diameter at breast height of the trees. In most of the catchments, mixed stands (17) and broadleaved stands (10) were dominant.
In order to analyse the relationship between the dynamic characteristics of the forest and the water yield, these characteristics had to be determined on a catchment basis. With the field survey, these variables were determined for stands in the catchments, and then average values obtained for each catchment based on these stands. As the area of each stand was different, the average volume, basal area and tree density for each catchment were calculated using weighted averages based on stand area. Tree volume ranged from 188-935 m3-ha-1 in all catchments, while basal area was found to be 21-68 m2-ha-1. Tree densities were between 188 and 1 446 individuals-ha-1.
Ground cover and litter
In order to determine the effect on water yield, the thickness (cm) and weight (kg-ha-1ha-1) of the litter cover in each catchment, and the average height, number and percentage cover of the herbaceous strata were determined. The leaves, decaying vegetation and humus in an area of 50 cm x 50 cm were collected and taken to the laboratory in order to determine the weight of the litter layer. In addition, litter thickness was determined at 5 randomly selected points in the sample plot. The ground cover was divided into four groups - long sapling, short sapling, shrub and herb - and their values on a stand and catchment basis were calculated separately based on percentage cover and height. Saplings taller than 1.30 m were grouped as long, while those >1.30 m were grouped as short. Woody species, in particular Rhododendron ponticum found under beech forests and Rubus sp. in some areas, were evaluated as shrubs and their average length and soil coverage in the sample areas were determined.
Saplings, shrub and herb layers and other features such as litter weight and thickness did not show a homogeneous distribution in the catchments. While long saplings were almost nonexistent in some catchments (for example 6 individuals-ha-1 in catchment no. 7), it was higher than 1 000 in some catchments (1 671 individuals-ha-1 in catchment no. 11). Therefore, these values, which were thought to influence the amount of water reaching the streams, were determined separately for each catchment.
The shrub layer reached an average height of more than 1 m in some of the catchments (Fig. 2). Rubus sp. and Rhododendron ponticum were the most common species in terms of shrubs. Ferns (Pteridium sp.) determined to be part of the herbaceous layer were found to be more than 1 m tall in some stands. The percentage cover of the shrub layer reached 80% in some catchments, while the herbaceous layer reached a percentage cover of approximately 60%. Litter thickness was found to vary between 2 and 4.8 cm, while litter weights varied from 1 500-7 678 kg-ha-1.
Soil characteristics
In terms of soil characteristics, soil texture, soil depth, soil permeability, water-holding capacity, bulk density, particle density and porosity were determined. For this purpose, at least one soil pit was dug for each stand type in the catchments: a soil sample was taken with a shovel from the upper (0-20 cm) soil layer and an intact core soil sample was taken from the lower (20-40 cm) soil layer.
The sand content was generally higher than 50% in both the upper and lower soil layers of the catchments. The soils are sandy-loam or sandy-clay-loam. The upper soil bulk density in the catchments varied from 0.8-1.5 g-cm-3, while the lower soil bulk density varied from 0.9-1.8 g-cm-3. In some catchments, as in Catchments 2, 3 and 4, the upper soil porosity was above 60%, while in others, like Catchments 16, 17 and 27, it was lower than 30%. Although its porosity was low, the water-holding capacities of the subsoil varied from 10-60%, while it varied from 15-54% for topsoil. The highest water-holding capacity in the subsoil was observed in Catchment 1, with a value higher than 40%, while the lowest was determined in Catchment 17 at 11.4%. In Catchments, 1-4, topsoil permeability was relatively high, with values higher than 400 mm-h-1 observed. However, in Catchment 16 it was only approx. 5 mm-h-1. The subsoil permeability was also lowest in Catchment 16, at 1.6 mm-h-1.
Water level measurements
The water levels were measured over a 2-yr period in square or rectangular culverts located at the outlets of the catchments. The water level recorders were placed inside metal cylinders for protection. In order to calculate the water flow rates, water velocities were measured at 15-day intervals with the help of a small flow meter at 3 different points of the culvert section. These measurements were used to determine the level-flow relationship. Using these equations, the water yields for each catchment were calculated monthly and then annually. When the 2-yr average water yields were examined, it was observed that the highest water yield of 2 795 732 m3-yr-1 was determined in Catchment 16, which had the largest area (449.3 ha). The minimum water yield of 30 446 m3-yr-1 was observed in Catchment 3, one of the smallest catchments at 12.8 ha (Table 1).
While the water yields in the first year (December 2014-November 2015) generally reached the highest level in April-May, the water yields in the second year (December 2015-November 2016) generally reached the highest level in February. The annual total precipitation in the first year was higher in all catchments compared to the second year. Some catchments dried out towards the end of summer and early autumn, while the water level in some catchments increased after July due to precipitation.
Data analysis
By evaluating the data initially on a the sample plot basis and then in terms of unit area (ha), data related to forest structure were obtained for different layers (tree, sapling, shrub, herb, litter) to use in the statistical analysis. The average values for the catchments were determined by evaluating the sample areas in each catchment. Observations on stream flow were made for 29 basins over 2 years and a total of 58 observations were obtained. The data for the tree and soil layer were obtained by the survey conducted once in the middle of the study period.
The relationships between water flow and environmental (catchment, forest and soil) variables were determined by multiple linear regression analysis. In these analyses, water flow of the catchments was considered as the dependent (response) variable, while catchment, forest and soil characteristics were considered as the independent variables (predictors). A randomly selected sample of 70% of 58 observation points were used to obtain a model (training data) and the remaining 30% were used to analyse the validity (test data) of the model obtained.
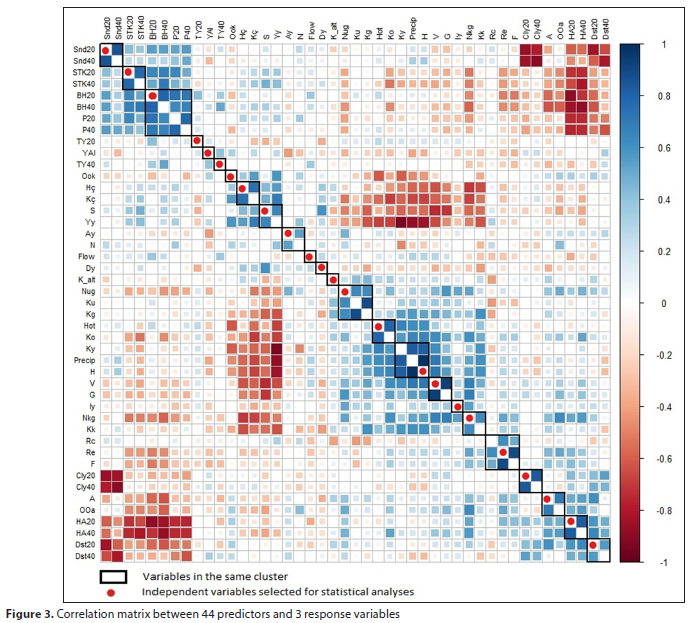
The number of candidate variables included in the model was first reduced by removing highly correlated variables. These environmental variables (predictors) were hierarchically clustered using Pearson correlations with the corrplot package (Wei and Simko, 2017) in the R statistical software (R Core Team, 2021). In clustering, the hclust algorithm and ward.D as the distance method was used. To avoid problems arising from predictor collinearity, we retained only one of the predictors in a cluster for modelling purposes. As a result, a subset consisting of 23 variables was used (Fig. 3, Table 2).
Ultimately, a total of 7 models for estimating water flow were built and examined. The all-subsets regression approach shows only the variables which are suited to enter the model based on Mallows' Cp. We entered these variables and run the model for regression analysis to get the statistical performance values. A backward stepwise approach was then used to simplify the base linear model and step-by-step variables with low impact were excluded from the analysis. An evaluation regarding whether there was autocorrelation among the independent variables was done using the Durbin-Watson test. VIF and tolerance values were checked for multicollinearity among the variables and to get generalizable models.
Initially, multiple regression analysis was performed with 23 variables, and non-significant variables were removed from the models at the 0.05 significance level. In this way, a basic model was created with 12 variables for flow. In determining the potential variables to include in different models, the all-subsets regression method was first used, but models in which the individual contributions of the variables were non-significant were not included.
RESULTS
The effects of forest, soil and catchment characteristics on stream flows, runoff coefficient and water yield were examined, and the regression models were built by evaluating all the variables that were thought to be effective as predictors. There are 12 predictors in the base model (Model 1) to estimate streamflow. Area (A), drainage density (Dy), percentage of coniferous stand areas in the catchment (Iy), tree volume per ha (V), leaf area index (YAI), number of short saplings per ha (Nkg), height of the shrub layer (Ηç), topsoil sand rate (Snd20), topsoil clay rate (Cly20), topsoil bulk density (HA20), topsoil particle density (TY20) and topsoil porosity (BH20) are significant variables for predicting flow (Table 3). One can use the B values in Table 3 to build an explicit model; statistical performance values can be found in the other rows. The p-value for all 12 variables is less than a significance level of0.01 and these variables account for 82% ofthe variability in flow. The model predicts streamflow with a percentage error of 18%.
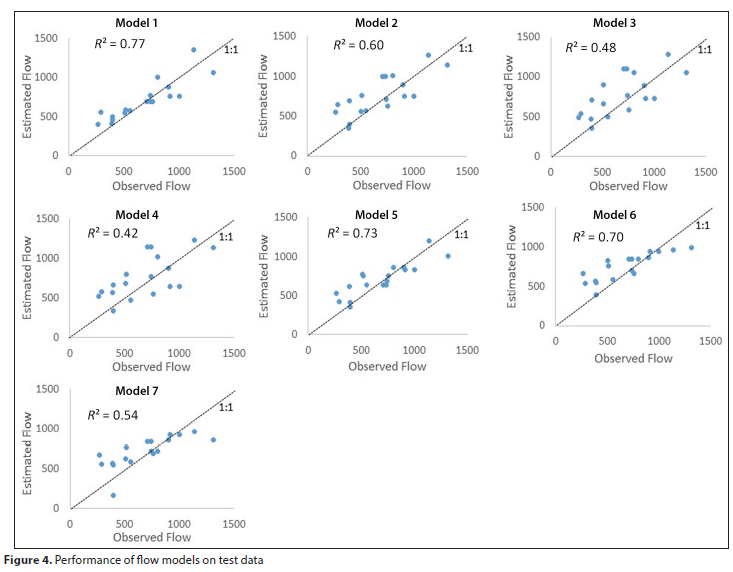
When the model was applied to test data an adjusted R2 value of 0.77 was obtained and percentage error was 0.20. The Durbin-Watson value of Model 1 was 1.98, which is close to 2, and shows that the assumption that the residual terms are uncorrelated has almost certainly been met. However, all of the metrics mentioned are suitable for Model 1 but we eliminated some variables to meet regression assumptions. Unfortunately, the VIF value, at 14.7, is substantially greater than 1 and shows the regression may be biased.
Model 2 was obtained by removing the YAI and Cly20 variables in Model 1. Both the model as a whole (p < 0.001) and the variables entered in the model are significant (p < 0.05). With the exclusion of the two variables, the value of adjR2 decreased in Model 2 and the remaining variables could explain 73% of the variability in the flow. As in Model 1, the VIF value is still greater than 10, which indicates that there may be multicollinearity between the variables and the b coefficients cannot be trusted.
Model 3 is obtained by removing the TY20 variable in Model 2. All variables and the model as a whole are significant. This model's adj^2 value is 0.69, and the model predicts streamflow with a percentage error of 24%. The average VIF value is less than 10 and the Durbin-Watson value is 2.08. This means that there is no autocorrelation and collinearity between model variables. In detailed analysis, it was observed that tolerance values of all independent variables were greater than 0.1. However, tolerance values, at less than 0.2 of Nkg, HA20 and BH20, indicate a potential problem. Model 3's success in predicting test data was also very low. While the model can explain 48% of the variability in flow in test data, it predicts flow with a percentage error of 33%.
Model 4 was obtained by removing the BH20 variable from Model 3. In this way, a model was created in which the variables were significant and the adj.R2 value was obtained as 0.65. The success of the model's flow estimation from the test data is low; the adj.R2 value in this case is 0.42 and the percentage error is 36%. Despite this, the average of VIF and Durbin-Watson values are within the limits required for assumptions to be accepted; tolerance values of independent variables are above 0.2 except Nkg (0.123).
Model 5 was obtained by removing the H and HA20 variables in Model 4 and adding the YAI variable. The model is significant as a whole (p < 0.001) and all variables except YAI (p < 0.05) are also significant at p < 0.01. For Model 5 the VIF values are well below 10 and average VIF value (1.74) is very close to 1. Also the tolerance statistics are all well above 0.2. Based on these measures it can be safely concluded that there is no multicollinearity within the data. AdjR2 value of the model is 0.63 and the model predicts flow with a percentage error of 26%.
Interestingly, performance of Model 5 on test data is better and the variables in Model 5 account for 73% of the variability in flow by predicting flow with a percentage error of 23% (Fig. 4).
Model 6 was obtained by removing variable YAI from Model 5. In this way, the adjR2 value was decreased to 0.58, but despite this the percentage error (27%) was not increased much. All variables in the model make a significant contribution (p < 0,05) to predict flows. Furthermore, for Model 6 the VIF values are well below 10 and average VIF value (1.74) is very close to 1. Also the tolerance statistics are all well above 0.2. Overall, based on these measures it can be safely concluded that there is no multicollinearity within the data. On the other hand, performance of Model 6 on test data was not as good as Model 5. Model 7 has an adjR2 value of 0.53 and percentage error of 29%. In this model, the indicators of VIF (1.65) and D-W (2.31) are within the thresholds to meet the assumptions of linear regression. Despite this, as with the training data, success of Model 7 in predicting flow from test data is not very high in terms of ^2_pre (0.54) and percentage error (29%).
DISCUSSION
A total of 7 models to estimate water flows were created and examined with measurements made in a humid climatic region of Türkiye. All of these models are statistically significant (p < 0.001), as are the variables and constant terms in the models (p < 0.05). As the number of variables in the models increase, the degree of explanation of the variation in the dependent variable generally increases. Accordingly, different models may be preferred according to data availability in practice. However, it is also necessary to evaluate the percentage error of the models alongside adjR2, the level of success in estimating from the test data, and the regression assumptions provided. For example, although the criteria values for model fitting and testing are good for Model 1, the high VIF value indicates that there may be errors in the estimations and it is necessary to act cautiously.
Although the adjR2 values for Model 1 and Model 2 related to flow are high, both contain a large number of variables and high VIF values can create a limitation to application. Model 3 and Model 4 also have high percentage errors in estimating test data, and adjR2 values are relatively low. Model 5 with the best performance indicators can be recommended for flow estimation as follows:
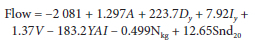
Similarly, by using the B values (coefficients in the model) in Table 3, one can obtain the open type of the other models. In Model 5, 63% of the variability in the flow could be explained with 7 variables. The success of this model in estimating test data is also quite high (adjR2 = 0.73; percentage error = 23%). Variables for catchment characteristics (A, Dy), stand (Iy, V, YAI and Nkg) and soil (Snd20) attributes are included in Model 5. Although the regression coefficient of Nkg was negative in the obtained equation, it was seen that the correlation values between area (A) and conifer percentage (Iy) with flow were also negative. The correlation value between the tree volume per ha and flow per ha is positive. This is one of the most interesting results of the present study. This means that the catchments with higher tree volumes were superior to the others in terms of flows. This study was not designed to intervene in the tree layer in order to compare the catchments with a control catchment, such as in paired catchment treatments, but it compared 29 catchments with different stand parameters, such as tree volume per hectare. In a paired catchment treatment, it is not possible to evaluate the correlations between the predictors and flow. One tries to find catchments that are as similar as possible in terms of precipitation, catchment characteristics, tree species, etc., and the effect of the changes in forest structure, like basal area or volume reduction with thinning, on flow is evaluated. In order to try more treatments, more than two similar catchments are needed. Finding similar catchments is generally a constraint or limiting factor to realize the study and the requirement for a calibration period causes the results to be obtained over a longer time period.
Generally, it is thought that removing stems via timber harvests and altering the standing stock of forests reduces transpiration and interception, resulting in an increase in water yield (Douglass, 1983; Troendle and King, 1985). Trimble (1963) reported that increases in water yields were roughly proportional to the amount of timber removed. Filoso et al. (2017) found that in approximately 80% of all cases they evaluated regarding annual water yields, the effect of forest restoration and other forms of forest cover expansion was negative (i.e., water yield decreased), while the effect was positive in 6%, unchanged in 7%, mixed in 5% and unclear in 2%. Andréassian (2004) determined that although forest alteration is always immediately followed by a period of water yield increase, the subsequent recovery period (forest regrowth) may or may not be characterized by a decrease in water yield. This can be due to the fact that, despite having higher tree volumes, mature or old stands consume less water by transpiration, which was also valid in the present study. Here also the cause-effect relationship can be considered in two ways and it can be interpreted that the stands develop better and reach high volumes where the flow is high. Since the catchments studied are all close to each other and receive similar precipitation, and the volume of the stands in the area is controlled by management, it is more logical to interpret the results as inferring that high stand volumes result in higher flows.
The amount of water flow and % herbaceous cover in the area was also found to be positively related, whereas it was negatively related to sapling and shrub percentages. The number of saplings was quite high in the fir and fir-dominated mixed stands that form mixed-aged and vertical stratified structures. This situation can also make a contribution to the negative correlation between flow and percentage of coniferous stands in the catchment. As a matter of fact, ferns stood out in the areas where the percentage of herbaceous cover is high and this was an indicator of humid sites. Özyuvaci et al. (2004) conducted an experiment with a selective cutting treatment to alter the basal area of a forest by 11% and found that after an increase the streamflow decreased with the growing vegetation. A forest that is not dense but whose crown closure allows light to penetrate to the ground, allowing only the grass and forb layer to grow and not shrubs and other woody species, is thought to be suitable to increase stream flow. Beyond this, decreasing the crown closure also results in a decrease in water flow by enabling the shrubs or saplings to grow denser in the area, or can result in more sunlight reaching the soil which will affect the evapotranspiration conditions.
Soil properties also have a large effect on the water yield of the catchments, in terms of the amount of flow per unit area. The number of subsoil properties that affect water yield is greater than for the topsoil. In general, because subsoil properties were found to be highly correlated with topsoil properties, subsoil variables, which are more difficult to measure, were not included in the models. The increase in the sand content in the topsoil (Snd20) makes a positive contribution to the water flow and this generally took place in all of the models.
Using the suggested model (Model 5), water managers or specialists dealing with forest management and planning can estimate the water yield of catchments. Of course, theoretically it is not possible to change catchment characteristics or soil properties, whereas they can manage the stand volumes to influence water yield. However, although the catchment and soil characteristics are not manageable, they can be used to determine how suitable the catchments are for water production. In a multiple-use system, sometimes it is not possible to provide more than one ecosystem service from the same area, and separation of uses via zoning may be necessary. In a circumstance like this, there is also a need to assess the priority of ecosystem services or the suitability of catchments for different ecosystem services. It is not possible to increase land or forest areas proportional to human population and multiple-use management of forests will become invaluable in the near future. The models suggested in this context will assist in such cases.
Since the amount of flow was explained by many variables in the models, the practical usage or advantage of models can be interpreted as limited. Sometimes it may not be possible to use a model consisting of such variables as it can be difficult, time-consuming or expensive to obtain the value of the independent variables for catchments. For this reason, we suggested more than one model. Although the performance of Model 6 and Model 7 is lower than Model 5, they can be used depending on the data available. In our analysis, models with less than 5 variables can only explain the variability of flows with a R2 value of less than 50%, which is why we have not provided them here.. While the variables in our models can be gathered by a special survey, they also can be obtained from some literature or some GIS techniques, or even using some assumptions.
In forestry, the term 'site index' is used to indicate the productivity of an area in terms of wood production. The better the site index is, the better the trees develop there, and reach larger volumes. Of course, the growth of trees depends on many factors, such as climate, topography and soil characteristics, but all these factors are expressed within the single term of site index. In terms of water production, a similar site index approach could be developed as a collective indicator of catchment and soil properties or other factors. In this way, models can be expressed with fewer variables, but more work is needed at the theoretical and practical level to enable this.
CONCLUSION
Understanding the relationships between flows and the variables affecting flow is a prerequisite for successful and sustainable management of forests and attaining optimal benefits from water resources. In this study we analysed the effect of many variables, including topography, forest stands, above-ground and soil, and presented some equations as regression models to be able to estimate flows. Based on the data on hand, researchers can select a suitable model. Because of their manageable nature, relations with the variables relating to stand structure were especially sought, and models involving tree volume per hectare were generated. One of the most interesting results and one that was counter to that documented in the general literature, was the positive correlation determined between tree volume and water flow. This suggests a strategy of growing larger/older trees in the catchments is advantageous to increase water yield. In addition, attention must be given to not decreasing crown closure, in order to prevent the growth of shrubs. An attempt was made to predict various features of the hydrological cycle by generating equations in the form of regression models. These models contain many variables but can be easily used in estimates if they are formulated through a comprehensive ecosystem survey. Although these models are useful for both water resource management and also for forest management, they need to be regionally developed, tested or calibrated.
ACKNOWLEDGEMENTS
This work was supported by the Scientific and Technological Research Council of Türkiye (TUBITAK, Project ID: TOVAG-213O199). The authors would also like to thank the Directors of Duzce Forest Enterprise for their collaboration on the field studies.
CONFLICTS OF INTEREST/COMPETING INTERESTS
The authors declare that they have no known competing or conflicts of interests.
AVAILABILITY OF DATA AND MATERIAL
The data that support the findings of this study are available from the corresponding author upon request.
AUTHOR CONTRIBUTIONS
All authors equally contributed to the manuscript.
ORCIDS
Hayati Zengin: https://orcid.org/0000-0002-6679-0063
Mehmet Özcan: https://orcid.org/0000-0002-0994-4679
Ahmet Salih Degermenci: https://orcid.org/0000-0002-3866-0878
Tarik Citgez: https://orcid.org/0000-0002-0303-5263
REFERENCES
ANDRÉASSIAN V (2004) Waters and forests: from historical controversy to scientific debate. J. Hydrol. 291 1-27. https://doi.org/10.1016/j.jhydrol.2003.12.015 [ Links ]
BENT GC (2001) Effects of forest-management activities on runoff components and ground-water recharge to Quabbin reservoir, Central Massachusetts. For. Ecol. Manage. 143 115-129. https://doi.org/10.1016/S0378-1127(00)00511-9 [ Links ]
DHANYA V and SAJNA AN (2014) Water yield variation as linked to catchment parameters: a biophysical analysis for Kerala, India. Int. J. Environ. Sci. 4 (5) 641-652. https://doi.org/10.6088/ijes.2014040404504 [ Links ]
DOUGLASS JE (1983) The potential for water yield augmentation from forest management in the eastern United States. Water Resour. Bull. 19 351-358. https://doi.org/10.1111/j.1752-1688.1983.tb04592.x [ Links ]
FILOSO S, BEZERRA MO, WEISS KCB and PALMER MA (2017) Impacts of forest restoration on water yield: a systematic review. PLoS ONE 12 (8) e0183210. https://doi.org/10.1371/journal.pone.0183210. [ Links ]
HUFF D, HARGROVE B, THARP B and GRAHAM R (2000) Managing forests for water yield: the importance of scale. J. For. 98 (12) 15-19. https://doi.org/10.1093/jof/98.12.15 [ Links ]
MERAJ G, ROMSHOO SA, YOUSUF A, ALTAF S and ALTAF F (2015) Assessing the influence of watershed characteristics on the flood vulnerability of Jhelum Watershed in Kashmir Himalaya. Nat. Hazards 77 (1) 153-175. https://doi.org/10.1007/s11069-015-1605-1 [ Links ]
ÖZHAN S, HIZAL A, SENGONUL K, GOKBULAK F, SERENGIL Y and OZCAN M. (2008). Hydrological and hydrochemical modelling of watershed systems in Belgrad Forest. Unpublished research project report supported by the Scientific and Technological Research Council of Turkey (TUBITAK). Grant No. TOVAG - 105 0182. [ Links ]
ÖZYUVACI N, ÖZHAN S, GÖKBULAK F, SERENGIL Y and BALCI AN (2004) Effect of selective cutting on streamflow in an oak-beech forest ecosystem. Water Resour. Manage. 18 (3) 249-262. https://doi.org/10.1023/B:WARM.0000043165.87113.8d [ Links ]
PILGRIM DH, CORDERY I and BARON BC (1982) Effects of catchment size on runoff relationships. J. Hydrol. 58 (3-4) 205-221. https://doi.org/10.1016/0022-1694(82)90035-X [ Links ]
PRICE K, JACKSON CR, PARKER AJ REITAN T, DOWD J and CYTERSKI M (2011) Effects of watershed land use and geomorph-ology on stream low flows during severe drought conditions in the Southern Blue Ridge Mountains, Georgia and North Carolina, United States. Water Resour. Res. 47 (W02516) 1-19. https://doi.org/10.1029/2010WR009340 [ Links ]
PRICE K (2011) Effects of watershed topography, soils, land use, and climate on baseflow hydrology: A review. Prog. Phys. Geogr. 35 (4) 465-492. https://doi.org/10.1177/0309133311402714 [ Links ]
QUYEN NTN, LIEM QN and LOI NK (2014) Effect of land use change on water discharge in Srepok Watershed, Central Highland, Vietnam. Int. Soil Water Conserv. Res. 2 (3) 74-86. https://doi.org/10.1016/S2095-6339(15)30025-3 [ Links ]
R CORE TEAM (2021) R: A language and environment for statistical computing. R Foundation for Statistical Computing, Vienna. URL: https://www.R-project.org/ [ Links ]
ROBERTS AD (2016) The effects of current landscape configuration on streamflow within selected small watersheds of the Atlanta metropolitan region. J. Hydrol. Reg. Stud. 5 276-292. https://doi.org/10.1016/j.ejrh.2015.11.002 [ Links ]
STEDNICK JD (1996) Monitoring the effects of timber harvest on annual water yield. J. Hydrol. 176 (1-4) 79-95. https://doi.org/10.1016/0022-1694(95)02780-7 [ Links ]
STOLTON S and DUDLEY N (2007) Managing forests for cleaner water for urban populations. Unasylva 58 (229)39-43. [ Links ]
SUN G, MCNULTY SG, LU J, AMATYA DM, LIANG Y and KOLKA RK (2005) Regional annual water yield from forest lands and its response to potential deforestation across the Southeastern United States. J. Hydrol. 308 258-268. https://doi:10.1016/j.jhydro1.2004.11.02 [ Links ]
SUN J, XINXIAO Y, HENIAN W, GUODONG J, YANG Z, ZHIHUA T, WENPING D, JIANBO J and JUNGANG C (2018) Effects of forest structure on hydrological processes in China. J. Hydrol. 561 187-199. https://doi.org/10.1016/j.jhydrol.2018.04.003 [ Links ]
WEI T and SIMKO V (2017) R package "corrplot": Visualization of a Correlation Matrix (Version 0.84). URL: https://github.com/taiyun/corrplot [ Links ]
TRIMBLE GR, REINHART KG and HENRY H (1963) Webster, cutting the forest to increase water yields. J. For. 61 (9) 635-640. https://doi.org/10.1093/jof/6L9.635 [ Links ]
TROENDLE CA and KING RM (1985) The effect of timber harvest on the Fool Creek Watershed, 30 years later. Water Resour. Res. 21 (12) 1915-1922. https://doi.org/10.1029/WR021i012p01915 [ Links ]
VAN BEUSEKOM AE, HAY LE, VIGER RJ, GOULD WA, COLLAZO JA and KHALYANI AH (2014) The effects of changing land cover on streamflow simulation in Puerto Rico. J. Am. Water Resour. Ass. 50 (6) 1575-1593. https://doi.org/10.1111/jawr.12227 [ Links ]
WHEELING K (2019) How forest structure influences the water cycle. Eos 100. https://doi.org/10.1029/2019EO134709 [ Links ]
YAVUZ R (2013) Fertilizer and herbicide applications for rangeland rehabilitation (Düzce Köprübaji Ömerefendi case study). Dissertation, Duzce University. [ Links ]
ZENGIN H, ÖZCAN M, DEGERMENCI AS and CITGEZ T (2017) Effects of some watershed characteristics on water yield in the West Black Sea Region of northern Turkey. Bosque 38 (3) 479-486. https://doi.org/10.4067/S0717-92002017000300005 [ Links ]
ZHANG G, GUHATHAKURTA S, DAI G, WU L and YAN L (2013) The control of land-use patterns for storm water management at multiple spatial scales. Environ. Manage. 51 (3) 555-570. https://doi.org/10.1007/s00267-012-0004-6 [ Links ]
 Correspondence:
Hayati Zengin
Email: hayatizengin@duzce.edu.tr
Received: 8 June 2022
Accepted: 19 June 2023

