


Services on Demand
Article
 English (pdf)
 Article in xml format
 Article references
Indicators

Related links
-
 Cited by Google
 -
 Similars in Google
Share

 Permalink
Water SA
On-line version ISSN 1816-7950
Print version ISSN 0378-4738
Water SA vol.49 n.3 Pretoria Jul. 2023
http://dx.doi.org/10.17159/wsa/2023.v49.i3.3964
RESEARCH PAPER
An evaluation of three evapotranspiration models to determine water fluxes over hillslopes encroached by invasive alien plants in Eastern Cape Province, South Africa
Anthony PalmerI; Craig WeidemanI; Heidi-Jane HawkinsII, III; Perushan RajahII; Tawanda MarandureIV; Cletos MapiyeV; Lianhai WuVI; Onalenna GwateVII; James BennettIV
IInstitute for Water Research, Rhodes University, PO Box 94, Makhanda 6140, South Africa
IIConservation South Africa, 301 Heritage House, Claremont 7375, South Africa
IIIDepartment of Biological Sciences, University of Cape Town, Private Bag X3, Rondebosch 7701, South Africa
IVCentre for Agroecology, Water and Resilience (CAWR), Coventry University, Ryton Gardens, Wolston Lane, Coventry, CV8 3LG, United Kingdom
VDepartmentof Animal Sciences, Stellenbosch University, P. Bag X1, Matieland 7602, South Africa
VISustainable Agriculture Sciences, Rothamsted Research, North Wyke, Okehampton, Devon EX20 2SB, United Kingdom
VIIAfromontane Research Unit, University of the Free State, QwaQwa Campus, Phuthaditjhaba 9866, Free State, South Africa
ABSTRACT
Ecosystem services in the South African grassland biome are being impacted by the presence of invasive alien plants (IAPs), particularly from the Australian genus Acacia. IAPs have elevated landscape water use and determining water fluxes is crucial to defining suitable interventions. This study evaluates three models of water flux over IAP-invaded grassland against evapotranspiration (ET) measured by a large-aperture scintillometer (LAS). ET was modelled using an energy balance model (MEDRUSH), a biophysical model (Penman-Monteith-Leuning (PML)) and a remotely sensed product (MOD16), and their results compared with ET measured by the LAS. ETLAS was measured during an abbreviated field campaign in November 2019 over a dense silver wattle (A. dealbata) stand associated with hillslope seeps. Of the three models tested against the LAS campaign, MEDRUSH performed well-enough to be used to model ET over the continuous scientific-grade micro-meteorological record (315 days). We used MEDRUSH to model ET over the invaded hillslope seeps and compared this with the expected ET that would occur over the adjacent, un-invaded grassland. Total ET over the IAP-invaded area was approximately 536 mm (60% of reference ET) as compared with the grassland (202 mm), showing that woody encroachment significantly increases landscape water use. To estimate the local impact of this, we used earth observation to determine the area of woody invasion in a 2 664 km2 regional window. Approximately 10% (274 km2) of this window was invaded by IAPs and, assuming the geographic window was representative of all the areas invaded by wattle, this represents ~ 89 000 ML of water used annually by the IAPs. Removal of wattle, followed by suitable restoration of landscape functionality, would greatly enhance rangeland productivity and water production from hillslope seeps.
Keywords: water fluxes, Penman-Monteith-Leuning, MEDRUSH, MOD16
INTRODUCTION
Terrestrial biomes are strongly linked to climatic factors, soil types, land-form and disturbance regimes. Plant functional types interact with soil and climate to give each biome a unique set of climatic conditions with respect to the nature and strength of the interactions with the atmosphere. South Africa's grassland biome can be distinguished from the other biomes by the presence of a strong summer seasonality in precipitation, low base status soils, the prevalence of frost from April to September, and the regular occurrence of fires (Mucina et al., 2006). The biome has also experienced invasion by several woody invasive alien plants (IAPs), with two Australian wattle species (Acacia mearnsii and A. dealbata) representing the greatest threat. A. dealbata is particularly successful at invading the hillslope seeps associated with the sandstone beds of the Karoo Supergroup (Johnson et al., 1996). Invasion is accompanied by a decrease in biodiversity under the wattle canopy and a reduction in grass production, as only a few shade-tolerant, C3 grasses are able to survive (Gwate et al., 2016). The presence of wattle along these seeps reduces flow from perennial springs arising from the fractured rock aquifers. As the wattle is of limited economic value and not generally consumed by livestock, there is a strong ecological and political agenda within South Africa (Turpie et al., 2008) to clear-fell the wattle and restore the grasslands.
It has been established that the removal of riparian wattle leads to significant reductions in annual evapotranspiration (ET) which in turn will enhance streamflow (Dye et al., 2001). This has been further elaborated recently in comprehensive reviews by Everson et al. (2011) and Le Maitre et al. (2020), which provided support for clearing efforts. In order to quantify the ET that woody encroachment by invasive alien plant (IAPs) accounts for in South Africa, several different direct and indirect approaches have been used to measure or estimate ET over fynbos, grassland and woodland ecosystems. These include: measurement with a large-aperture scintillometer (LAS) system (Gwate et al. 2018); sap flow measurements (Scott-Shaw et al., 2017); eddy covariance (EC) systems (Gwate et al., 2019); modelling at a biome scale (Gwate et al., 2018) and the improved parsimonious single layer ET model (Penman-Monteith-Palmer (PMP) validated with LAS (Palmer et al., 2015). As it is costly and impractical to measure ET continuously, modelling is a necessary alternative.
However, it remains unclear how consistent ET comparisons are for specific ecosystems using these different modelling approaches, particularly when comparing native grasslands with and without IAPs. Furthermore, a lack of site-specific, long-term micro-meteorological data has also limited the confidence that can be placed in the ET values produced by different models.
To this end, our study compares the performance of three models when simulating ET over grassland and woodland ecosystems, with reference to an IAP-invaded area of grassland in Eastern Cape Province, South Africa, where long-term micro-meteorological data were available for 95% of a hydrological year. These are the MEDRUSH model (Osborne and Woodward, 1999), the MOD16 product (Mu et al., 2013) and the Penman-Monteith-Leuning (PML) model (Leuning et al., 2008). In each case, the output of these models is compared with ground measurements made using a LAS. Outputs from the best-performing model then enabled us to estimate total annual water loss due to IAP invasion for a defined area of the study site.
The aims of this study were:
• To identify the most appropriate model for estimating evap-otranspiration from IAP-invaded rangeland by comparing the model output to the results from an abbreviated LAS field campaign
• To use the selected model to calculate ET over the invaded area and the adjacent grasslands and settlements using meteorological data from a 315-day dataset
• To determine, with the aid of earth observation, the area of land invaded by IAPs within a defined area of the study site
• To estimate the total water loss resulting from the invasion of IAPs
MATERIAL AND METHODS
Study area
The study area is located within Nkasela, a rural village approximately 20 km north of Matatiele, Eastern Cape Province (30.20°S; 28.77°E). The dominant vegetation is East Griqualand Grassland and is mainly restricted to foothills of the Drakensberg mountain range. Geology comprises sedimentary mudstones and sandstones of the Beaufort Group of the Karoo Supergroup, with rocks of the Molteno, Elliot and Clarens Formations also occasionally present. The dominant soils on the sedimentary parent material are well drained, with a depth of 500-800 mm and clay content from 15-55%. The region experiences mostly summer rainfall, with mean annual precipitation of 700 mm, ranging from 620-816 mm. Kokstad (-30.51°S; 29.41°E), the nearest long-term automatic weather station (AWS), records 88 rain days in a year and only 3 of those occur in the midwinter (June-July). Both mist and snow occur infrequently (Kokstad 26 misty days per year) and much of the rain comes in the form of thunderstorms (Kokstad 45 days). Mean annual temperature is 15°C. Moderately severe frosts occur 30 days in a year. Mean annual reference ET (FAO56 ETo) derived from the Kokstad AWS (15 years of complete data) is 1 150 mm.
The grassland biome has a rich biodiversity, but has been invaded by woody species, especially black wattle (Acacia mearnsii) from planted woodlots and in the riparian zone, and silver wattle (A. dealbata) along hillslope seeps. The invasion by black wattle has occurred by spreading away from intentional plantings such as windbreaks and woodlots, with the direction of spread being worst into abandoned arable lands (Scorer et al., 2016). There has been little research on the invasion by silver wattle, with the exception of Seath and Shackleton (2022). Eye-balling of very high resolution satellite imagery of the region revealed that silver wattle was predominantly occurring along seep-lines associated with fractured rock aquifers of the sandstone layers of the Beaufort group.
Large-aperture scintillometer (LAS)
A large-aperture scintillometer (LAS MklI, Kipp & Zonen B.V., Netherlands) was installed at the site (Fig. 1) during an abbreviated field campaign from 26 November 2019 until 1 December 2019. The LAS measures the path-averaged structure parameter of the refractive index of air (C2n) over horizontal path lengths from 250 m to 4.5 km, and has a 0.149 m diameter (D) beam. The light source of the LAS MkII transmitter operates at 850 nm and the scintillations measured by the instrument are caused by turbulent temperature fluctuations. At Nkasela, a suitable stand of relatively homogenous silver wattle on a hillslope seep was identified, with a path length of 250 m. Since the path length was less than 1 km, 0.1 m aperture diameter restrictors were fitted (Kipp and Zonen, 2012). The instrumental set-up was arranged to ensure that the fetch comprised relatively homogenous vegetation, although small stretches of grass were unavoidable. A LAS measures the amount of scattering of electromagnetic radiation caused by turbulence in the atmosphere using a transmitted beam of light over a horizontal path between a transmitter and a receiver (Meijninger et al., 2002). At the receiver, the fluctuation in light intensity is analysed. These refractive index fluctuations lead to intensity variations, which are known as scintillations (Kohsiek et al., 2002; Tunick, 2003). The scintillations are caused by the fluctuations of the refractive index (n) of air along the propagation path and its magnitude can be described by the structure parameter of the refractive index of air (Cn2 ), which is the basic parameter derived from scintillometer data (Hill, 1992; Pozníková et al., 2015). The C2n nr2,3 is a representation of atmospheric turbulent strength or the ability of the atmosphere to transport scalars, such as heat, humidity and other atmospheric gases. The value of C2n in the lower atmosphere has generally been observed to range from about 10-12 to 10-17 m-2,3 (Kipp and Zonen, 2012). High values of Cn (> 10-12 m-2,3) indicate a highly unstable atmosphere, while lower values ranging from 10-16 to 10-17m-2,3 are indicative of weak and insignificant atmospheric optical turbulence over shorter (< 2 km) optical paths (Tunick, 2003). By applying the Monin-Obukhov Similarity Theory (MOST), surface flux of sensible heat (H) can be determined. Further, the latent heat (LE) flux can be derived from the surface energy balance, if ancillary meteorological data are available. For a LAS that has equal apertures, the relationship between the measured variance of the natural logarithm of intensity fluctuations OlnI2) and C2n is as follows (Kipp and Zonen, 2012).
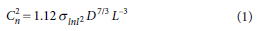
where D is the aperture diameter of the LAS, L the distance between the transmitter and the receiver (i.e. the path length).
Essentially, the accuracy of the energy fluxes from a LAS is influenced by the mean height of the LAS MklI optical beam above the surface. For flat surfaces, determining the effective LAS beam height is simple and can be derived from the transmitter and receiver heights (Kipp and Zonen, 2012). However, an ideal flat surface is rare and the Evation software program (v2.5.0.11, Kipp & Zonen B.V., Delft, Netherlands) was used to determine effective LAS beam height following Hartogensis et al. (2003). A slope profile along the path length was generated from elevation values extracted from Google Earth Pro. 20-min ET was calculated from the LAS output using Evation.
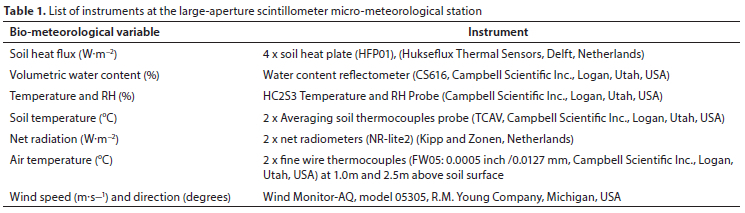
Micro-meteorological station
A micro-meteorological weather station, comprising a range of key instruments (Table 1), was installed at the Nkasela village between 4 October 2019 and 16 August 2020. This station recorded data from each instrument at 20-min intervals, resulting in 315 days of scientific-grade data. The station measured net radiation (Rn), wind speed and direction, soil heat flux, volumetric soil water content (SWC), air and soil temperature as well as relative humidity (RH). The pair of net radiometers provided a mean measure of net radiation at 2 m above the canopy, while soil heat flux was measured using 4 soil heat flux plates (Table 1). A system of parallel soil thermocouple probes measured soil temperature above the heat flux plates and the volumetric soil water content was measured in the upper 60 mm of soil using 2 sensors. The installation of heat flux plates, soil temperature thermocouples and the water content reflectometer was completed following Campbell Scientific (2002). An HC2S3 temperature and RH probe (Campbell Scientific Inc., Logan, Utah, USA) was used to measure air temperature and RH in a radiation shield. Air temperature was also measured using 2 unshielded type-E (chromel/constantan) fine-wire thermocouples (FW05) placed at heights of1 m and 2.7 m above the ground surface. Wind speed and direction were measured using an anemometer (Wind Monitor-AQ, model 05305, R.M. Young Company, Michigan, USA) located at 3.7 m above the surface.
Theory of the models trained using the LAS output
MEDRUSH model
The MEDRUSH model operates on a variable time scale depending on the input interval of the weather data and provides a mechanistic description of the movement of water and energy in an ecosystem. The model is driven by meteorological and stomatal conductance measurements to simulate fluxes over a crop or area of land.
The version of the model used in this study was originally developed by Osborne and Woodward (Osborne and Woodward, 1999) and has undergone subsequent development. The model, written in R script, uses an equation from Buck (1981), reproduced by Jones (2014), to calculate saturation vapour pressure from air temperature.
Day-time stomatal conductance (g), a required input into the model, was measured for silver wattle at 8 mmol-m-2-s-1 using a leaf porometer (Decagon Devices, US/Canada). For the grassland simulation, gs of 3 mmol-m-2-s-1 was used based on a previous study in the perennial C4 grasslands within the same geographic region (Gwate et al., 2018).
The meteorological data used by MEDRUSH include minimum and maximum temperature, relative humidity, soil temperature, wind speed and solar radiation. All data were obtained from the weather station at the site.
Penman-Monteith-Leuning (PML) model
The PML model (Leuning et al., 2008) is a biophysical model which assumes that actual ET is a combination of canopy transpiration (Ec), evaporation of intercepted water by canopy and litter (E) and soil evaporation (Es) (Morillas et al., 2013). The PMLswc model is based on the Penman-Monteith equation integrated with a leaf area index derived from earth observation (Morillas et al., 2013).
MOD16 ET model (MOD16A2)
The Moderate Resolution Imaging Spectro-radiometer (MODIS) provides global observations of the Earth's land, atmosphere and oceans in the visible and infrared regions of the spectrum. MOD16 is a MODIS global ET product that provides continuous ET datasets (both actual ET and reference ET) at 0.5 km spatial resolution and 8-day, monthly and annual temporal scale using Priestley-Taylor, Penman-Monteith and land surface model approaches (Aguilar et al., 2018; Khan et al., 2018).
MOD16 product is an operational source of ET data with adequate spatial resolution for many water resource applications, both at local and regional scales. This study used the MOD16 ET (MOD16A2.006) product (Running et al., 2015), which is available with 0.25 km2 spatial and an 8-day temporal resolution. This version uses an improved algorithm (Mu et al., 2011) which is based on the Penman-Monteith equation and estimates evaporation from soil and wet surfaces as well as transpiration from the vegetation (Aguilar et al., 2018). The improved model is distinguished by: (i) calculation of ET as the sum of daytime and night-time component; (ii) calculation of the soil heat flux; (iii) a simplified calculation of the plant cover fraction; and (iv) improved estimates of stomatal conductance, aerodynamic resistance, and resistance of the boundary layer (Aguilar et al., 2018; Mu et al., 2011).
Biophysical attributes of the study site
Leaf area index
In-situ leaf area index (LAI) was measured with an Accupar Ceptometer (Decagon Devices Inc., Pullman, Washington, USA) at 10 points directly under the wattle canopy and immediately below the beam of the LAS. Points were selected along an NDVI gradient derived from ESA Sentinel 2 pixels (10 m x 10 m), and at each point 5 readings were made with the ceptometer. Readings were taken at or around noon, when the sun was directly overhead. The PAR (photosynthetically active radiation) extension sensor for the Accupar ceptometer was used to provide continuous, above-canopy PAR, readings. The LAI was also extracted from the MODIS LAI product to provide a landscape-scale LAI.
Land area invaded by wattle
In order to determine the area of land invaded by both species of wattle in the region, we developed a land cover classification based on 8 recognisable (from aerial photography and high-resolution imagery) land cover classes. We identified a 50 km x 50 km regional window that included all the rural villages selected for the funded project. This included the research site at Nkasela and was broadly representative of the local variation in wattle density. The spectral signatures from 416 training sites, representing each of these cover classes, were extracted from Landsat 8 imagery. These signatures were used to produce a map in Google Earth Engine after applying the Random Forest classification algorithm (Ho, 1998).
Data analysis
LAS data processing
From the reference point (transmitter), a total of 4 points 50 m apart were geo-coded and their height above sea level extracted from Google Earth Pro and used to derive effective height. Further input parameters into Evation included an expression for zero-plane displacement height (Z0m) and roughness length (d) which affect the intensity of mechanical turbulence and the fluxes of sensible heat (H), latent heat (LE) and momentum above the surface. Vegetation height was measured using a Disto X310 laser distance meter (Leica-Geosystems, Germany) to derive mean canopy height. The Z0m and d were determined from the estimated canopy height (h) as 0.1 h and 0.66 h, respectively (Allen et al., 1998). Data were processed using Evation and the derived LE was converted into mm-h-1 to arrive at an estimation of water loss.
Data quality control
During processing, LAS data were controlled using several quality checks. Data were filtered for low signal (demodulated signal less than 10 mV as per requirements of EVATION software). The Bowen ratio was also used to reject positive fluxes when it was >3, since H would be far larger than LE and the latter insignificant. Any data points where the Bowen Ratio (β) was between -0.05 and 0 were removed, due to instability of the solution for this extreme value range (Rambikur and Chávez, 2014). It should be noted that over wet surfaces β is small, <0.5 and when β > 3 LE is insignificant (Bouin et al., 2012; Kipp and Zonen, 2012). In addition, when β is close to -1, i.e. (-1.25 < β <-0.75), LE and H are assumed negligible (Campbell Scientific, 2005). Positive fluxes during periods between sunset and sunrise with wind speed (u*) < 0.1 m-s-1 were also filtered out to avoid conditions with poorly developed turbulence. Periods with a temperature gradient of less than 0.2°C between the lower and upper air temperature sensors were filtered out to avoid the risk of inaccurate determination of atmospheric stability. Furthermore, the Obukhov length (LOM) was used to filter out large positive (~1 mm) fluxes on a period of absolute stability as determined by the stability parameter. The physical interpretation of LOM is that a positive value indicates stable conditions while a negative value indicates unstable convective conditions. The C2n was also used to filter out data with <10-16 m-2/3 since this is indicative of weak and insignificant atmospheric optical turbulence over shorter (<2 km) optical paths. (Tunick, 2003). In addition, the upper scintillation saturation criterion was also considered as a potential basis for rejecting fluxes (Kohsiek et al., 2002; Bouin et al., 2012).
Sensitivity analysis of PMLSWC and MEDRUSH models
The sensitivity analysis of the PMLSWC approach was focused on the aerodynamic components and LAI, while that of MEDRUSH focused on the consequences of rapid changes in wind speed. For aerodynamic components of the PMLswc model, sensitivity analysis was accomplished by varying the height of wind speed measurement and wind speed at different canopy heights through the use of a power law equation (Manwel et al., 2002) and then computing ET total. The LAI was changed from low to high values to decipher its impact on ET. Similarly, the sensitivity of the site parameters used in the MEDRUSH model was determined by varying the stomatal conductance and using temperatures at different heights and noting the effect on simulated ET.
Model evaluation
Performance of the models MEDRUSH, PMLswc and MODIS were assessed using various evaluation criteria, namely: percent bias (PBIAS), root mean squared error (RMSE), RMSE-observations standard deviation ratio (RSR) and mean absolute error (MAE) (Granata, 2019). RMSE and MAE show the level of the errors between the measured and simulated ET, while RSR technique normalizes RMSE using standard deviation of the observed. The MAE technique is appropriate for errors that are uniformly distributed, while the RMSE technique is best for evaluating normally distributed data. Average tendency of the simulated data to be larger or smaller than measured was assessed using PBIAS. Lastly, coefficient of determination (R2) was used to assess the extent of collinearity between measured and simulated ET.
RESULTS AND DISCUSSION
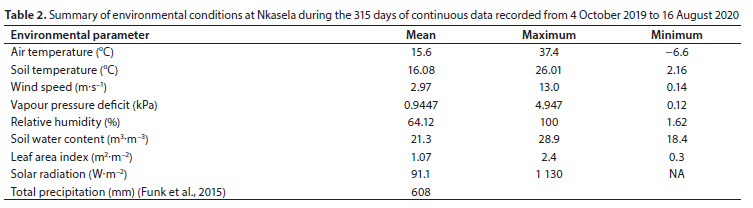
Environmental conditions
Average daily environmental conditions during the study period are provided (Table 2). SWC ranged from 18.4 to 28.9% and maximum daily solar radiation reached 1 130 W-m-2 on 5 February 2020, during the peak of the summer season. RH, VPD and wind speed ranged from 1.62-100%, 0.14-4.947 kPa and 0.12-13 m-s-1, respectively. Reference ET (calculated using the FAO56 (Allen et al., 1998)) ranged from 0.47-5.31 mm-day-1 for the study period.
Leafarea index
For the purposes of modelling, a fixed LAI, based on that recorded in the field using the ceptometer of 3.2 was used in the PMLswc model. The mean Sentinel 2 NDVI for the fetch below the LAS beam on 23 November 2019 was 0.6.
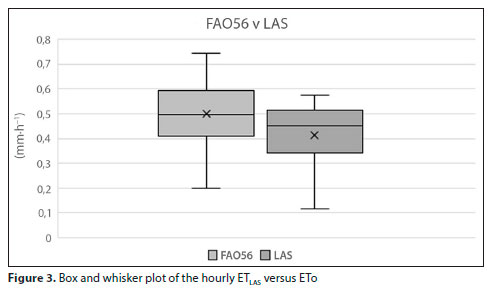
Comparison of the models
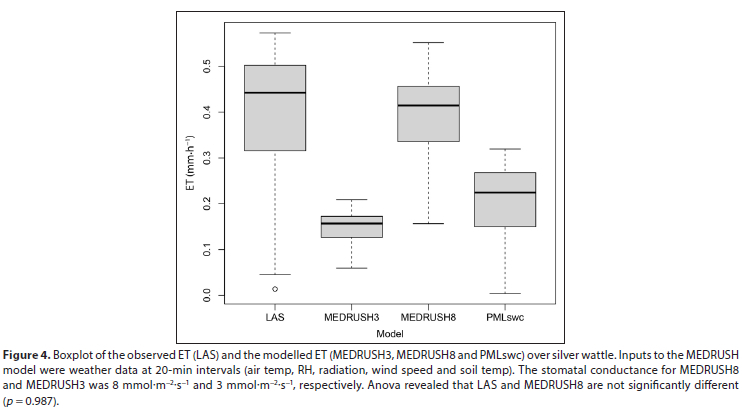
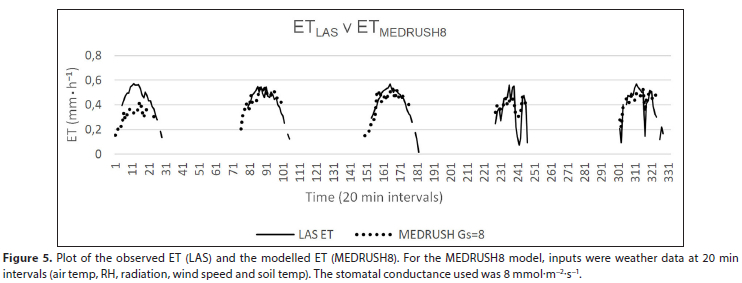
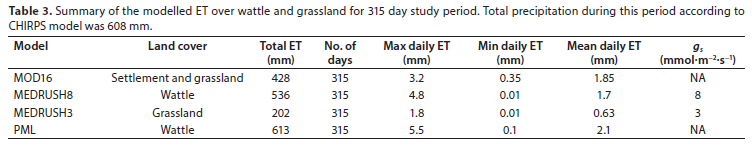
The output from the LAS for the field campaign was compared against the reference ET (ETo) (Figs 2 and 3). This result showed that the LAS was measuring less than ETo, which was a positive outcome. MEDRUSH8 (gs = 8 mmol-m-2-s-1) provided the best estimate of hourly ET (Figs 4 and 5) for the period of the field campaign against the observed data recorded by the LAS, which had been located over the dense wattle stand. This, together with a comparison of the three models (PMLswc, MEDRUSH8, MEDRUSH3) against the 20-min output from the LAS, led to the selection of MEDRUSH8 as the most appropriate model to compute ET for silver wattle. MEDRUSH was run using the 315 days of meteorological and soil temperature data for both grassland (gs = 3 mmol-m-2-s-1) and wattle. As an additional validation of the output for the grassland, MOD16 data were extracted for a single MODIS pixel over the study site for the corresponding 315-day period. A summary of the output from these models is provided (Table 3). Total ET for the silver wattle and grassland, covering the 2019-2020 growing season, for MOD16, MEDRUSH8 (wattle), MEDRUSH3 (grassland) and PML were 428 mm, 536 mm, 202 mm and 615 mm, respectively. Rainfall during that period was 608 mm. The MOD16 pixel (footprint 0.25 km2), which covers a complex mixture of dwellings, abandoned arable land and unimproved grassland, had the lowest estimate of total ET for the study period. The MEDRUSH8 total ET is 70 mm less than the total rainfall modelled for that same period and gives us confidence in the explanatory value of the two independent models over grassland. The MEDRUSH8 model, when run for the silver wattle (gs = 8), produced a lower ET (536 mm) for the 315 days of the study period than the reference ETo (869 mm) from the Kokstad weather station. This is expected as actual ET should not exceed reference ET. Removal of silver wattle by the Working for Water Programme has resulted in an observable increase in the flows of local groundwater springs ( Macleod, 2021). This would explain the difference in the ET over grassland (202 mm-a-1) versus wattle 536 mm-a-1). The removal ofthe wattle and replacing it with grass cover would result in 334 mm being released as run-off and recharge.
The MEDRUSH model used in this study did well to compute ET when compared to the observed measured by the LAS. Among the three models tested against the LAS campaign data, cumulative ET from MEDRUSH is slightly higher than that from LAS, whereas PMLswc and MOD16 were lower. These discrepancies could be attributed to uncertainties associated with ET methods and remote-sensed products where there is a scale mismatch amongst coarser meteorological forcing and cloud-free images, which results in higher uncertainties in ET estimations (Long et al., 2014). Although, the differences in ET estimates are not peculiar to the models used in this study, Chen et al. (2014) found that the ET simulated using different models varied between 61% and 80% when compared with ET from LAS towers. Also, MOD16 ET was found to under-estimate annual ET from LAS in ponderosa pine forests by approximately 51%, possibly because of underestimation of leaf area index (Ha et al., 2015). Using the RSR evaluation technique (Table 4), the performance of the three models was generally good, with MEDRUSH8 performing better than the other two, followed by PMLswc and MOD16. There was underestimation bias for the three models indicated by positive values of the PBIAS (Table 4). PBIAS values for all the models are low, which indicates good model simulation. The R2 values for the MOD16 and PMLswc models were generally low. Insensitivity of R2 to relative differences between measured and predicted values and its sensitivity to high extreme values could have contributed to poor performance of these models.
Determination of area invaded by black and silver wattle
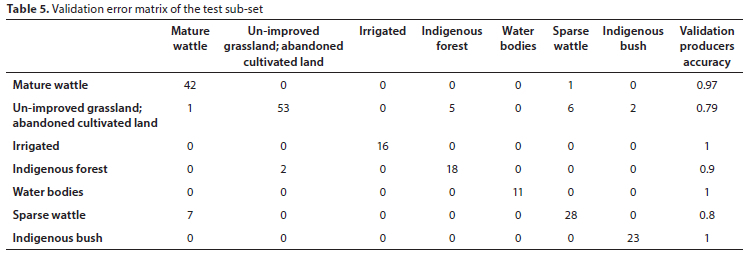
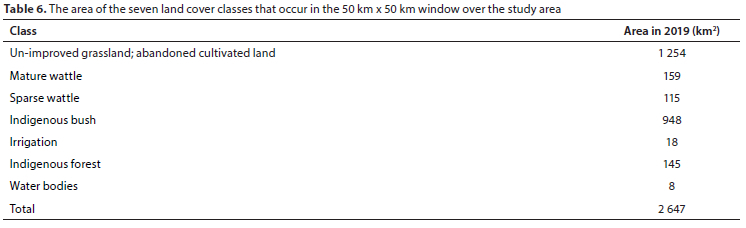
The data were randomly divided into a training (n = 356) and a testing (n = 215) sub-set. The final validation accuracy of the RF classification using the training sub-set was 0.889. Wattle and sparse wattle were classified at 97% and 80%, respectively, although the misclassifications in the sparse wattle category were all recognised as mature wattle, indicating an effective accuracy for wattle as 100% (Table 5 and 6).
Using earth observation, we determined that 10% (274 km2) of a 2 647 km2 geographic window is invaded by IAPs. Assuming the difference between woodland and grassland ET (234 mm) was being used by the trees through their link to the groundwater, this invasion accounts for approximately 89 000 ML of water per annum.
CONCLUSION
Water fluxes over wattle-invaded seep lines were assessed using ET data, combining both a direct measurement and modelling approach. Total ET for the 2019-2020 growing season in an IAP-invaded area was 324 mm greater than in adjacent un-invaded grassland (202 mm), confirming that woody encroachment significantly increases landscape water use. The extent of the wattle invasion (both mature and immature) in the 2 647 km2 regional window was approximately 10% of the land area. The invaded hillslope seeps were linked to groundwater, indicating that the elevated ET was attributable mainly to a groundwater source, and the invading woody shrubs substantially reduced groundwater return flows from seeps and springs. These seeps and springs feed the riparian zone, as well as its associated grazing meadows, and are used by livestock and rural households as a water source in exceptional circumstances. These riparian areas around the seeps are an important grazing resource for livestock, and the wattle invasion has reduced base stream flow as well as grass production in the 'meadow' adjacent to the riparian zone. This production has been lost to the livestock sector due to the invasion. Continued removal of wattle, followed by suitable restoration of landscape functionality (i.e re-vegetation using perennial grasses), would greatly enhance rangeland productivity and water production from hillslope seeps. This water could contribute substantially to grass production adjacent to the hillslope seeps, and any run-off would contribute to production in the grass meadows.
ACKNOWLEDGEMENTS
The research was supported by a United Kingdom Research and Innovation grant through the Biotechnology and Biological Sciences Research Council (Grant number BB/S014683) in funding ARP and equipment installation and the National Research Foundation of South Africa (National Equipment Programme) in partially funding purchase of the equipment. We are grateful to the anonymous reviewer who contributed greatly to the improvement of this manuscript.
REFERENCES
AGUILAR A, FLORES H, CRESPO G, MARÍN M, CAMPOS I and CALERA A (2018) Performance assessment of MOD16 in evapotranspiration evaluation in Northwestern Mexico. Water 10 (7) 901. https://doi.org/10.3390/w10070901 [ Links ]
ALLEN RG, PEREIRA LS, RAES D and SMITH M (1998) Crop evapotranspiration (guidelines for computing crop requirements). Irrig. Drainage 300 (56) 1-300. [ Links ]
BOUIN MN, LEGAIN D, TRAULLE Q, BELAMARI S, CANIAUX G, FIIANDRINO A, LAGARDE F, BARRIE J and MOULIN EG (2012) Using Scintillometry to estimate sensible heat fluxes over water: first Insights. Boundary Layer Meteorol. 143 (June) 451-480. https://doi.org/10.1007/s10546-012-9707-8 [ Links ]
BUCK A (1981) New equations for computing vapor pressure and enhancement factor. J. Appl. Meteorol. Climatol. 20 1527-1532. https://doi.org/10.1175/1520-0450(1981)020<1527:NEFCVP>2.0.CO;2 [ Links ]
CAMPBELL SCIENTIFIC (2002) Model HFP01 Soil Heat Flux Plate, Instruction Manual. Campbell Scientific, Logan, Utah, USA. [ Links ]
CAMPBELL SCIENTIFIC (2005) Bowen Ratio Instrumentation. Instruction Manual. 36. Campbell Scientific, Logan, Utah, USA. [ Links ]
CHEN Y, XIA J, LIANG S, FENG J, FISHER JB, LI X, LI X, LIU S, MA Z, MIYATA A and co-authors (2014) Comparison of satellite-based evapotranspiration models over terrestrial ecosystems in China. Remote Sens. Environ. 140 279-293. https://doi.org/10.1016/j.rse.2013.08.045 [ Links ]
DYE P, MOSES G, VILAKAZI P, NDLELA R and ROYAPPEN M (2001) Comparative water use of wattle thickets and indigenous plant communities at riparian sites in the Western Cape and KwaZulu-Natal. Water SA 27 (4) 529-538. https://doi.org/10.4314/wsa.v27i4.4967 [ Links ]
EVERSON CS, DYE PJ, GUSH MB and EVERSON TM (2011) Water use of grasslands, agroforestry systems and indigenous forests. Water SA 37 (5) 781-788. https://doi.org/10.4314/wsa.v37i5.15 [ Links ]
FUNK C, PETERSON P, LANDSFELD M, PEDREROS D, VERDIN J, SHUKLA S, HUSAK G, ROWLAND J, HARRISON L, HOELL A and MICHAELSEN J (2015) The climate hazards infrared precipitation with stations - a new environmental record for monitoring extremes. Sci. Data 2 (1) 150066. https://doi.org/10.1038/sdata.2015.66 [ Links ]
GRANATA F (2019) Evapotranspiration evaluation models based on machine learning algorithms - A comparative study. Agric. Water Manage. 217 303-315. https://doi.org/10.1016/j.agwat.2019.03.015 [ Links ]
GWATE O, MANTEL SK, PALMER AR, GIBSON LA and MUNCH Z (2018) Measuring and modelling evapotranspiration in a South African grassland: Comparison of two improved Penman-Monteith formulations. Water SA 44 (3) 482-494. https://doi.org/10.4314/wsa.v44i3.16 [ Links ]
GWATE O, MANTEL SK, FINCA A, GIBSON LA, MUNCH Z and PALMER AR (2016) Exploring the invasion of rangelands by Acacia mearnsii (black wattle): biophysical characteristics and management implications. Afr. J. Range Forage Sci. 33 (4) 265-273. https://doi.org/10.2989/10220119.2016.1271013 [ Links ]
HA W, KOLB TE, SPRINGER AE, DORE S, O'DONNELL FC, MARTINEZ MORALES R, MASEK LOPEZ S and KOCH GW (2015) Evapotranspiration comparisons between eddy covariance measurements and meteorological and remote-sensing-based models in disturbed ponderosa pine forests. Ecohydrology 8 (7) 1335-1350. https://doi.org/10.1002/eco.1586 [ Links ]
HARTOGENSIS OK, WATTS CJ, RODRIGUEZ J-C and DE BRUIN HR (2003) Derivation of an effective height for scintillometers: La Poza experiment in Northwest Mexico. J. Hydrometeorol. 4 (5) 915-928. https://doi.org/10.1175/1525-7541(2003)004<0915:DOAEHF>2.0.CO;2 [ Links ]
HILL RJ (1992) Review of optical scintillation methods of measuring the refractive-index spectrum, inner scale and surface fluxes. Waves Random Complex Media 2 (3) 179-201. https://doi.org/10.1088/0959-7174/2/3/001 [ Links ]
HO TK (1998) The random subspace method for constructing decision forests. IEEE Trans. Pattern Anal. Mach. Intell. 20 (8) 832-844. https://doi.org/10.1109/34.709601 [ Links ]
JOHNSON MR, VAN VUUREN CJ, HEGENBERGER WF, KEY R and SHOKO U (1996) Stratigraphy of the Karoo Supergroup in southern Africa: an overview. J. Afr. Earth Sci. 23 (1) 3-15. https://doi.org/10.1016/S0899-5362(96)00048-6 [ Links ]
JONES H (2014) Plants and Microclimate A Quantitative Approach to Environmental Plant Physiology (3rd edn). Cambridge University Press, Cambridge. https://doi.org/10.1017/CBO9780511845727 [ Links ]
KIPP AND ZONEN BV (2012) Instruction Manual, LAS MkII Scintillometer. Kipp and Zonen B.V., Delft. [ Links ]
KOHSIEK W, MEIJNINGER WML, MOENE AF, HEUSINKVELD BG, HARTOGENSIS OK, HILLEN WCAM and DE BRUIN HAR (2002) An extra large aperture scintillometer for long range applications. Boundary Layer Meteorol. 105 (1) 119-127. https://doi.org/10.1023/A:1019600908144 [ Links ]
LE MAITRE DC, BLIGNAUT JN, CLULOW A, DZIKITI S, EVERSON CS, GÖRGENS AHM and GUSH MB (2020) Impacts of plant invasions on terrestrial water flows in South Africa. In: Van Wilgen B, Measey J, Richardson D, Wilson J and Zengeya T (eds) Biological Invasions in South Africa. Springer. https://doi.org/10.1007/978-3-030-32394-3_15 [ Links ]
LEUNING R, ZHANG YQ, RAJAUD A, CLEUGH H and TU K (2008) A simple surface conductance model to estimate regional evaporation using MODIS leaf area index and the Penman-Monteith equation. Water Resour. Res. 44 (10). https://doi.org/10.1029/2007WR006562 [ Links ]
LONG D, LONGUEVERGNE L and SCANLON BR (2014) Uncertainty in evapotranspiration from land surface modeling, remote sensing, and GRACE satellites. Water Resour. Res. 50 (2) 1131-1151. https://doi.org/10.1002/2013WR014581 [ Links ]
MANWEL JF, MCGOWAN JG and ROGERS AL (2002) Wind Energy Explained: Theory, Design and Application (2nd edn). John Wiley and Sons, Chichester. [ Links ]
MACLEOD N (2021) Personal communication. October 2021. Dr N Macleod, Director, Environmental and Rural Solutions, Matatiele, Eastern Cape, South Africa. [ Links ]
MEIJNINGER WML, HARTOGENSIS OK, KOHSIEK W, HOEDJES JCB, ZUURBIER RM and DE BRUIN HAR (2002) Determination of area-averaged sensible heat fluxes with a large aperture scintillometer over a heterogeneous surface - Flevoland field experiment. Boundary Layer Meteorol. 105 (1) 37-62. https://doi.org/10.1023/A:1019647732027 [ Links ]
MORILLAS L, LEUNING R, VILLAGARC L and DOMINGO F (2013) Improving evapotranspiration estimates in Mediterranean drylands: The role of soil evaporation. Water Resour. Res. 49 6572-6586. https://doi.org/10.1002/wrcr.20468 [ Links ]
MU Q, ZHAO M and RUNNING SW (2013) MODIS Global Terrestrial Evapotranspiration (ET) Product (MOD16A2/A3) -Algorithm Theoretical Basis Document Collection 5. NASA, Washington DC. URL: https://modis-land.gsfc.nasa.gov/pdf/MOD16ATBD.pdf (Accessed 1 October 2020). [ Links ]
MU QZ, ZHAO M and RUNNING S (2011) Improvements to a MODIS global terrestrial evapotranspiration algorithm. Remote Sens. Environ. 115 (8) 1781-1800. https://doi.org/10.1016/j.rse.2011.02.019 [ Links ]
MUCINA L, HOARE D, LÖTTER M, DU PREEZ P, RUTHERFORD M, SCOTT-SHAW C, BREDENKAMP G, POWRIE L, SCOTT L, CAMP K and co-authors (2006) Grassland biome. In: Mucina L and Rutherford MC (eds.) The Vegetation of South Africa, Lesotho and Swaziland (1st edn). South African National Biodiversity Institute, Pretoria. [ Links ]
OSBORNE CP, MITCHELL PL, SHEEHY JE and WOODWARD FI (2000) Modelling the recent historical impacts of atmospheric CO2 and climate change on Mediterranean vegetation. Glob. Change Biol. 6 (4) 445-458. https://doi.org/10.1046/j.1365-2486.2000.00336.x [ Links ]
OSBORNE CP and WOODWARD FI (1999) The MEDRUSH Vegetation Model. URL: http://www.shef.ac.uk/aps/medveg.pdf (Accessed 1 October 2020). [ Links ]
PALMER AR, WEIDEMAN C, FINCA A, EVERSON CS, HANAN N and ELLERY W (2015) Modelling annual evapotranspiration in a semi-arid, African savanna: functional convergence theory, MODIS LAI and the Penman-Monteith equation. Afr. J. Range Forage Sci. 32 (1). https://doi.org/10.2989/10220119.2014.931305 [ Links ]
POZNÍKOVÁ G, FISCHER M, ZALUD Z and TRNKA M (2015) Scintillometry based energy fluxes compared to Bowen ratio/energy balance method for evapotranspiration determination over winter wheat. In: Proceedings of the conference 'Towards Climatic Services', 15-18 September 2015, Nitra, Slovakia. [ Links ]
RAMBIKUR EH and CHÁVEZ JL (2014) Assessing inter-sensor variability and sensible heat flux derivation accuracy for a large aperture scintillometer. Sensors (Switzerland) 14 (2) 2150-2170. https://doi.org/10.3390/s140202150 [ Links ]
RUNNING S, MU Q and ZHAO M (2015) MOD17A2H MODIS/Terra Gross Primary Productivity 8-Day L4 Global 500m SIN Grid V006. 2015. distributed by NASA EOSDIS Land Processes DAAC. https://doi.org/10.5067/MODIS/MOD17A2H.006 [ Links ]
SCORER C, MANTEL SK and PALMER AR (2019) Do abandoned farmlands promote spread of invasive alien plants? Change detection analysis of black wattle in montane grasslands of the Eastern Cape. S. Afr. Geogr. J. 101 (1) 1-15. https://doi.org/10.1080/03736245.2018.1541018 [ Links ]
SCOTT-SHAW BC, EVERSON CS and CLULOW AD (2017) Water-use dynamics of an alien-invaded riparian forest within the Mediterranean climate zone of the Western Cape, South Africa. Hydrol. Earth Syst. Sci. 21 4551-4562. https://doi.org/10.5194/hess-21-4551-2017 [ Links ]
SEATH J and SHACKLETON C (2022) Comparative avifaunal richness and diversity in invasive Acacia dealbata patches and adjacent montane grasslands. Afr. Zool. 57 (1) 12-19. https://doi.org/10.1080/15627020.2022.2047104 [ Links ]
TUNICK A (2003) CN2 model to calculate the micrometeorological influences on the refractive index structure parameter. Environ. Modell. Softw. 18 (2) 165-171. https://doi.org/10.1016/s1364-8152(02)00052-x [ Links ]
TURPIE JK, MARAIS C and BLIGNAUT JN (2008) The working for water programme: Evolution of a payments for ecosystem services mechanism that addresses both poverty and ecosystem service delivery in South Africa. Ecol. Econ. 65 (4) 788-798. https://doi.org/10.1016/j.ecolecon.2007.12.024 [ Links ]
 Correspondence:
Anthony Palmer
Email: t.palmer@ru.ac.za
Received: 17 November 2021
Accepted: 5 July 2023

