


Serviços Personalizados
Artigo
 Inglês (pdf)
 Artigo em XML
 Referências do artigo
Indicadores

Links relacionados
-
 Citado por Google
 -
 Similares em Google
Compartilhar

 Permalink
Water SA
versão On-line ISSN 1816-7950
versão impressa ISSN 0378-4738
Water SA vol.49 no.3 Pretoria Jul. 2023
http://dx.doi.org/10.17159/wsa/2023.v49.i3.3967
RESEARCH PAPER
Assessing the performance of techniques for disaggregating daily rainfall in South Africa
R RamlallI; JC SmithersI, II, III
ICentre for Water Resources Research, University of KwaZulu-Natal, South Africa
IIJG Afrika, Hilton, Pietermaritzburg, South Africa
IIINational Centre for Engineering in Agriculture, University of Southern Queensland, Toowoomba, Australia
ABSTRACT
Design flood estimation (DFE) methods are used to limit the risk of failure and ensure the safe design of hydrological and related infrastructure, and to inform water resources management. In order to improve DFE methods which are based on event or continuous simulation rainfall-runoff models, it is generally necessary to use sub-daily rainfall data. However, sub-daily rainfall gauges are relatively sparse and have shorter record lengths than daily rainfall gauges in South Africa. Rainfall temporal disaggregation (RTD) techniques can be used to produce finer resolution data from coarser resolution daily rainfall data. Several RTD approaches have been developed and are used in South Africa. However, there is a need to review and assess the performance of the available RTD methods. This paper contains an overview of selected RTD approaches and the performance of the methods at selected sites in South Africa, for disaggregating daily rainfall into 15-min intervals. Temporal distributions of rainfall were represented by dimensionless Huff curves, which served as the basis for comparison of observed and disaggregated rainfall. In a pilot study it was found that the SCS-SA (Soil Conservation Service model South Africa) distributions and the Knoesen model approaches performed considerably better than the other approaches. The RTD approaches were further assessed using data from 14 additional rainfall stations. For the additional stations, the Knoesen model and SCS-SA disaggregated rainfall generally provided the most realistic temporal distributions.
Keywords: rainfall, disaggregation, intensity, data, methods
INTRODUCTION
Rainfall is a highly variable driver of the hydrological cycle, and is a key input in many design flood estimation (DFE) techniques (Smithers et al., 2002). Rainfall data are utilised to determine hyetographs and transformed into hydrographs from which peak discharges are obtained for the design of hydraulic structures (Arnaud et al., 2007; Hassini and Guo, 2017; Rowe and Smithers, 2018). The temporal distribution of rainfall intensity within storms influences both the magnitude and timing of peak discharges within a catchment and, as a result, the flood-generation potential of the event (Knoesen and Smithers, 2008).
DFE can be determined from gauged runoff data where this is available, but is generally performed utilising daily rainfall data due to scarcity of observed runoff data and the relative abundance and longer record lengths of daily rainfall as opposed to sub-daily rainfall data (Pui et al., 2012). However, such data may not adequately represent the important characteristics of rainfall processes occurring at hourly and sub-hourly scales (Smithers and Schulze, 2000; Pui et al., 2012). Therefore, in order to obtain adequate data at finer temporal resolutions, rainfall temporal disaggregation (RTD) techniques are often employed (Pui et al., 2012). RTD methods disaggregate coarser resolution data, such as daily data, to produce data of a finer resolution, such as hourly (Koutsoyiannis et al., 2003). The finer resolution data are able to more accurately represent rainfall hyetographs required for modelling runoff and DFE (Koutsoyiannis et al., 2003). RTD techniques have been successfully applied under South African conditions to obtain finer resolution rainfall data (Adamson, 1981; Lambourne and Stephenson, 1987; Weddepohl, 1988; Knoesen, 2005; Knoesen and Smithers, 2008). However, the performance of these RTD methods needs to be assessed in order to determine the need for updating them, as a number of newer approaches have been developed and successfully applied internationally (Smithers et al., 2002). Hence, there is a need to assess the feasibility of new methods for application in South Africa and subsequently to update the toolbox of RTD techniques for use in South Africa.
The overall aim of this study was to assess the performance of selected RTD methods and to recommend the adoption or adaptation of one or more of these approaches for application under South African conditions. The study was part of research conducted for a Master of Science degree at the University of KwaZulu-Natal. This paper provides a brief review of methods for disaggregating coarser level rainfall data into a finer resolution hyetograph, and assessing the performance of selected RTD methods, and makes recommendations for RTD methods to be used in practice and for further research to be undertaken. Full details of the study reported are contained in Ramlall (2020).
A review of methods for rainfall temporal disaggregation
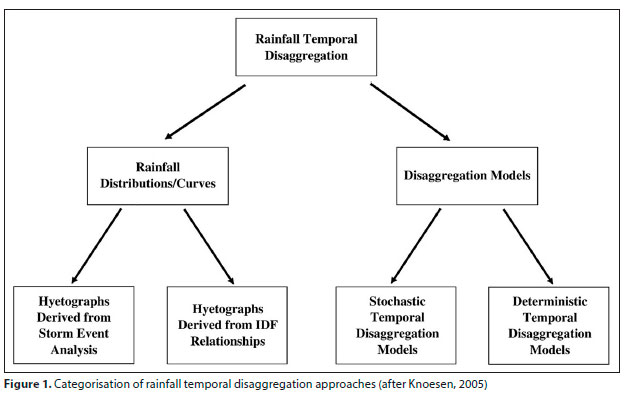
The RTD approaches identified through a review of the literature are broadly classified as either rainfall distribution curves or disaggregation models, as shown in Fig. 1 (Knoesen, 2005).
When applied, a disaggregation approach should ideally result in a finer time-step hyetograph which can give a realistic representation of sub-daily rainfall at the site (Smithers and Schulze, 2000). The applied approach should disaggregate the daily values to sub-daily time steps, while maintaining the characteristics of the rainfall process and ensuring the accumulated sub-daily values are equal to the daily total.
Rainfall distributions are used in design and modelling applications for determining the distribution of rainfall depths or intensities throughout the duration of a storm. These synthetic distributions may be used to derive hyetographs and determine the timing of peak discharges within the storm duration (Chow et al., 1988; Weddepohl, 1988). The RTD approaches could be adapted for use with observed daily data with short record lengths. Furthermore, approaches such as the Huff curves (Huff, 1967; Huff and Angel, 1992; Bonta, 2004) and the average variability method (AVM) (Green et al., 2005; Bhuiyan et al., 2010) have shown potential for regionalisation. Therefore, disaggregation curves could be developed and possibly regionalised, based on general storm patterns, for use in disaggregating daily rainfall into sub-daily hyetographs, as developed by Weddepohl (1988) and Knoesen (2005) in South Africa.
Stochastic modelling approaches generally simulate sub-daily values using statistical parameters derived from the observed daily data. An element of randomness is included in sampling procedures (Rodriguez-Iturbe et al., 1987; Smithers, 1998; Koutsoyiannis and Onof, 2001). Rainfall processes are, by nature, complex, and it is unlikely that a model will be able to describe event characteristics completely and accurately. Hence, the use of stochastic models which may produce results similar to observed data is justifiable (Kossieris et al., 2018). Furthermore, such approaches are highly applicable to continuous simulation modelling where the aim is to simulate potential outcomes for rainfall event processes (Smithers et al., 2002). Deterministic model RTD approaches are less commonly applied than stochastic models or distribution approaches, due to their parameters being more physically related to rainfall processes which, in some cases, are difficult and time-consuming to derive (Ormsbee, 1989; Hingray and Ben Haha, 2005). Therefore, the range of models identified in this study was comparatively limited.
Approaches which have been successfully applied in South Africa include the SCS-SA distributions (Schulze, 1984; Smithers et al., 2002), triangular distributions (Lambourne and Stephenson, 1987), Huff Curves (Smithers, 1998), stochastic Bartlett-Lewis rectangular pulse (BLRP) models (Smithers, 1998; Smithers et al., 2002) and an adapted semi-stochastic regionalised disaggregation model (Knoesen, 2005). These approaches are categorised as rainfall distributions and stochastic models. A summary of the various approaches which were reviewed and their performance in case studies can be seen in Ramlall (2020).
A list of acronyms can be found at the end of the paper.
METHODOLOGY
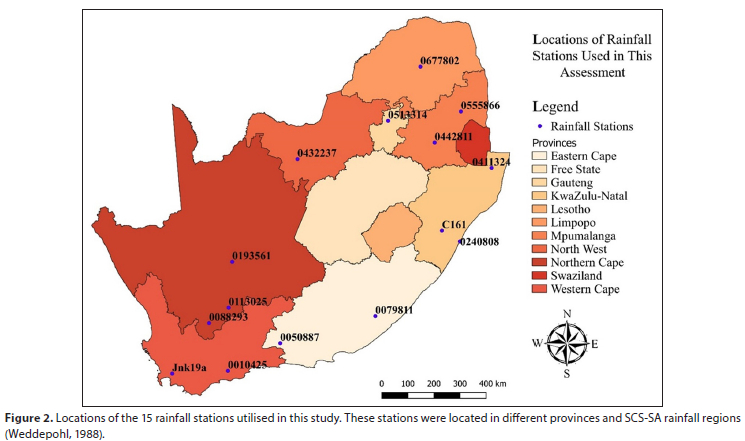
Rainfall data were obtained through the Centre for Water Resources Research (CWRR) - University of KwaZulu-Natal (UKZN) research catchments database, which includes data extracted from breakpoint digitized autographic rainfall charts from previously monitored research sites and historical data previously supplied by the South African Weather Service (SAWS) (Smithers and Schulze, 2001). One station was randomly selected from each of the 15 relatively homogenous extreme rainfall clusters identified by Smithers (1998) and Smithers and Schulze (2000). The data for each station were inspected to determine if the record was of sufficient length and if the record was relatively continuous - without extensive periods of missing values. When a selected station was found to be unsuitable, another station was randomly selected from the cluster. This was repeated until 15 stations were obtained, which are located as shown in Fig. 2.
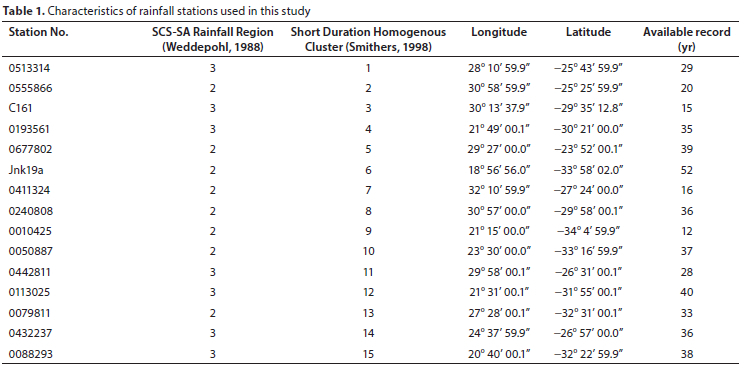
A pilot study was initially undertaken to develop procedures to apply the methods and to develop performance indices to assess and compare the performance of the methods. In the pilot study, rainfall data from Station C161 (Cedara) in the UKZN research catchments database were utilised for the development of the methodology for application of the approaches and assessment of results. Thereafter, the RTD approaches were applied to daily rainfall data from the additional 14 stations using the same methodology as in the pilot study. Details on the rainfall stations are summarised in Table 1.
Characteristics of rainfall data for all stations
Days with rainfall were identified from the 15-min data available for the selected rainfall stations. Daily rainfall was computed for periods from 08:00 to 08:00 the next day, as per the standard timeframe for daily rainfall used in South Africa. Furthermore, following the methodologies in studies such as Huff (1967) and Walker and Tsubo (2003), rainfall days with total depths less than 10 mm were excluded in the assessment. Rainfall days were sorted into depth ranges. The distribution of rainfall days in selected depth ranges per station can be seen in Fig. 3.
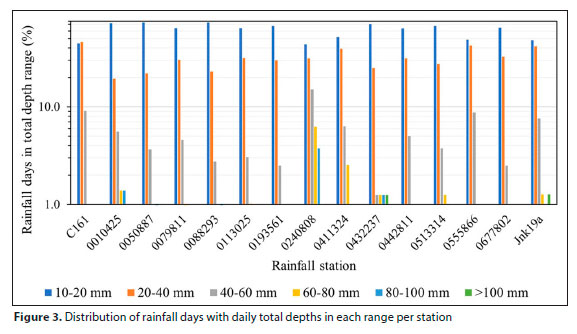
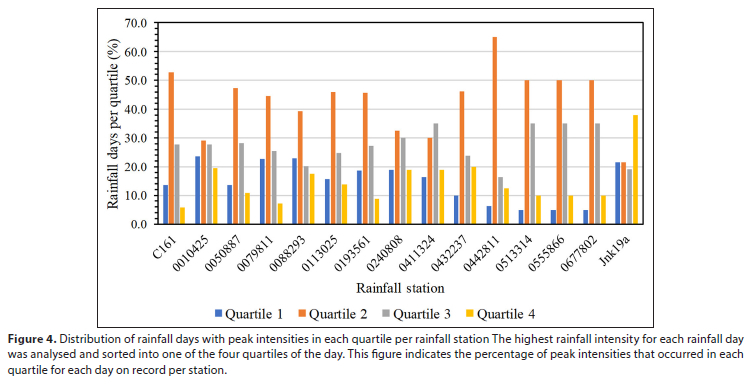
It can be seen that the majority of rainfall days have total depths in the 10-20 mm and 20-40 mm ranges for all stations. The temporal distribution of rainfall on these rainfall days will therefore have a greater influence on the generalised temporal distributions produced for each rainfall station. The temporal quartile of an event in which the peak of the rainfall occurs is a representation of the period of the rainfall day in which the highest rainfall intensity occurs. The quartiles are determined by dividing the total event duration into 4 quarters, giving the 1st, 2nd, 3rd and 4th quartiles. Early peaking rainfall hyetographs display a peak intensity in the 1st or 2nd quartiles, while later peaking rainfall hyetographs display peaks in the 3rd or 4th quartiles. The distribution of the percentage of rainfall days which display peaks in each quartile thus influences the shape of the set of dimensionless Huff curves produced. The distribution of rainfall days with peak intensities in each quartile for each station is shown in Fig. 4.
The majority of rainfall days for the selected stations display peaks in the 2nd quartile of their respective durations. The second-highest concentration is in the 3rd quartile. Hence, the generalised temporal distributions of rainfall produced are likely to display a higher proportion of rainfall in the middle to later sections of the event duration.
Characteristics of rainfall data used in pilot study
Daily rainfall was computed from the 15-min rainfall data, and daily totals of <10 mm were excluded from the analysis, as described above. Trends in the relationships between daily rainfall parameters can be seen in Fig. 5. The low correlation indicates that there is no discernible relationship between the two parameters.
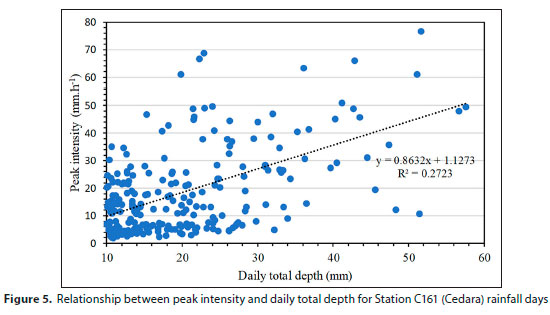
Key trends in the analysis of daily rainfall showed a low correlation between peak intensity and total depth. It should be noted that the highest rainfall intensity in a 15-min duration for the 24-h daily rainfall period was used as the peak intensity for the day, and hence this peak is not the same as the actual peak for the rainfall event. Rainfall events may occur across multiple rainfall days or occur multiple times within a 24-h daily period.
Selection of RTD approaches
RTD approaches were selected from those identified from the literature review, on the basis of the ease of application with the available data in terms of the number of input parameters required, reported performance in case studies, and potential for regionalisation in South Africa. The following RTD models and distributions were selected for assessment in this study:
• Huff curves as a means of comparing observed and disaggregated distributions (Huff and Angel, 1992)
• SCS-SA rainfall distributions (Weddepohl, 1988)
• HRU (University of the Witwatersrand Hydrological Research Unit) 1/72 24-h distribution (HRU, 1972)
• Triangular distribution (Lambourne and Stephenson, 1987)
• Average variability method (AVM) (Bhuiyan et al., 2010)
• Knoesen semi-stochastic disaggregation model (Knoesen, 2005)
Assessment of performance of approaches
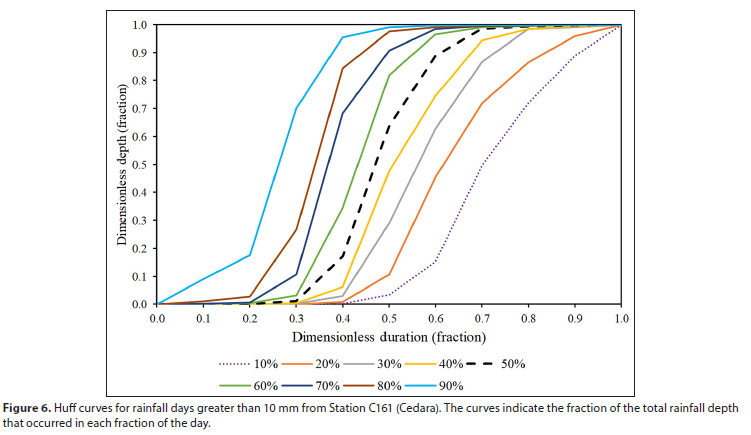
The performance of the disaggregation approaches was determined through analysis of Huff curves produced using the observed 15-min data and disaggregated daily data. Huff curves were developed according to the methodology outlined in Bonta (2004). Percentiles are generalised probabilistic representations of dimensionless rainfall events or daily rainfall durations (24-h periods) plotted against the corresponding dimensionless accumulated depths. For example, the 90th percentile curve shows that 90% of the accumulated event or daily rainfall has occurred and, therefore, 90% of all other rainfall temporal distribution profiles lie below this curve (Bonta, 2004). An example of a set of Huff curves can be seen in Fig. 6.
The mean absolute relative error (MARE), a single value which quantifies the performance of disaggregation approaches and distributions, was used as a measurement of the difference between a percentile Huff curve generated from the disaggregated daily data and the percentile curve derived from the observed 15-min data, as shown in Eq. 1. The total MARE (ZMARE) represents the total value for all percentiles and is given by Eq. 2:
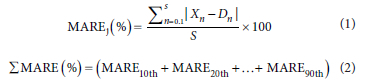
where:
j = percentile (10th, 20th, 90th)
Xn= observed dimensionless depth at dimensionless time = n
n = dimensionless duration fraction (0.1, 0.2, ... 1.0)
Dn = disaggregated dimensionless depth at dimensionless time step = n
S = number of dimensionless duration fraction values
The Nash-Sutcliffe efficiency (NSE) is a normalised statistic which can be used to indicate how well the plot of observed versus simulated data fits the 1:1 line (Moriasi et al., 2007). The NSE is utilised in addition to the MARE to determine the performance of the disaggregation approaches, by means of comparison of observed and disaggregated Huff curve increments. The NSE ranges between -°o and 1.0, with a value of 1.0 being the optimal value. Values between 0.0 and 1.0 are considered acceptable levels of performance (Moriasi et al., 2007). The NSE is determined using Eq. 3.

where:
Yiobs = the ith observation for the constituent being evaluated
yisim = the ith simulated value for the constituent being evaluated
Ymean = the mean of observed data for the constituent being evaluated
n = the total number of observations
Application of RTD approaches
A summary of the differences between the application of RTD approaches to daily rainfall is detailed below. It should be noted that some of the disaggregation approaches were modified for application on daily rainfall. The modifications were based on the following assumptions:
• Data which were provided in the digitised database was accurate. It was evident that long periods of low rainfall values displayed may be an artefact of the digitisation and interpolation procedure between two digitised points used for the derivation of the rainfall depths from the original rainfall chart data.
• It is acknowledged that not all the RTD approaches selected for application are designed for application on daily rainfall data as obtained from the rainfall stations used in this study. Therefore, the methods were either applied directly or in a modified manner.
Huff curves
Huff curves were developed using the depths of rainfall at each
15-min interval of the 24-h (08:00 to 08:00) duration for each
rainfall day. Huff curves provide smoother distributions than actual rainfall temporal distributions.
SCS-SA rainfall distribution curves
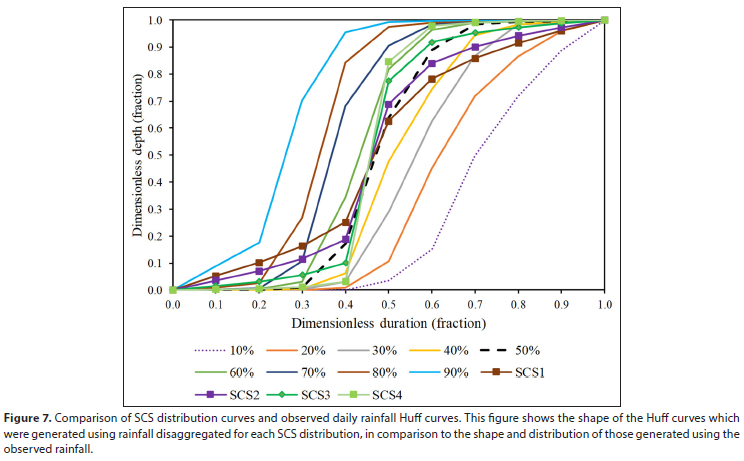
Dimensionless depth fractions provided by each distribution were used to produce a distribution of the total daily rainfall depth over a 24-h duration (SCS-SA distributions). It is acknowledged that the correct approach for applying the SCS-SA method is to select a single appropriate distribution for a rainfall station based on the SCS-SA rainfall region. However, in this study all of the SCS-SA distributions were applied to assess if a distribution from another region provides a better fit to the distribution of the observed data at the site. A comparison of the four SCS-SA distributions and Huff curves for Site C161 is shown in Fig. 7.
HRU 1/72 method
The HRU 1/72 distributions were selected from the range of 2-h to 24-h distributions provided in the HRU 1/72 report for characterising design storms (HRU, 1972). The distributions associated with the approach each provide a dimensionless distribution of percentage of total depth per corresponding percentage of total duration. In order to obtain the fraction of event total for each 15-min incremental time step, a 10th order polynomial equation was fitted to the cumulative curves. This followed the methodology used by Bonta (2004) in the application of Huff curves. For daily rainfall, the HRU 1/72 24-h distribution was used to disaggregate daily total depths.
Triangular distribution
The methodology described in Lambourne and Stephenson (1987) and Chow et al. (1988) was followed for application of the triangular distribution. In the first approach in the pilot study, triangular distributions for daily rainfall were determined by using the available daily rainfall total depth, 24 h duration and observed time-to-peak to calculate the peak intensity for a rainfall day (triangular obsTP approach). In a second approach, the median time-to-peak derived from the observed rainfall days was determined and used to derive distributions (Triangular median TP approach). The use of the median value time to peak was adopted, given the weak relationship between time to peak and total depth, thus making it difficult to estimate the time to peak for each rainfall day.
Average variability method
A modified version of the AVM described by Bhuiyan et al. (2010) was utilised in this assessment, which did not involve analysis of intense bursts of rainfall. Literature and case studies reviewed described the application of the approach for rainfall events. In this assessment, the approach was modified to be more suitable for application with the available daily rainfall data. The 24-h rainfall days were divided into 4 sections of 6 h in duration and the method derivation of the AVM temporal pattern, as given in Bhuiyan et al. (2010), was followed. Rainfall data for Station C161 were ranked to identify the highest rainfall daily totals in each year on record. Full details of the adopted method are contained in Ramlall (2020).
Alternative average variability method
The methodology used for initial derivation of the AVM distribution used in this assessment displays a limitation relating to the 6-h sections of daily rainfall depths utilised. The use of four 6-h sections of rainfall results may not result in disaggregated daily depths with similar peak values to the observed rainfall. Therefore, a second approach was used in this study which modified the AVM distribution using 96 sections of 15-min in duration, which is the same resolution as the observed daily (digitised) rainfall (AVM-B).
Knoesen semi-stochastic disaggregation model
The semi-stochastic Knoesen model was developed for application on 24-h data (00:00 to 23:59). The method developed by Knoesen (2005) was utilised to generate 24-h distributions of daily rainfall total depths. For the pilot study, it was determined that Station C161 falls within Range III of the regionalised distribution map of R values associated with the model (Knoesen, 2005). The range category (Range III) and daily total depths were used as input to the programme to generate 15-min rainfall depths distributed over 24 h. The stochastic nature of the model results in a different distribution with each successive run. For purposes of this assessment, a single distribution was generated for each respective rainfall day. The total depth of each rainfall day was used as input to the model to stochastically generate a distribution of depths over 24 h.
RESULTS
The RTD approaches were applied to disaggregate daily rainfall depths at Site C161 in the pilot study and then at the additional 14 rainfall stations. The approaches were assessed for their performance in approximating the observed temporal distribution of rainfall, as represented by the Huff curves developed, using MARE, ZMARE and NSE values.
Pilot study results
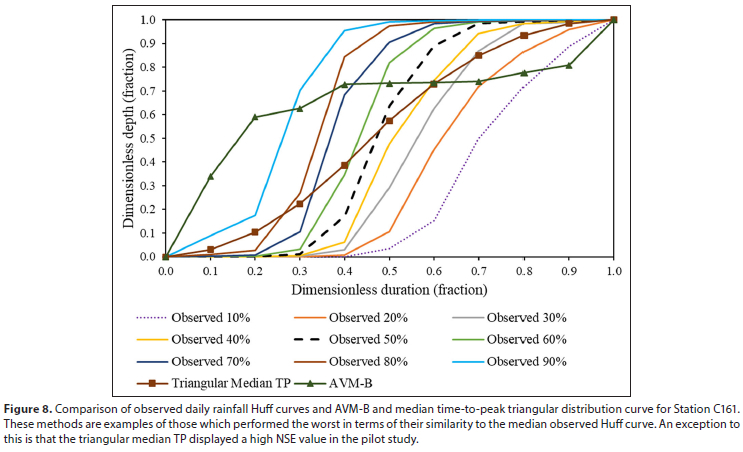
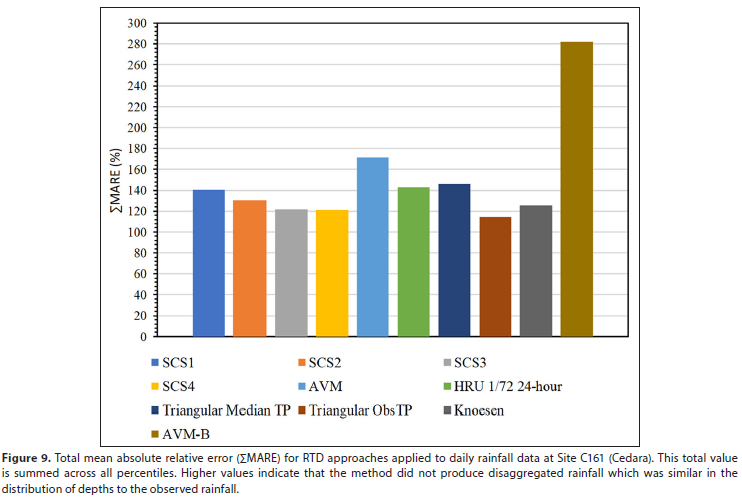
The Huff curves for two of the worst performing methods can be seen in Fig. 8. The closer the method curves are to the 50% Huff curve, the better the performance. The ZMARE values for comparisons of observed daily rainfall Huff curves and Huff curves derived from daily rainfall depths disaggregated using each RTD approach can be seen in Fig. 9. Table 2 shows the NSE values for comparison.
The triangular obsTP appears to perform the best out of the RTD approaches. However, it should be noted that the approach was developed using observed rainfall total depths and the observed time to peak, which likely accounts for the good performance. The triangular median TP distribution, which was developed using the median time to peak value for all rainfall days and the daily total depth, does not perform as well. Considering these factors, the Knoesen model performs the best out of the approaches which are not fixed distributions or do not use observed parameters. The SCS3 and SCS4 distributions are quite similar in performance. However, the SCS4 distribution performs the best, despite the rainfall station (C161) falling within a SCS3 region.
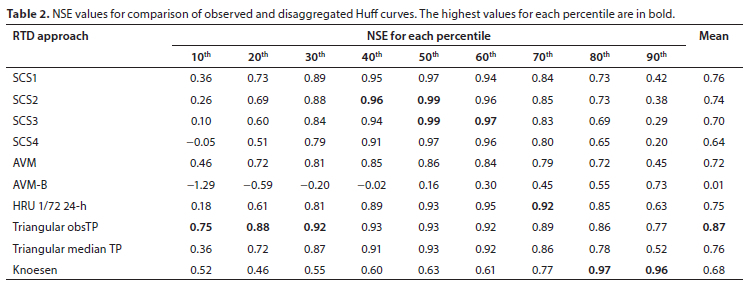
The NSE values between the observed and disaggregated Huff curves were determined and can be seen in Table 2. This serves as an additional assessment of how similar the distributions displayed by the disaggregated rainfall curves are to those of the observed rainfall curves. It can be seen that relatively high NSE values are displayed for each approach. An exception to this is the AVM-B which displays values indicative of overall poor performance. The trends characterised by the NSE values are slightly different to those of the MARE and ZMARE values previously shown, especially by the mean NSE values. As evident from Table 2, the Knoesen model is shown to be the second least accurate RTD approach, based on approximation of the Huff curve temporal distributions, according to the NSE values. This is despite the result shown by the MARE values in Fig. 9, which indicated that the Knoesen model was one of the best performing. However, the NSE values do provide a fair indication that there is a discernible difference between the observed Huff curves and the Huff curves derived from the disaggregated rainfall produced by each approach.
Results for daily rainfall disaggregation at all sites
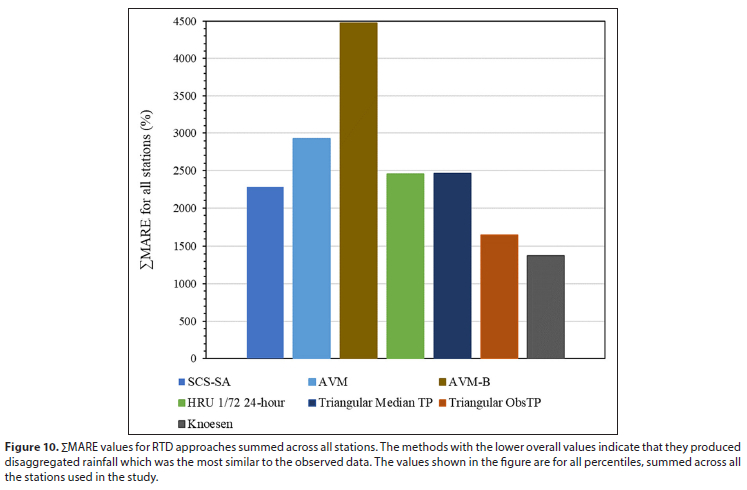
The daily rainfall data for 14 additional rainfall stations, with one station selected from each of the 15 homogenous rainfall clusters, were used for the application of RTD approaches using the same methodologies as the pilot study. This was undertaken to further assess the performance of the selected approaches for the disaggregation of rainfall data in different climatic locations in South Africa. The ZMARE values were calculated for RTD approaches applied at each station, to determine the overall performance of each approach. The station-specific ZMARE values for each approach were summed across all of the rainfall stations, as shown in Fig. 10. The value for SCS-SA indicates the total when the ZMARE values for the appropriate SCS-SA distribution for each station (based on the region) were summed across all stations.
The approach which provides the least realistic rainfall temporal distribution in terms of the Huff curves appears to be the AVM-B, followed by the AVM distribution. It can be seen that for all of the rainfall stations, the approaches which generally display the lowest ZMARE values are the Knoesen, triangular obsTP and SCS-SA. It is acknowledged that the good performance of the triangular obsTP can be attributed to the methodology used in its application. The approach was applied using the observed time to peak intensity for each event, which improves the performance in approximating the observed daily rainfall temporal distribution. The version of the approach which utilises a generalised timing of the peak intensity value and hence removes this bias, the triangular median TP distribution, does not perform as well and often displays relatively high ZMARE values. Given the abovementioned factors, it can be said that the RTD approach which results in the best overall performance for the disaggregation of daily rainfall totals into realistic temporal distributions is the Knoesen semi-stochastic disaggregation model, followed by the SCS-SA distributions.
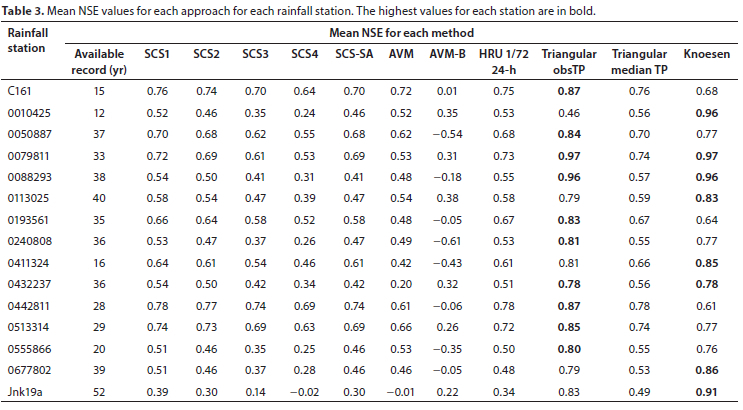
The mean NSE values shown in Table 3 are reflective of the results which have been previously shown by the ZMARE values. Overall, the Knoesen model is the RTD approach which provides the temporal distributions that are most similar to those of the observed daily rainfall data. The four SCS-SA distributions also perform relatively well for stations in their respective recommended regions. However, some exceptions noted previously are seen, in cases where an SCS-SA distribution not recommended for the region may outperform the recommended distribution. It should also be noted that reasonable performance is shown by the triangular median TP approach, which outperforms other approaches in some instances and for certain percentiles.
DISCUSSION AND CONCLUSIONS
Design flood estimation (DFE) generally utilises daily rainfall data, which are widely available in South Africa. Many event-based and continuous simulation models require rainfall data to be available at finer time-step resolutions. Hence, there is a need for sub-daily time-step rainfall data. Sub-daily rainfall stations are relatively sparse and have shorter record lengths compared to daily rainfall stations, both in South Africa and internationally. Therefore, a means of disaggregating daily rainfall data into sub-daily rainfall hyetographs is required. Rainfall temporal disaggregation (RTD) approaches may be utilised to disaggregate daily rainfall data into shorter temporal resolutions from higher temporal resolution data. Several RTD approaches have been applied in South Africa, including the SCS-SA distributions (Soil Conservation Service model South Africa), Huff curves, Knoesen semi-stochastic disaggregation model and triangular distribution. However, application of RTD approaches locally is relatively limited compared to those developed and applied internationally.
The overall aim of this study was to assess the performance of selected RTD methods and to recommend the adoption or adaptation of one or more of these approaches for application under South African conditions. A pilot study was used to develop procedures to apply the methods and to develop performance indices. Huff curves were utilised for comparison of the observed and disaggregated rainfall depths. Furthermore, the mean absolute relative error (MARE), ZMARE and Nash-Sutcliffe efficiency (NSE) values served as an index for quantifying the difference between curves derived from observed and disaggregated rainfall.
The Huff curves developed from daily rainfall disaggregated using the Knoesen model, SCS3, SCS4 (SCS-SA distributions) and the triangular distribution performed well in approximating the observed Huff curves for the pilot study. The good performance of the triangular obsTP distribution was attributed to the inclusion of observed parameters in its application. However, the triangular median TP did not perform as well. The triangular median TP was developed using the median event time to peak and the observed durations in order to remove part of the performance bias of the triangular obsTP. Overall, the best performing approach for disaggregating daily rainfall was the SCS4, despite the station falling within a SCS3 region.
The results of the assessment of the RTD approaches according to ZMARE and NSE values were different to those seen for the pilot study. The best performing RTD approaches were found to be the SCS-SA distributions and the Knoesen model, when the triangular obsTP is not considered given that observed time to peak intensity is not available when using daily rainfall data. However, the triangular median TP displayed reasonable performance and shows potential for further investigation into general use. Overall, the Knoesen model provided the lowest ZMARE values and most appropriate NSE values across all stations and can therefore be considered the most suitable approach for disaggregating daily rainfall into realistic temporal distributions. An additional finding was that in certain cases the recommended SCS-SA distribution for a station was outperformed by one which was recommended for a different region. This may be explained by some of the stations being located near the edge of one region and thus in close proximity to another region. The average variability method (AVM) and AVM-B approaches, which were adapted from the original application of the AVM in literature, performed exceptionally poorly and are therefore not recommended for use in disaggregation in the forms utilised in this assessment. However, it is noted that the AVM is no longer recommended as a temporal distribution in Australia due to limitations relating to the averaging of the distribution and use of high rainfall periods for its construction.
The limitations of this research study can be attributed to the assumptions made, the methodology used for identifying rainfall days and the modifications made to the RTD approaches for application. The triangular distribution approaches, including the triangular obsTP and triangular median TP, have shown considerable potential for providing a similar temporal distribution to observed daily rainfall in terms of the shape of the distribution when the observed value for the timing of the peak is utilised. Therefore, it is recommended that the approach be further developed using generalised values for the timing of the peak. This will require relationships to estimate the timing of the peak to be derived at regional levels.
ACKNOWLEDGEMENTS
This research formed part of a Master of Science degree which was completed through the Centre for Water Resources Research (CWRR) at the University of KwaZulu-Natal. The Centre and University are greatly acknowledged for provision of funding, office space, data, administrative functions and other assistance during the course of this research. The Water Research Commission (WRC) is acknowledged for the provision of funding for the project which this work formed a part of (WRC Project No. K5/2926). The South African National Committee on Large Dams (SANCOLD) is also acknowledged for the provision of funding in the form of a scholarship.
AUTHOR CONTRIBUTIONS
Ryshan Ramlall is the main author of this publication, which is derived from his Master of Science research at the University of KwaZulu-Natal in Pietermaritzburg from 2019 to 2020. This research formed part of WRC Project No. K5/2926. Professor JC Smithers supervised the research and was part of the WRC project team, providing insight and technical expertise contributing to the methodology of this research.
LIST OF ACRONYMS
AVM average variability method
AVM-B alternative AVM developed using 96 sections of 15-min in duration
BLRP Bartlett-Lewis rectangular pulse
DFE design flood estimation
HRU University of the Witwatersrand Hydrological Research Unit
MARE mean absolute relative error
ZMARE total mean absolute relative error
NSE Nash-Sutcliffe efficiency
RTD rainfall temporal disaggregation
SAWS South African Weather Service
SCS-SA / SCS Soil Conservation Service model South Africa
Triangular triangular distribution developed
median TP using a median time-to-peak
Triangular obsTP triangular distribution developed using observed time-to-peak
ORCID
R Ramlall: https://orcid.org/0000-0002-6954-0086
REFERENCES
ADAMSON PT (1981) Southern African storm rainfall. Technical Report No. TR 133. Department of Water Affairs, Pretoria. [ Links ]
ARNAUD P, FINE JA and LAVABRE J (2007) An hourly rainfall generation model applicable to all types of climate. Atmos. Res. 85 (2) 230-242. https://doi.org/10.1016/j.atmosres.2007.01.002 [ Links ]
BHUIYAN T, RAHMAN A and ABBEY S (2010) Derivation of design rainfall temporal patterns in Australia's Gold Coast region. In: Proceedings of the 2010 International Conference on Information & Knowledge Engineering, 12-15 July 2010, Las Vegas, IKE 113-119. [ Links ]
BONTA JV (2004) Development and utility of Huff curves for disaggregating precipitation amounts. Appl. Eng. Agric. 20 (5) 641-653. https://doi.org/10.13031/2013.17467 [ Links ]
CHOW VT, MAIDMENT DR and MAYS LW (1988) Applied Hydrology (International Edition). McGraw-Hill, Inc, New York. [ Links ]
FROST AJ, SRIKANTHAN R and COWPERTWAIT PSP (2004) Stochastic generation of point rainfall data at subdaily timescales: a comparison of DRIP and NSRP. Cooperative Reseach Centre for Catchment Hydrology, Monash University Australia. [ Links ]
GREEN J, WALLAND D, NANDAKUMAR N and NATHAN R (2005) Temporal patterns for the derivation of PMPDF and PMF estimates in the GTSM region of Australia. Aus. J. Water Resour. 8 (2) 111-121. https://doi.org/10.1080/13241583.2005.11465248 [ Links ]
GÜNTNER A, OLSSON J, CALVER A and GANNON B (2001) Cascade-based disaggregation of continuous rainfall time series: the influence of climate. Hydrol. Earth Syst. Sci. 5 (2) 145-164. https://doi.org/10.5194/hess-5-145-2001 [ Links ]
HASSINI S and GUO Y (2017) Derived flood frequency distributions considering individual event hydrograph shapes. J. Hydrol. 547 296-308. https://doi.org/10.1016/j.jhydrol.2017.02.003 [ Links ]
HINGRAY B and BEN HAHA M (2005) Statistical performances of various deterministic and stochastic models for rainfall series disaggregation. Atmos. Res. 77 (1-4) 152-175. https://doi.org/10.1016/j.atmosres.2004.10.023 [ Links ]
HRU (1972) Design Flood Determination in South Africa. Report No. 1/72. Hydrological Research Unit, Department of Civil Engineering, University of the Witwatersrand. [ Links ]
HUFF FA (1967) Time distribution of rainfall in heavy storms. Water Resour.Res. 3 (4) 1007-1019. https://doi.org/10.1029/wr003i004p01007 [ Links ]
HUFF FA and ANGEL JR (1992) Rainfall frequency atlas of the Midwest. Illinois State Water Survey, Champaign, Illinois. [ Links ]
KNOESEN DM (2005) The development and assessment of techniques for daily rainfall disaggregation in South Africa. Unpublished thesis, School of Bioresources Engineering and Environmental Hydrology, University of KwaZulu-Natal. [ Links ]
KNOESEN DM and SMITHERS JC (2008) The development and assessment of a regionalised daily rainfall disaggregation model for South Africa. Water SA 34 (3) 323-330. https://doi.org/10.4314/wsa.v34i3.180625 [ Links ]
KOSSIERIS P, MAKROPOULOS C, ONOF C and KOUTSOYIANNIS D (2018) A rainfall disaggregation scheme for sub-hourly time scales: Coupling a Bartlett-Lewis based model with adjusting procedures. J. Hydrol. 556 980-992. https://doi.org/10.1016/j.jhydrol.2016.07.015 [ Links ]
KOUTSOYIANNIS D and ONOF C (2001) Rainfall disaggregation using adjusting procedures on a Poisson cluster model. J. Hydrol. 246 (1-4) 109-122. https://doi.org/10.1016/s0022-1694(01)00363-8 [ Links ]
KOUTSOYIANNIS D, ONOF C and HOWARD SW (2003) Multivariate rainfall disaggregation at a fine timescale. Water Resour. Res. 39 (7). https://doi.org/10.1029/2002wr001600 [ Links ]
LAMBOURNE J and STEPHENSON D (1987) Model study of the effect of temporal storm distributions on peak discharges and volumes. Hydrol. Sci. 32 (2) 215-226. https://doi.org/10.1080/02626668709491179 [ Links ]
LI X, MESHGI A, WANG X, ZHANG J, TAY SHX, PIJCKE G, MANOCHA N, ONG M, NGUYEN MT and BABOVIC V (2018) Three resampling approaches based on method of fragments for daily-to-subdaily precipitation disaggregation. Int. J. Climatol. 38 e1119-e1138. https://doi.org/10.1002/joc.5438 [ Links ]
MARSALEK J and WATT WE (1984) Design storms for urban drainage design. Can. J. Civ. Eng. 11 (3) 574-584. https://doi.org/10.1139/l84-075 [ Links ]
MORIASI DN, ARNOLD JG, VAN LIEW MW, BINGNER RL, HARMEL RD and VEITH TL (2007) Model evaluation guidelines for systematic quantification of accuracy in watershed simulations Trans. Am. Soc. Agric. Biol. Eng. 50 (3) 885-900. https://doi.org/10.13031/2013.23153 [ Links ]
NA W and YOO C (2018) Evaluation of rainfall temporal distribution models with annual maximum rainfall events in Seoul, Korea. Water 10 (10) 1468. https://doi.org/10.3390/w10101468 [ Links ]
ORMSBEE LE (1989) Rainfall disaggregation model for continuous hydrological modelling. J. Hydraul. Eng. 115 (4) 507-525. https://doi.org/10.1061/(asce)0733-9429(1989)115:4(507) [ Links ]
PARKES B and DEMERITT D (2016) Defining the hundred year flood: A Bayesian approach for using historic data to reduce uncertainty in flood frequency estimates. J. Hydrol. 540 1189-1208. https://doi.org/10.1016/j.jhydrol.2016.07.025 [ Links ]
PUI A, SHARMA A, MEHROTRA R, SIVAKUMAR B and JEREMIAH E (2012) A comparison of alternatives for daily to sub-daily rainfall disaggregation. J. Hydrol. 470 138-157. https://doi.org/10.1016/j.jhydrol.2012.08.041 [ Links ]
RAMLALL R (2020) Assessing the performance of techniques for disaggregating daily rainfall for design flood estimation in South Africa. MSc thesis, Centre for Water Resources Research, University of KwaZulu-Natal. [ Links ]
RODRIGUEZ-ITURBE I, COX DR and ISHAM V (1987) Some models for rainfall based on stochastic point processes. Proc. R. S. Lond. A 410 (1839) 269-288. https://doi.org/10.1098/rspa.1987.0039 [ Links ]
ROWE TJ and SMITHERS JC (2018) Continuous simulation modelling for design flood estimation - a South African perspective and recommendations. Water SA 44 (4) 691-705. https://doi.org/10.4314/wsa.v44i4.18 [ Links ]
SCHULZE RE (1984) Hydrological models for application to small rural catchments in Southern Africa: Refinements and developments. University of Natal, Pietermaritzburg. [ Links ]
SMITHERS JC (1998) Development and evaluation of techniques for estimating short duration design rainfall in South Africa. Unpublished thesis, Department of Agricultural Engineering, University of Natal, Pietermaritzburg. [ Links ]
SMITHERS JC, PEGRAM GGS and SCHULZE RE (2002) Design rainfall estimation in South Africa using Bartlett-Lewis rectangular pulse rainfall models. J. Hydrol. 258 (1-4) 83-99. https://doi.org/10.1016/s0022-1694(01)00571-6 [ Links ]
SMITHERS JC and SCHULZE RE (2000) Development and evaluation of techniques for estimating short duration design rainfall in South Africa. WRC Report No. 681/1/00. Water Research Commission, Pretoria. [ Links ]
SMITHERS JC and SCHULZE RE (2001) A methodology for the estimation of short duration design storms in South Africa using a regional approach based on L-moments. J. Hydrol. 241 (1-2) 42-52. https://doi.org/10.1016/s0022-1694(00)00374-7 [ Links ]
WALKER S and TSUBO M (2003) Estimation of rainfall intensity for potential crop production on clay soil with in-field water harvesting practices in a semi-arid area. WRC Report No. 1049/1/02 Water Research Commission, Pretoria. [ Links ]
WARD PJ, KUMMU M and LALL U (2016) Flood frequencies and durations and their response to El Nino Southern Oscillation: Global analysis. J. Hydrol. 539 355-378. https://doi.org/10.1016/j.jhydrol.2016.05.045 [ Links ]
WEDDEPOHL JP (1988) Design rainfall distributions for Southern Africa. Unpublished thesis, Department of Agricultural Engineering, University of Natal, Pietermaritzburg. [ Links ]
 Correspondence:
R Ramlall
Email: ryshanramlall@outlook.com
Received: 1 December 2021
Accepted: 28 June 2023

