


Services on Demand
Article
 English (pdf)
 Article in xml format
 Article references
Indicators

Related links
-
 Cited by Google
 -
 Similars in Google
Share

 Permalink
Water SA
On-line version ISSN 1816-7950
Print version ISSN 0378-4738
Water SA vol.49 n.3 Pretoria Jul. 2023
http://dx.doi.org/10.17159/wsa/2023.v49.i3.4058
RESEARCH PAPER
Probabilistic vs deterministic forecasts - interpreting skill statistics for the benefit of users
Willem A LandmanI; Mark TadrossII; Emma ArcherI; Peter JohnstonII
IDepartment of Geography, Geoinformatics and Meteorology, University of Pretoria, Pretoria, South Africa
IIClimate System Analysis Group, University of Cape Town, Cape Town, South Africa
ABSTRACT
Owing to probabilistic uncertainties associated with seasonal forecasts, especially over areas such as southern Africa where forecast skill is limited, non-climatologists and users of such forecasts frequently prefer them to be presented or distributed in terms of the likelihood (expressed as a probability) of certain categories occurring or thresholds being exceeded. Probabilistic forecast verification is needed to verify such forecasts. Whilst the resulting verification statistics can provide clear insights into forecast attributes, they are often difficult to understand, which might hinder forecast uptake and use. This problem can be addressed by issuing forecasts with some understandable evidence of skill, with the purpose of reflecting how similar forecasts may have performed in the past. In this paper, we present a range of different probabilistic forecast verification scores, and determine if these statistics can be readily compared to more commonly known and understood 'ordinary' correlations between forecasts and their associated observations - assuming that ordinary correlations are more intuitively understood and informative to seasonal forecast users. Of the range of scores considered, the relative operating characteristics (ROC) was found to be the most intrinsically similar to correlation.
Keywords: forecast verification, forecast skill, forecast users, relative operating characteristics
INTRODUCTION
There is a limit to the skill with which any forecasts are made. This statement is especially true for those seasonal forecasts that attempt to provide guidance regarding the chance of specific short-term climate changes occurring in the season ahead, owing to the inherent variability of the atmosphere (weather noise), as well as the inability to perfectly replicate all the earth system components in forecast climate models. Even with improvements in numerical models (Bauer et al., 2015), it is still not possible to predict the daily weather changes at a specific location months in advance, due to the chaotic nature of atmospheric circulation. There is, however, some skill in predicting anomalies (the difference between an observed value of a meteorological variable such as a mid-summer rainfall total for a particular year and its long-term average as calculated over many, typically 30, years) in the seasonal average of the weather, and there are many early documented examples that demonstrate this skill, also for South Africa (e.g., Bartman et al., 2003).
The evolution of operational real-time seasonal forecasting in South Africa has its origins in the 1990s, with the development of statistical models (Jury et al., 1999; Landman et al., 1999; Mason, 1998). Global climate models (GCMs) were subsequently introduced (Landman et al., 2001), followed by the combination of multiple model forecasts in the development of operational forecast systems (Landman and Beraki, 2012). Modelling research subsequently showed that the use of fully coupled ocean-atmosphere models provides the best chance of making skillful seasonal forecasts for South Africa, since these coupled models have particularly improved on models' ability to discriminate extreme rainfall seasons from the rest of the seasons (Landman et al., 2012). Up to this point, a clear association with model complexity and forecast skill was demonstrated (see Fig. 6 in Landman 2014), because a fully coupled ocean-atmosphere model produced much higher seasonal forecast skill levels over South Africa than that provided by a linear statistical seasonal forecast model.
Notwithstanding the modelling progress made and the testing of dynamical nesting models for higher horizontal resolution forecasts (Landman et al., 2009), statistical correction methods applied to GCM output may still be recommended for contemporary coupled climate model forecasts (Barnston and Tippett, 2017). This multi-tiered process is still being applied at the South African Weather Service (SAWS) and the University of Pretoria for operational seasonal forecasting, although forecast skill levels over South Africa are limited (Landman et al., 2019) and seem to have plateaued, with only incremental improvements in forecast performance (Landman, 2014). Notwithstanding the scientifically difficult and slow process of improving on the quality of the forecasts, significant work is being undertaken to improve the communication of forecasts and their current skill levels, in order to facilitate forecast uptake and subsequent gains in the value of the forecasts (the benefit that can be obtained based on decisions made in response to the forecasts) (Vincent et al., 2020). For example, selected work has focused on providing forecast users with potential financial implications when forecasts are used in decision-making (Landman et al., 2020a).
Whilst forecast skill levels over South Africa are limited, forecasts may still be considered useful to users of such forecasts over certain regions and during certain times of the year. This realization has driven development of application forecast systems for southern Africa, including for agriculture (Landman et al., 2020a; Malherbe et al., 2014), hydrology (Muchuru et al., 2016) and health (Landman et al., 2020b). It should be noted that application forecasting is not the same as impact-based forecasting. The latter usually provides information required to act prior to an event occurrence (such as a drought) in order to minimize the socio-economic costs of such hazards (often used by those working in the humanitarian sector), while the former revolves around tailoring a forecast for a specific user, decision or management need. Application-based forecasts are tailored seasonal forecasts developed to supplement the usual rainfall and temperature forecasts for the region. However, distributing any type of seasonal forecast data is not sufficient, and attention should also be given to producing estimates of forecast quality (Stockdale et al., 2010).
For example, any forecast should include a statement of the past performances of the model with which the real-time forecasts are made. Seasonal forecasts are, however, most often expressed in terms of probabilities, and it is not possible to provide a simple answer to a typical question ofhow often in the past these forecasts have been found to be correct. This is because there are a number of attributes to consider with probability forecasts in order to ascertain their skill. The main attributes are: (i) discrimination (are the forecasts discernibly different given different outcomes?); (ii) reliability (is the confidence that is communicated in the forecast appropriate?); (iii) resolution (is there any usable information in the forecast?); and (iv) sharpness (what is the degree to which the forecasts depart from the climatology?) (Trocolli et al., 2008).
Seasonal forecast system development and subsequent verification work in South Africa has, traditionally, focused primarily on the various forecast systems' discrimination and reliability attributes (Landman, 2014; Landman and Beraki, 2012; Landman et al., 2012, 2014, 2020b). Both of these attributes are graphical procedures (as demonstrated for discrimination in the results section below and in the references listed here), and are the most commonly used procedures of this type for estimating forecast quality (Trocolli et al., 2008). There is no formally recognised mathematical definition of sharpness, although good probability forecasts will have good reliability, as well as high resolution and, implicitly, high sharpness (Trocolli et al., 2008). We need to also consider the notion that a forecast user struggles to distinguish between a 70% probability of a wet season and a 55% probability of a wet season (Salsburg, 2001). Thus sharpness as a forecast attribute may not be of much interest to such users and is subsequently not discussed further. Moreover, the attributes of discrimination, reliability and resolution represent the most essential aspects of probabilistic forecast quality (Jolliffe and Stephenson, 2012). For discrimination, we want to measure the ability of the forecasts to distinguish an event from a non-event. In terms of reliability and resolution calculations, we will consider the algebraic decomposition of the Brier score that includes reliability and resolution (Mason, 2004). It is important here to note that reliability quantifies how well forecast probabilities match the corresponding observed frequencies in magnitude, and resolution measures how different these observed frequencies are from the climatological probability (which is 33.3% in this case of equi-probable categories) (Wilks, 2019).
The range of attributes of a forecast system suggests that there are a variety of ways for forecasts to be good or poor. There is, thus, no single answer to the question of which scoring method best measures each attribute. However, for the sake of non-scientists, it may be appropriate to see if there is a correspondence among the various scores and 'ordinary' correlation, since correlation is the simplest measure of skill, and the simplest and traditional method to seek associations between variables. This seems appropriate given that the most commonly used metric to calculate how well forecasts match observed values is the correlation coefficient (Troccoli et al., 2008). Moreover, even data analysts, among others, almost automatically, albeit somewhat uncritically, calculate a correlation coefficient when they want to obtain a measure of the linear association between two variables. Further, many scientists and non-scientists frequently use the word correlation to describe how two things are linearly related, since this is quite a simple quantity to evaluate and understand; it has wide use and hence familiarity.
Since most people are familiar with the concept of correlation, linking correlations with probabilistic scores could provide users with a simple metric to understand whether a particular probabilistic score is high or low, as well as what that might approximately mean in terms of how well the forecast performs. The use of the term correlation coefficient in this paper refers to the Pearson product-moment coefficient of linear correlation between two variables. It is essential to note here that there are other correlation coefficients (i.e., Spearman rank correlation and Kendall's tau (Wilks, 2019)), but the Pearson correlation is by far the most widely used. The purpose of the study is to find if there may be statistical links between the more easily understandable Pearson correlation and probabilistic scores that are more complicated to understand (e.g., Barnston, 1992).
DATA AND METHOD
In order to establish a link between correlation and probabilistic verification scores, we first need to generate hindcasts (re-forecasts) over a long period spanning several decades from where the scores can be obtained. Seasonal forecasts are not equally skillful everywhere, and southern Africa's seasonal rainfall predictability more or less ranks in the middle third of regions globally that are affected by the El Nino-Southern Oscillation (ENSO) (Landman et al., 2019). The central Pacific Ocean is one of the areas with the highest levels of seasonal predictability (Latif et al., 1994). We therefore consider the predictability over three areas: (i) rainfall over the Limpopo River basin (an area strongly linked with ENSO and associated with relatively high seasonal forecast skill); (ii) rainfall over the Philippines (closer to and therefore more readily influenced by ENSO); and (iii) sea-surface temperatures (SSTs) over the central Pacific Ocean (directly influenced by ENSO). Of the three regions, the central Pacific Ocean has the highest predictability, followed by the Philippines and the Limpopo River basin (Landman et al., 2019). By considering forecast skill levels over these three regions, we are thus able to cover a large range of forecast skill. Our focus season is December, January and February (DJF), which is a season associated with high predictability over all three regions (Landman et al., 2019; Trocolli et al., 2008).
Data
Two types of datasets are used. The first is archived seasonal rainfall forecast data produced by a GCM of the North American Multi-Model Ensemble project (NMME; Kirtman et al., 2014), and the second type are observed gridded datasets. The latter includes monthly rainfall totals as represented by the Climatic Research Unit (CRU; Harris et al., 2021) dataset, as well as extended reconstructed SST data, version 5 (ERSST.v5; Huang et al. 2017).
The GCM data are 12-member ensemble monthly hindcast data of the GFDL-CM2.5-FLOR-B01, available from the early 1980s to 2020 at a 1 χ 1° latitude-longitude resolution. Only 1-month lead-time hindcast data are considered.
Method
We consider two types of forecast models - one that includes the statistical post-processing of GCM output by correcting the systematic biases in the mean and variance of the data (Landman et al., 2019), and a second linear statistical model for SST predictions (Landman and Mason, 2001). The GCM rainfall hindcasts are corrected with a regression-based algorithm from the Climate Predictability Tool (CPT; Mason et al., 2022). The bias adjustments are performed using a 5-year-out cross-validation process applied to the hindcasts. The 3-month focus season is DJF. For the 1-month lead-time considered here in predicting DJF rainfall from the GCM, the model was initialized on 1 November. For DJF SST hindcasts, the 1-month lead-time forecast use observed August, September and October (ASO) SST fields as predictors since ASO SSTs only become available later in November.
As mentioned earlier, seasonal forecasts should be expressed probabilistically due to weather noise and the fact that forecast models are imperfect. Moreover, such probabilistic forecasts exhibit considerably higher reliability in comparison with those achieved by corresponding deterministic forecasts (Murphy, 1998). Here we create 30 years of probabilistic hindcasts (1990/91 to 2019/20) through a retro-active forecast process (Landman et al., 2020). For both the GCM rainfall hindcast bias corrections and the statistical model for SST hindcasts, the initial training period for the retro-active process is 10 years (1980/81 to 1989/90) in order to create the 30 years of probabilistic forecasts. This 10-year period is used to predict the 1990/91 season. After this step, 11 years (1980/81 to 1990/91) are used to train the models to predict for the 1991/92 season, etc. The training period is thus updated by 1 year after each step and the process is continued until the 30 years of probabilistic hindcasts have been created. The number of grid-points involved with each region is 182 for the central Pacific Ocean, 181 for the Philippines, and 180 for the Limpopo River basin. The three areas are therefore of similar size, and the total number of grid-points considered is 543. Each grid-point thus has reliability, resolution and ROC values, as well as a Pearson correlation value. The latter is simply the ordinary correlation between 30 years of hindcasts and the corresponding observations, and thus constitutes the deterministic correlation score at each grid-point. The probabilistic scores are calculated for three equi-probable categories of above-normal, near-normal, and below-normal values.
RESULTS
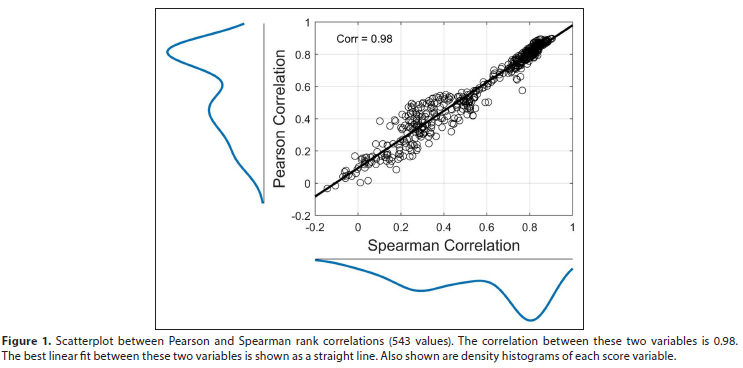
After the calculation of the probabilistic and deterministic scores for each grid-point is completed, all of the 543 grid-point values are plotted on scatterplots between different scores, as well as a best-fit straight line. An example of such a scatterplot is shown in Fig. 1, which represents the association between two deterministic scores, i.e., the Pearson and Spearman rank correlation as determined over the 30 years. The correlation between these two sets of scores is 0.98. Similar plots that represent the association between the probabilistic (x-axis) and deterministic (Pearson correlation; y-axis) scores are constructed and the correlation between the probabilistic and deterministic scores are calculated. Although the scatterplots are not shown here, Table 1 is a summary of the correlations between each of the scores.
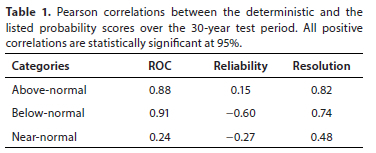
The correlations in Table 1 imply that the discrimination (ROC) and resolution attributes of the probability forecasts are intrinsically most similar to deterministic skill values (as represented by ordinary and, by extension, ranked correlation), while reliability appears to be fundamentally different to deterministic assessments of forecast quality. There may, in fact, not be a relationship between probabilistic reliability and correlation skill (Yang et al., 2018), and the correlations are seen in the table to be the highest for the outer two categories, i.e., above-and below-normal values. Near-normal is a category for which forecasts in general do not seem to work very well, especially when forecast skill is limited (Mason et al., 2021), hence the low association of this category's scores and deterministic skill.
Given that discrimination and resolution seem to be very similar attributes for determining skilful probabilistic forecasts using correlations, and that it is easier to measure discrimination than resolution in 3-category probabilistic systems (Mason, 2018), we will continue our discussion by only considering discrimination.
As stated above, discrimination is represented by relative operating characteristics (ROC values). These values are calculated from the ROC diagram. This diagram is a plot with the false alarm rate on the horizontal axis, and the hit rate on the vertical axis. A false alarm is when an event (such as a drier than normal period) was forecast to occur but did not. The false alarm rate represents the ratio of false alarms to the total number of times the event, such as a drier than normal period, did not occur. Finally, the hit rate is the ratio of correct forecasts to the number of times this event occurred. A ROC graph is constructed by plotting the hit rates against the false-alarm rates and is separately applied to above-normal and below-normal probabilistic forecasts. By using this verification method, it can be shown that the forecast model has the ability to discriminate above-normal seasons from the rest of the seasons or below-normal seasons from the rest of the seasons (see Fig. 2 that represents a fictitious example). The diagonal dashed line on the graph divides the graph into two equal parts, each with an area of 0.5, and indicates the line of no-skill. If the forecasts are good, the ROC graph will curve towards the upper left. In the unlikely case of perfect discrimination, the curve will reach the top left corner, and the resulting area is equal to 1. In Fig. 2, the area underneath the ROC curve is equal to 0.73 -showing that the above-normal forecasts in this example have skill because of this high ROC value.
The real data results of least-squares regression analysis with ROC and correlation values at all the grid-points, as obtained from the 30-years of verification, are shown in Fig. 3. Here we first discuss both the above-normal and below-normal categories as the 'explanatory' variables, and Pearson correlations as the 'target' variable. Regression analysis can quantify the nature and strength of the relationship between two variables, and in this case the linear relationship strength is reflected in the correlation between, respectively, the above-normal and below-normal ROC scores, and the correlation scores as 0.88 and 0.91 (Table 1). Take note that the two least-square lines of Fig. 3 do not precisely fall on top of each other, but differ in slope by a small amount (not significantly different). This difference in slope is likely to be attributed to the small sample of verification cases (only 30 years) typical of seasonal forecasting, so that the selection of verification period potentially influences perceived forecast skill (Landman et al., 2020).
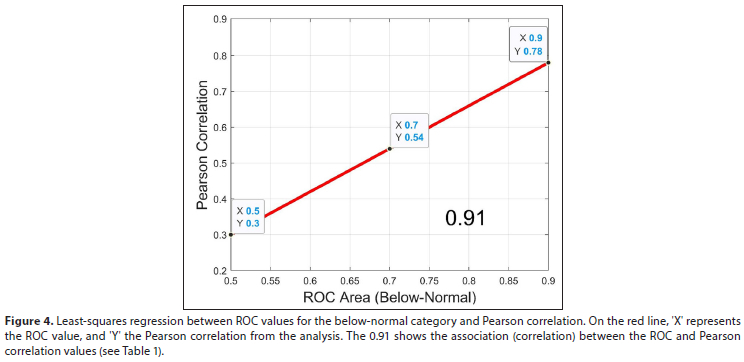
In Fig. 4, the correlation value of 0.91 (also see Table 1) shows that the two variables are strongly related. The red line on Fig. 4 is a section of the 'below-normal' line of Fig. 3. Also shown on Fig. 4 are pre-selected ROC values and their corresponding Pearson correlation values. The latter are calculated by using the least-squares regression equation that represents the red line obtained from the analysis. So, for a ROC value greater than 0.5, the Pearson correlation will be higher than 0.3; for a ROC value of 0.7 the corresponding correlation value is about 0.5; and for a ROC value of 0.9 the correlation is about 0.8. Additional analysis involving the above-normal ROC values produced similar results (not shown): for a ROC value greater than 0.5, the Pearson correlation will be higher than 0.23; for a ROC value of 0.7 the corresponding correlation value is again at about 0.5; and for a ROC value of 0.9 the correlation is 0.85.
DISCUSSION
The uptake and application of seasonal forecasts has been the subject of much research attention, and often concerns the salience, credibility, and legitimacy of seasonal climate forecasts (Meinke et al., 2006). We agree that, aside from availability and access, comprehension and usefulness as well as trust in the forecast is of utmost importance. Part of the trust issue for users, whether they are farmers, water sector practitioners or municipal decision makers, is understanding probability, which reveals an element of uncertainty, but a further element is that of being given an indication of skill, which conveys the likelihood the forecast has of being statistically correct in its probability distributions. Globally there are multiple resources users can access, some of which can be applied at a regional scale, but in most cases, users rely on the regionally available forecasts that usually originate from the national 'met' services of their country. Few of these have any skill scores attached to them. As forecasts are often interpreted and disseminated by 'boundary organisations' or intermediaries, or more recently used to trigger 'anticipatory actions' by humanitarian actors, the skill implications and probabilities are often lost, or overlooked, and the forecast is passed on as a deterministic prediction. This remains a concern.
The science of seasonal forecasting has made significant advances in recent decades, including the development of sophisticated and skilful forecasting systems and the development of tailored forecasts. However, such advances remain insufficient for optimal forecast uptake and estimates of forecast quality are essential to build trust in the forecasts. This is challenging, given that forecasts are of a probabilistic nature and their quality needs to be judged accordingly, and there are a number of non-intuitive attributes that need to be considered in order to judge if probabilistic forecasts are useful. Our analysis considers those attributes related to discrimination, reliability and resolution, and how they may be understood in terms of a more relatable and intuitive metric. These three attributes represent the most essential aspects of probabilistic forecast quality. In order to establish to which extent probabilistic scores can be considered high or low, we tried to demonstrate how that may correspond to more easily understood 'ordinary' correlation.
Our analyses show that the discrimination and resolution attributes of the probabilistic forecasts are similar to the deterministic assessment (i.e., correlations) of forecast quality. This similarity is mostly restricted to the outer two categories, namely, below- and above-normal. However, since discrimination is easier to measure, our focus turned to ROC scores for the remainder of the work. For ROC values at the lowest limit of skill (i.e., ROC = 0.5), correlations are typically below 0.3; for high ROC values of 0.9, correlations are near 0.8. Although ROC has thus been demonstrated here to be potentially very helpful to users in understanding forecast skill, the ROC graph is ignoring the reliability of the forecasts. Notwithstanding, the ROC graph has an advantage over the reliability diagram in being less sensitive to the small sample sizes typical of seasonal forecasting. Therefore, in terms of the results found here, as well as challenges faced in seasonal forecast verification, although ROC values might seem like a fairly esoteric measure of forecast skill, there is often a close association with the more easily understood correlation measure.
There is no single metric that can fully represent the quality of a set of forecasts - a notion also demonstrated in this paper, the result of forecast verification effectively being a multifaceted problem (Troccoli et al., 2008). However, especially for areas such as southern Africa where seasonal forecast skill is limited, such forecasts should be accompanied by an indication of how similar forecasts have performed in the past. Here we argued that some probabilistic verification scores can be represented by a more commonly known metric such as 'ordinary' correlation, which may aid users of forecasts to better assimilate verification data into their decision-making processes.
ACKNOWLEDGMENTS
The work is supported by the National Research Foundation (NRF) of South Africa through the APECX project funded by the NRF (Grant No: 136477). We acknowledge the agencies that support the NMME-Phase II system, and we thank the climate modeling groups (Environment Canada, NASA, NCAR, NOAA/ GFDL, NOAA/NCEP, and University of Miami) for producing and making available their model output. NOAA/NCEP, NOAA/ CTB, and NOAA/CPO jointly provided coordinating support and led development of the NMME-Phase II system.
AUTHOR CONTRIBUTIONS
WL - statistical modelling, verification and writing of the initial draft; MT - writing and editing; EA - writing and editing; PJ - writing and editing.
ORCIDS
Willem A Landman: https://orcid.org/0000-0002-9475-6655
Mark Tadross: https://orcid.org/0000-0002-7018-404X
Emma Archer: https://orcid.org/0000-0002-5374-3866
Peter Johnston: https://orcid.org/0000-0003-3329-0334
REFERENCES
BARNSTON AG (1992) Correspondence among the correlation, RMSE, and Heidke forecast verification measures; refinement of the Heidke score. Weath. Forecast. 7 699-709. https://doi.org/10.1175/1520-0434(1992)007<0699:CATCRA>2.0.CO;2 [ Links ]
BARNSTON AG and TIPPETT MK (2017) Do statistical pattern corrections improve seasonal climate predictions in the North American Multimodel Ensemble models? J. Clim. 30 8335-8355. https://doi.org/10.1175/JCLI-D-17-0054.1 [ Links ]
BARTMAN AG, LANDMAN WA and RAUTENBACH CJdeW (2003) Recalibration of general circulation model output to austral summer rainfall over southern Africa. Int. J. Climatol. 23 1407-1419. https://doi.org/10.1002/joc.954 [ Links ]
BAUER P, THORPE A and BRUNET G (2015) The quiet revolution of numerical weather prediction. Nature 525 (7567) 47-55. https://doi.org/10.1038/nature14956 [ Links ]
COELHO CAS, STEPHENSON DB, BALMASEDA M, DOBLAS-REYES FJ and VAN OLDENBORGH GJ (2006) Towards an integrated seasonal forecasting system for South America. J. Clim. 19 3704-3721. https://doi.org/10.1175/JCLI380L1 [ Links ]
HARRIS IC, JONES PD, OSBORN T (2021) CRU TS4.05: Climatic Research Unit (CRU) Time-Series (TS) version 4.05 of highresolution gridded data of month-by-month variation in climate (Jan. 1901 - Dec. 2020). NERC EDS Centre for Environmental Data Analysis. URL: https://catalogue.ceda.ac.uk/uuid/c26a65020a5e4b80b20018f148556681 (Accessed 3 July, 2023). [ Links ]
HUANG B, THORNE PW, BANZON VF, BOYER T, CHEPURIN G, LAWRIMORE JH, MENNE MJ, SMITH TM, VOSE RS and ZHANG H-M (2017) Extended reconstructed sea surface temperature, version 5 (ERSSTv5): Upgrades, validations, and intercomparisons. J. Clim. 30 8179-8205. https://doi.org/10.1175/JCLI-D-16-0836.1 [ Links ]
JOLLIFFE IT and STEPHENSON DB (2012) Forecast Verification: A Practitioner's Guide in Atmospheric Science (2nd edn). Wiley, New York. 274 pp. https://doi.org/10.1002/9781119960003 [ Links ]
JURY MR, MULENGA HM and MASON SJ (1999) Exploratory longrange models to estimate summer climate variability over southern Africa. J. Clim. 12 1892-1899. https://doi.org/10.1175/1520-0442(1999)012<1892:ELRMTE>2.0.CO;2 [ Links ]
KIRTMAN BP, MIN D, INFANTI JM, KINTER III JL, PAOLINO DA, ZHANG Q, VAN DEN DOOL H, SAHA S, PENA MENDEZ M, BECKER E and co-authors (2014) The North American multimodel ensemble: phase-1 seasonal to-interannual prediction; phase-2 toward developing intraseasonal prediction. Bull. Am. Meteorol. Soc. 95 585-601. https://doi.org/10.1175/BAMS-D-12-00050.1 [ Links ]
LANDMAN WA (2014) How the International Research Institute for Climate and Society has contributed towards seasonal climate forecast modelling and operations in South Africa. Earth Perspect. 1 22. https://doi.org/10.1186/2194-6434-1-22 [ Links ]
LANDMAN WA and BERAKI A (2012) Multi-model forecast skill for midsummer rainfall over southern Africa. Int. J. Climatol. 32 303-314. https://doi.org/10.1002/joc.2273 [ Links ]
LANDMAN WA and MASON SJ (2001) Forecasts of near-global sea-surface temperatures using canonical correlation analysis. J. Clim. 14 3819-3833. https://doi.org/10.1175/1520-0442(2001)014<3819:FONGSS>2.0.CO;2 [ Links ]
LANDMAN WA, BERAKI A, DEWITT D and LÖTTER D (2014) SST prediction methodologies and verification considerations for dynamical mid-summer rainfall forecasts for South Africa. Water SA 40 (4) 615-622. https://doi.org/10.4314/wsa.v40i4.6 [ Links ]
LANDMAN WA, BARNSTON AG, VOGEL C and SAVY J (2019) Use of El Nino-Southern Oscillation related seasonal precipitation predictability in developing regions for potential societal benefit. Int. J. Climatol. 39 5327-5337. https://doi.org/10.1002/JOC.6157 [ Links ]
LANDMAN WA, ARCHER ERM and TADROSS MA (2020a) Citizen science for the prediction of climate extremes in South Africa and Namibia. Front. Clim. 2 5. https://doi.org/10.3389/fclim.2020.00005 [ Links ]
LANDMAN WA, SWEIJD N, MASEDI N and MINAKAWA N (2020b) The development and prudent application of climate-based forecasts of seasonal malaria in the Limpopo province in South Africa. Environ. Dev. 35 100522. https://doi.org/10.1016/j.envdev.2020.100522 [ Links ]
LANDMAN WA, DEWITT D, LEE D-E, BERAKI A. and LÖTTER D (2012) Seasonal rainfall prediction skill over South Africa: 1- vs. 2-tiered forecasting systems. Weath. Forecast. 27 489-501. https://doi.org/10.1175/WAF-D-11-00078.1 [ Links ]
LANDMAN WA, KGATUKE MM, MBEDZI M, BERAKI A, BARTMAN A and DU PIESANIE A (2009) Performance comparison of some dynamical and empirical downscaling methods for South Africa from a seasonal climate modelling perspective. Int. J. Climatol. 29 1535-1549. https://doi.org/10.1002/joc.1766 [ Links ]
LATIF M, BARNETT MA, CANE M, FLÜGEL M, GRAHAM NE, VON STORCH H, XU J-S and ZEBIAK SE (1994) A review of ENSO prediction studies. Clim. Dyn. 9 167-179. https://doi.org/10.1007/BF00208250. [ Links ]
MALHERBE J, LANDMAN WA, OLIVIER C, SAKUMA H and LUO J-J (2014) Seasonal forecasts of the SINTEX-F coupled model applied to maize yield and streamflow estimates over north-eastern South Africa. Meteorol. Appl. 21 733-742. https://doi.org/10.1002/met.1402 [ Links ]
MASON SJ (1998) Seasonal forecasting of South African rainfall using a non-linear discriminant analysis model. Int. J. Climatol. 18 147-164. https://doi.org/10.1002/(SICI)1097-0088(199802)18:2<147::AID-JOC229>3.0.CO;2-6 [ Links ]
MASON SJ (2004) On using "climatology" as a reference strategy in the Brier and ranked probability skill scores. Monthly Weath. Rev. 132 1891-1895. DOI: https://doi.org/10.1175/1520-0493(2004)132<1891:OUCAAR>2.0.CO;2. [ Links ]
MASON SJ (2018) Guidance on verification of operational seasonal climate forecasts. World Meteorological Organization Report No. 1220. WMO, Geneva. 66 pp. [ Links ]
MASON SJ, FERRO CAT and LANDMAN WA (2021) Forecasts of "normal". Q. J. R. Meteorol. Soc. 147 (735) 1225-1236. https://doi.org/10.1002/qj.3968 [ Links ]
MASON SJ, TIPPETT MK, SONG L and MUNOZ AG (2022) Climate Predictability Tool version 17.7.8. Columbia University Academic Commons. https://doi.org/10.7916/r5bf-1x73 [ Links ]
MEINKE H, NELSON R, KOKIC P, STONE R, SELVARAJU R and BAETHGEN W (2006) Actionable climate knowledge: from analysis to synthesis. Clim. Res. 33 101-110. https://doi.org/10.3354/cr033101 [ Links ]
MURPHY AH (1998) The early history of probability forecasts: some extensions and clarification. Weath. Forecast. 13 5-15. https://doi.org/10.1175/1520-0434(1998)013<0005:TEHOPF>2.0.CO;2 [ Links ]
MUCHURU S, LANDMAN W and DEWITT D (2016) Prediction of inflows into Lake Kariba using a combination of physical and empirical models. Int. J. Climatol. 36 2570-2581. https://doi.org/10.1002/joc.4513 [ Links ]
SALSBURG D (2001) The Lady Tasting Tea: How Statistics Revolutionized Science in the Twentieth Century. W.H. Freeman and Company, New York. 340 pp. [ Links ]
STOCKDALE TN, ALVES O, BOER G, DEQUE M, DING Y, KUMAR A, LANDMAN W, MASON SJ, NOBRE P, SCAIFE A, TOMOAKI O and YUN WT (2010) Understanding and predicting seasonal-to-interannual climate variability - the producer perspective. Proced. Environ. Sci. 1 55-80. https://doi.org/10.1016/j.proenv.2010.09.006 [ Links ]
TROCCOLI A, HARRISON M, ANDERSON DLT and MASON SJ (2008) Seasonal Climate: Forecasting and Managing Risk. NATO Science Series. Earth and Environmental Sciences Vol 82. Springer, Dordrecht. 467 pp. https://doi.org/10.1007/978-1-4020-6992-5 [ Links ]
VINCENT K, ARCHER E, HENRIKSSON R, PARDOE J and MITTAL N (2020) Reflections on a key component of co-producing climate services: defining climate metrics from user needs. Clim. Serv. 20 100204. https://doi.org/10.1016/jxliser.2020.100204 [ Links ]
WILKS DS (2019) Statistical Methods in the Atmospheric Sciences (4th edn). Academic Press, Amsterdam. 676 pp. [ Links ]
YANG D, YANG X-Q, YE D, SUN X, FANG J, CHU C, FENG T, JIANG Y, LIANG J, REN X, ZHANG Y and TANG Y (2018) On the relationship between probabilistic and deterministic skills in dynamical seasonal climate prediction. J. Geophys. Res. Atmos. 123 5261-5283. https://doi.org/10.1029/2017JD028002 [ Links ]
 Correspondence:
Willem A Landman
Email: Willem.Landman@up.ac.za
Received: 20 February 2023
Accepted: 30 June 2023

