


Services on Demand
Article
 English (pdf)
 Article in xml format
 Article references
Indicators

Related links
-
 Cited by Google
 -
 Similars in Google
Share

 Permalink
Water SA
On-line version ISSN 1816-7950
Print version ISSN 0378-4738
Water SA vol.49 n.2 Pretoria Apr. 2023
http://dx.doi.org/10.17159/wsa/2023.v49.i2.3942
RESEARCH PAPER
Estimation of the 2D cross-sectional area of the wetting pattern under drip irrigation and spatio-temporal variation of the components of the wetting pattern
Murat Kilic
Department of Agricultural Structures and Irrigation, Faculty of Agriculture, Ege University, Bornova, Izmir, Turkey
ABSTRACT
The wetting pattern which occurs under surface drip irrigation is an important component for the optimum design of the system and for irrigation programming. The aim of this investigation was to devise a model which enables estimation of the 2D cross-sectional area of the wetting pattern which occurs under a surface dripper by an analytical method. The main parameters of the wetting pattern are the wetting diameter on the soil surface, the maximum wetted depth and maximum wetted width in the soil profile, and the depth of this maximum wetted width from the soil surface. In the laboratory experiments, water applications were carried out on two soil textures (clay loam and clay) with homogeneous soil profiles at two discharge rates over 125 min and 170 min periods. The sizes of the parameters of the wetting pattern were measured as consecutive series over 5-min intervals during the water application period. The general/main shape which represents the wetting patterns which occur under different irrigation conditions was defined and mathematically modelled. When the results were evaluated statistically, a correlation of 0.9128 was found between the momentary rates of change of the maximum depth of the wetting pattern predicted by the model and those measured in the experiment. The correlation between the momentary variations of accelerations of the same parameter was 0.9205. In addition, the size of the wetting pattern showed an increment in reducing velocities during the water application period. The results indicate that the model devised in this investigation can be used in the prediction of the cross-sectional area of the wetting pattern which occurs under a surface dripper.
Keywords: drip irrigation system, wetting pattern, 2D mathematical modelling, water movement in soil, analytical solution, spatio-temporal variation of wetting pattern
INTRODUCTION
The wetting pattern is an important factor to consider when designing and managing a drip irrigation system. The dimensions of the pattern are imperative in selecting the right spacing between drippers and a suitable distance between laterals (Al-Ogaidi et al., 2016). The movement of water in soils involves a number of physical processes. The simplest physical description of a porous medium in general, and of soils in particular, is that of a solid matrix made of grains with interconnected pores forming channels through which fluids flow (Parlange, 1974). Considering the complexity of the physical phenomena involved, attention over the past 50 years has been focused on techniques to model the soil moisture transfer using a variety of methods. Enhanced by advances in computers, mathematical modelling has recently been applied to various classes of problems in irrigated fields. A number of models have been developed for use in drip irrigation systems (Ghali, 1989; Rolston et al., 1991; Angelakis et al., 1993; Colombo and Or, 2006; Wang et al., 2006). However, there remains the need for models to simulate the combined, and in some cases, simultaneous processes of water entry and multi-dimensional moisture redistribution in soil (Ghali, 1989).
In drip irrigation, only a part of the field is wetted, typically at a high frequency. This results in complex multi-dimensional moisture transfer patterns which are influenced by field and operating conditions (Ghali, 1989; Simunek et al., 1999; Singh et al., 2006; Raine et al., 2007; Elmaloglou and Malamos, 2007; Elmaloglou and Diamantopoulos 2008; Bhatnagar and Chauhan, 2008; Souza et al., 2009; Kandelous and Simunek, 2010a; Soulis et al., 2015; Qin et al., 2016; Dos Santos et al., 2016; Abuarab et al., 2020). Depth and width dimensions of the wetted volume under drip irrigation are of considerable practical importance. The depth dimension should coincide with the depth of the root system while the wetted radius should be related to the spacing between drippers and lines. Numerical or analytical solutions of flow problems for drip irrigation have been obtained considering a constant radius disc source. Similarly, the models developed for disc infiltrometers may also be extended to drip irrigation. However, such models with constant disc radius are applicable only under the special conditions of long time irrigation, or soil water movement after irrigation is cut off (Bhatnagar and Chauhan, 2008).
Width and depth of the wetted soil volume under the drip irrigation was estimated by Elmaloglou and Malamos (2007), considering evaporation and root water uptake. The numerical results were obtained by using a cylindrical flow model. This approach describes the local infiltration from a surface point source. However, the maximum width of the wetting front nearly always occurs under the soil surface. Under a dripper, the flow of water in unsaturated soil takes place from a disc source with a radius which changes with time. Bhatnagar and Chauhan (2008) developed an unsteady, nonlinearised numerical model in order to estimate the wetting pattern under a surface dripper. An oblate spheroidal coordinate system was used in this process. Souza et al. (2009) conducted experiments to characterize the dynamics of soil solution within the wet bulb formed by drip irrigation. These investigations were carried out by considering the symmetrical wetting pattern approach.
The infiltration and redistribution of soil moisture under a surface dripper was investigated by Elmaloglou and Diamantopoulos (2009). The experiments were carried out on soils with loamy sand and silt loam textures. A cylindrical flow model was used in this process. Lazarovitch et al. (2009) presented an artificial neural network (ANN) technology for modelling of subsurface water distribution under drip irrigation. This approach was an alternative to a physically based modelling process. In order to prepare the input-output functional relations from a database, three options were explored. The numerical model HYDRUS-2D was used in creation of the database files. However, a wetted area pattern was not described analytically under a surface dripper. The assumption that an irrigation event from point sources could be approximated as an infinite line source was investigated by Elmaloglou et al. (2010). The point and line drip irrigations were simulated by two existing mathematical models. However, relative rate of change and acceleration values of the components of the wetted area pattern in a drip irrigation system were not described in temporal and spatial dimensions. The accuracy of several approaches used to estimate the dimensions of the wetting zone in drip irrigation were evaluated by Kandelous and Simunek (2010b). The predictions of different approaches were compared with field and laboratory data. The analytical Wet Up software, the numerical HYDRUS-2D model and selected empirical models were used in this process. A numerical model was developed by FuQiang et al. (2011) for two-dimensional soil water movement under drip irrigation conditions. The 2D Richards equation was used in description of the physical process of soil water movement. The upper boundary of the model was described by the improved moving ponded area boundary. However, the wetted area pattern in the drip irrigation system was not described analytically.
One of the most important aspects of the planning and management of a drip irrigation system is the determination of the soil moisture patterns formed under the dripper. The soil water dynamics under a surface dripper were investigated by Elmaloglou et al. (2013). A simulation model was used in defining the equidistant line sources in the wetting pattern. This approach combines water extraction by roots, hysteresis in the soil water characteristic curve and evaporation from the soil surface. The soil moisture distribution patterns in surface and subsurface drip irrigation were investigated by Badr and Abuarab (2013). The neutron scattering technique was used in sandy soil conditions. The Surfer model was run in assessing the water distribution uniformity. The principal relationships influencing the distribution of moisture content in a soil profile in drip irrigation were investigated by Kuklik and Hoang (2014). The wetted soil volume was determined by conducting field experiments. However, the wetted area pattern was not described in these investigations.
Al-Ogaidi et al. (2016) conducted laboratory experiments with surface drip irrigation. An empirical model was developed to estimate the vertical and horizontal advance of the wetting front at different application times. The empirical model includes estimation of the wetted radius at the soil surface and the depth of the wetting pattern as a function of application time. The 3D volumetric wetting pattern under surface dripper was investigated by Kilic (2020). The components of the wetting pattern were described analytically. An analytical approach was developed by Hammami and Zayani (2016) in order to estimate the wetted soil volume under drip irrigation. The model was based on three components: (i) the hypothesis that the bulb keeps a semi-elliptical shape whose diagonals are merged with the symmetry axis and the soil surface, (ii) the Green and Ampt assumption, and (iii) the inference of the wetted soil depth from the radius of the moist area at the ground surface. However, the wetting front of the drippers in the soil profile does not have a semi-elliptical shape, and the maximum width of the wetting front may occur under the soil surface.
Spatio-temporal variations of the components of the wetting pattern in a drip irrigation system allow determination of the relationships between their relative rates of change. Thus, the entire wetting pattern can be defined as a function of time. This allows the description of the wetting pattern which occurs at any elapsed time t0 from the start of irrigation. The aim of this investigation was to devise an analytical model to estimate the 2D cross-sectional area of the wetting pattern under a surface dripper. In addition, relative rates of change of components of the wetting pattern were evaluated in modelling the system.
MATERIALS AND METHODS
The experiments were carried out in the Hydraulic Laboratory of the Department of Agricultural Structures and Irrigation in the Faculty of Agriculture in Ege University, Bornova, Izmir, Turkey. The investigation was carried out in three main stages. The first was laboratory experiments, the second model definition and parameterization, and the third the model validation.
The first stage of the investigation was handled in two subcategories. The first was the visual description of the wetting pattern in the soil profile for different times, and the second was the measurement of the dimensions of the components constituting the wetting pattern at set 5-min intervals. For this purpose, an experiment was designed in order to perform the consecutive measurements. The soil samples were taken from an agricultural area, and physical and chemical features were analysed in the laboratory.
The soil sample was prepared for the experiment. First, it was kept under dry air conditions until it acquired the characteristics of the medium. Then, the soil sample was crumbled by keeping its granular structure. After that, it was put in a specially designed glass container (Watson et al., 1995; Al-Ogaidi et al., 2016). The width, height and horizontal depth of the container were 65 cm, 55 cm and 7 cm, respectively. The available soil moisture was determined in the laboratory, before supplying water from the point source to the soil. Moisture content of the soil as percentage of volume at the beginning of the experiment (Pv) was 6.97%. Some of the physical and chemical features of the soil sample which were important for irrigation were as follows: pH = 7.71, salinity 0.797 dS/m, lime = 18.12%, organic matter = 0.86%, texture = clay loam, bulk density = 1.30 g/cm3, aggregate stability = 45.82%.
In the next stage, water was supplied to the soil surface at a discharge rate of 2.4 L/h. The measured container method was used in determining the flow rate of water supplied to the soil, with 3 repetitions. Real-time video records were taken over a period of 125 min in the experiment. The dimensions of the components of the wetting pattern were measured every 5-min over the 125 min period. The experimental design of the investigation is shown in Fig. 1.
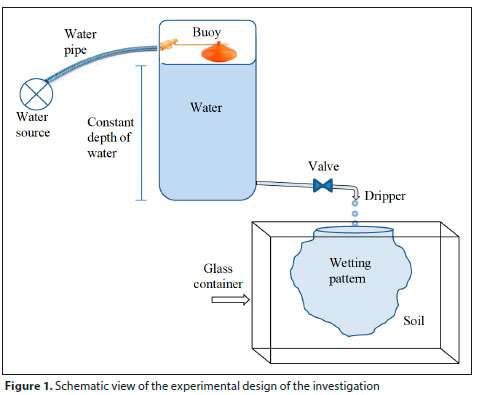
Description of models for the wetting pattern of the drip irrigation system
The main components of the wetting pattern are the wetted diameter on the soil surface at any time during the water application period, the maximum wetted depth and maximum wetted width in the soil profile, and the depth of this maximum wetted width from the soil surface.
The maximum width of the wetting pattern occurred under the soil surface. In addition, the components of the wetting pattern show a continuous and unsteady variation in spatio-temporal dimension. These components can be considered as functions of time. The schematic view of the components of the wetting patterns is given in Fig. 2.
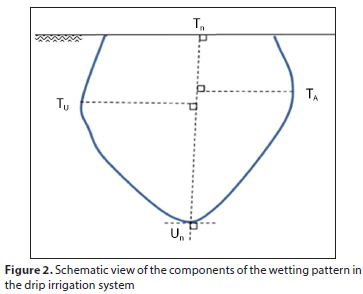
In Fig. 2, TU and TA represent the maximum widths of the wetting pattern in the soil profile. The components Tn, TA, TU and Un of the wetting pattern show continuous and irregular variation in spatio-temporal dimension. These are the functions of time. The line [TnUn]is not a symmetry axis. It is perpendicular to the soil surface, and intersects the deepest point Un of the wetting pattern in the soil profile. Also, points TU and TA do not overlap symmetrically. The wetting pattern showed a continuous and irregular variation at each time point during the irrigation application. Therefore, different wetting patterns occurred both on the soil surface and in the soil profile at different time points (Kilic, 2018).
The analytical description of the wetting pattern by placing it on the coordinate system constituted the second main stage of the investigation. Turning the wetting pattern (Fig. 2) 90° to the right makes it much easier to place it on the coordinate system. This process is shown schematically in Fig. 3 (Kilic, 2018).
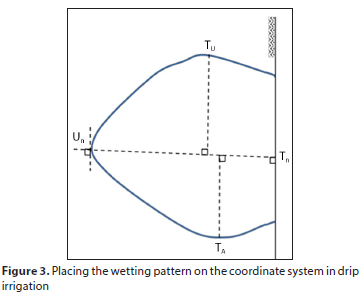
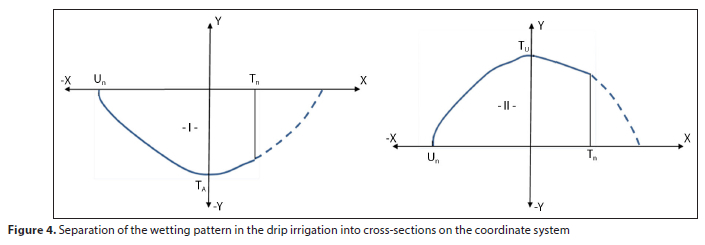
In Fig. 3, the soil surface represents the vertical axis, and the line [TnUn]constitutes the horizontal axis. The cross-sectional areas under and above the x-axis were named as cross-section I and cross-section II, respectively. The sizes of the components of these two cross-sections are different and independent from each other. They do not have to be symmetric or the same size. The model results are obtained by entering separately the values of the variables of the cross-sections I and II. A symmetric or asymmetric wetting pattern does not change the validity of the results. As the model is run separately in accordance with the sizes of the variables constituting each of the cross-sections of the wetting pattern, the results are always obtained. This is shown schematically in Fig. 4.
As seen in Fig. 4, cross-sections I and II are connected to the x-axis by a dotted-line curve. Cross-section I showed a convex feature, but cross-section II had a concave form. As the maximum width of the wetting pattern occurs under the soil surface, cross-sections I and II can be thought of as parabolas, as shown in Fig. 4. The points TA and TU on cross-sections I and II, respectively, can be thought of as the vertex points of the parabolas.
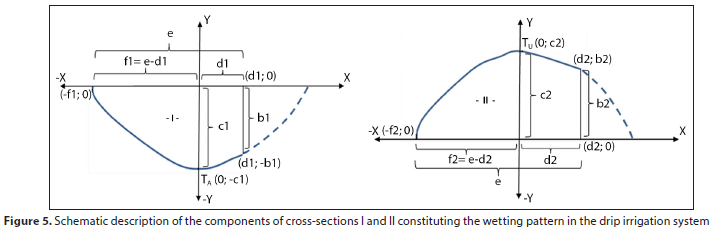
The components of the wetting pattern, made up of cross-sections I and II, are shown schematically in Fig. 5. These components were measured every 5 min during the experiment with the aim of determining the rates of change and the acceleration values of the variation of the components constituting the wetting pattern in temporal and spatial dimensions. In other words, the aim was to describe the analytic relationships between the components of the wetting pattern in a drip irrigation system.
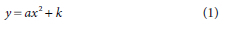
The parabola equations of the cross-sections I and II (Fig. 5) were represented in standard form. This equation is y = ax2 + k (Eq. 1). The aim was to describe the 2D wetting pattern more clearly and to carry out the calculation process faster and more easily.
In the equation, variation of coefficient a as the absolute value in the temporal dimension determines the variation of the distance of the arms of the parabola from the y-axis. In other words, increasing or decreasing absolute values of coefficient a over time indicate the arms of the parabola, which constitutes the wetting pattern getting close to the y-axis or moving away from it. When this was interpreted from the viewpoint of drip irrigation applications, it was seen that an increment in the amount of water infiltrating the soil or in the length of the drip irrigation period also causes an increment in the size of the wetted area occurring in the soil profile. This generally causes the arms of the parabolas constituting cross-sections I and II to move away from the y-axis (Figs 2 and 5). On the other hand, in this method, the [TnUn] line, which is perpendicular to the soil surface and passes over the deepest point (Un) of the wetting pattern, may approach or recede from the vertex points of the parabolas of cross-sections I and II, depending on the location of the point Un (Figs 2 and 4). Thus, the arms of the parabolas may get close to the y-axis in some wetting patterns which occur at consecutive time points despite an increase in the total size of the wetted area, depending on the location of the line [TnUn]. The reason for this is the continuous and unsteady variation of the line [TnUn] in the temporal and spatial dimensions. However, the total size of the wetted area also increases.
In addition, the positive or negative values of a determine the features of the parabolas as convex or concave. The term k represents the values of the ordinates of the vertex points of the parabolas which constitute cross-sections I and II. As seen in Fig. 5, both of the vertex points of the cross-sections were located on the y-axis.
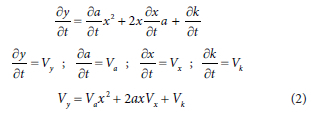
The components of y, a, x and k which constitute the equation of the parabola of Eq. 1 are functions of time. This is because the wetting pattern which occurs at each different time point in the soil profile has completely different features from the previous one. That is, the sizes, rates of change and values of acceleration of the components of the wetting patterns are different from each other. In other words, these components show continuous and unsteady variations in temporal and spatial dimensions. Thus, each of them can be derived according to time. When all the components of Eq. 1 are derived according to time, the equations given below are obtained:
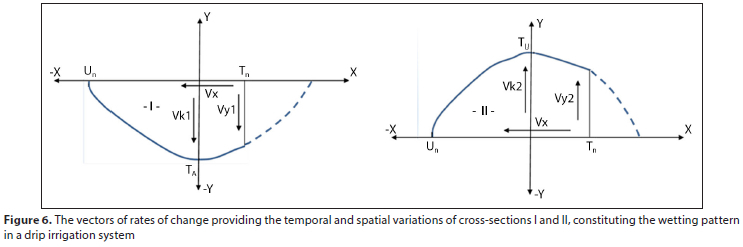
The vectors of rates of change providing the temporal and spatial variations of cross-sections I and II, constituting the wetting pattern, are shown in Fig. 6.
As seen in Fig. 6, the vectors Vy1 and Vy2 in cross-sections I and II, respectively, represent the rate of change of the diameter of the wetting pattern which occurred on the soil surface. They represent the rate of change of the variables of bl and b2 which were measured during the experiment (Fig. 5). Similarly, and Vk2 give the rate of change of the maximum width of the wetting pattern of cross-sections I and II in the soil profile. They represent the rates of change of the variables c1 and c2 measured during the experiment (Fig. 5). The variable Vx in the equation represents the rates of change of the variables d1 and d2, measured in cross-sections I and II, respectively. Similarly, the variable x in the equation also shows the lengths d1 and d2 for the cross-sections I and II, respectively (Fig. 5). Also, the term a is the coefficient of the x2 in the equation of the parabolas (Eq. 1), constituting cross-sections I and II. The values of a were determined separately for cross-sections I and II at each time point at 5-min intervals during the experiment. The term a in cross-section I was obtained from the arithmetic mean of the two different values of a, which were determined according to the coordinates of (-f1; 0) and (d1; -b1) shown in this cross-section in Fig. 5. Also, the value of the term a in cross-section II was found by the arithmetic mean of the two different values of a, which were obtained according to the coordinates of (-f2; 0) and (d2; b2) shown in cross-section II in Fig. 5. In the equation, Va gives the rate of change of the coefficient of x2 for both parabolas in cross-sections I and II. In addition, cross-sections I and II, located in different zones of the coordinate system, also have different shapes to each other. While cross-section I shows a convex feature, the other has the concave form (Fig. 6). The negative or positive values of coefficient a, calculated from the equations, must describe this feature correctly. Because of this, parameter a is an indicator, determining whether or not the equations devised in this investigation are in accordance with the wetting pattern in a drip irrigation system.
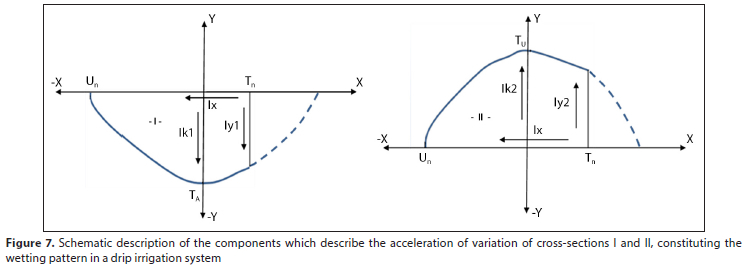
In order to describe the variation of the wetting pattern in more detail in temporal and spatial dimensions in a drip irrigation system, it is very important to describe the equations of acceleration of the components of the wetting pattern. The components which show the acceleration of variation of cross-sections I and II are shown schematically in Fig. 7.
The equation of acceleration was obtained by taking the derivative of Eq. 2 according to time. The processes mentioned are shown below.
The derivative of the equation given above is taken according to time.
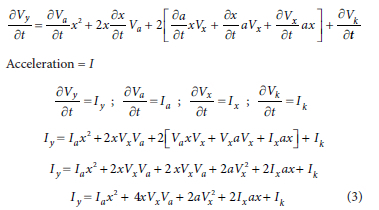
This equation of acceleration was used in calculations for each 5-min period when the measurements were carried out in both cross-sections I and II.
Determining the 2D cross-sectional area of the wetting pattern
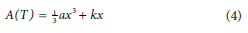
In this process, the sizes of the 2D cross-sectional area were calculated separately for cross-sections I and II, and then their sum was taken. In this way, the total size of the wetting pattern was obtained for a desired time point. For this purpose, the integral of the general equation of the parabola (Eq. 1), described for the two cross-sections, was taken. These calculation processes are given below.
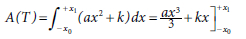
The general equation is obtained as shown below:
(-X0 + x1) are the border values in the general process, which are located on the x-axis, as shown in Fig. 5 for cross-sections I and II. In the equation above, the values of (-X0; +X1), which are the upper and lower borders of the integral process, represent the value of (-f1;d1) for cross-section I, and (-f2; +d2) for cross-section II (Fig. 5).
When determining the size of the wetted area in the soil profile in a drip irrigation system, the sum of the sizes of the areas of cross-sections I and II was taken for each 5-min time point when the measurements were carried out. In this way, the whole wetting pattern was described for each time point.
As stated previously, the aim of this investigation was to devise a mathematical model which simulates the general shape of the 2D cross-sectional area of the wetting pattern under a dripper, and which determines the size of this area.
The validity of the proposed model is confirmed by the three different experiments carried out under field conditions where the soil samples were taken for the laboratory experiments.
So, how is the 2D cross-sectional area of the wetting pattern which occurs under a dripper in field conditions obtained? The 3D volumetric wetting pattern which occurs under a dripper in field conditions is dug in a vertical direction from the soil surface by dividing it as much as possible into two parts from its middle. The front view of the pattern obtained is the 2D cross-sectional area of the wetting pattern. The values of the necessary parameters which are measured on the 2D cross-sectional area of the wetting pattern are entered into the model. Next, the size of the 2D cross-sectional area under field conditions is obtained by running the proposed model.
The size of the 2D cross-sectional area which is obtained by running the proposed model is compared with the results from the digital planimeter (Koizumi) measurements for the same area. Thus, the validity of the proposed model is confirmed. In this process, the size of the 2D cross-sectional area which is obtained from the 3D volumetric wetting pattern under field conditions as explained above is both measured by the digital planimeter and determined by running the proposed model (see Supplementary Material - Part B: Confirmation of model validity by field experiments and digital planimeter measurements).
Measurement of the size of the 2D cross-sectional area by the digital planimeter is performed as follows. First, the shape of the 2D cross-sectional area which is obtained in accordance with the measurements carried out in the field is drawn on the paper at a small scale. Next, the sizes of these areas are measured with the digital planimeter (Koizumi). As a result, the size of the 2D cross-sectional area of the wetting pattern which is obtained by running the proposed model is compared with the digital planimeter measurement of the same area, and the validity of the model is confirmed (see Supplementary Material - Part B).
RESULTS
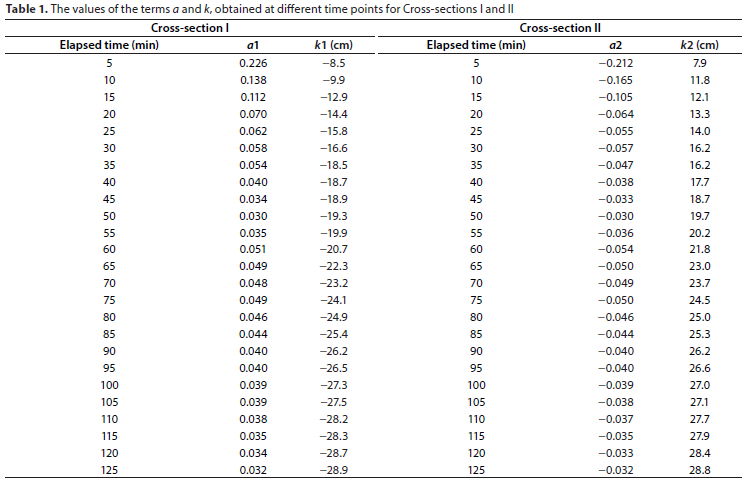
The values of a and k in Eq. 1, obtained at different time points for cross-sections I and II, are given in Table 1.
As seen in Table 1, the values of a1 and a2 obtained for cross-sections I and II, respectively, showed a decreasing trend as absolute values over time. This shows that when the irrigation period gets longer or the amount of water infiltrating the soil increases, the wetting pattern also increases in size. In other words, the arms of the parabolas seen in Figs 2 and 4 generally showed a trend of going away from the y-axis. However, a relative increment occurred in the absolute values of a1 in cross-section I at the 55th, 60th and 75th minutes in relation to each previous time point. The reason is that the components of the wetting pattern show independent variations at each time point, as seen in Fig. 2. Also at the time points stated above, the arms of the parabola on the [TnUn]-axis in cross-section I remained closer to the y-axis than at the previous time points, as seen in Fig. 4. The reason is the location of the point Un, as shown schematically in Fig. 2. The [TnUn]-axis in cross-section I, shown in Fig. 4, was slightly closer to TA than its location at the previous time points in the 55th, 60th and 75th minutes. In this way, the width of the arms of the parabola at the next time point remained relatively smaller than at the previous time point. In other words, the arms of the parabola at the next time point were closer to the y-axis. When the location of the [TnUn]-axis changes during the water application period, the coefficient of a will also change relatively in the equation of the parabola which occurs at each time point. A similar condition is also valid for cross-section II.
The positive values of a1 in cross-section I show that this parabola has a convex shape. On the other hand, the coefficients of a2 took negative values in cross-section II, which shows that the parabolas constituting cross-section II are concave. The coefficients of a1 and a2 obtained from the investigation took on values which were in accordance with the locations of cross-sections I and II in the coordinate system (Fig. 4).
The terms k1 and k2 determined for the cross-sections of I and II show the ordinates of the vertex points of the parabolas given in Fig. 4. The term k1 took negative values for cross-section I, which was located on the negative side of the y-axis. On the other hand, the term k2 took positive values for cross-section II, which was on the positive side of the y-axis. As seen in Table 1, the terms k1 and k2 increased as absolute values over time for both of the cross-sections. The reason is that when the length of irrigation time or the amount of water infiltrating the soil increases, the wetted area in the soil profile also increases in size. This means that the parabolas which constitute the wetting patterns increase in size at each time point. Thus, as seen in Fig. 4, the ordinates of the vertex points of both cross-sections I and II, i.e., the values of k1 and k2, increase as absolute values, and a variation occurs in accordance with the increase in size of the wetted area.
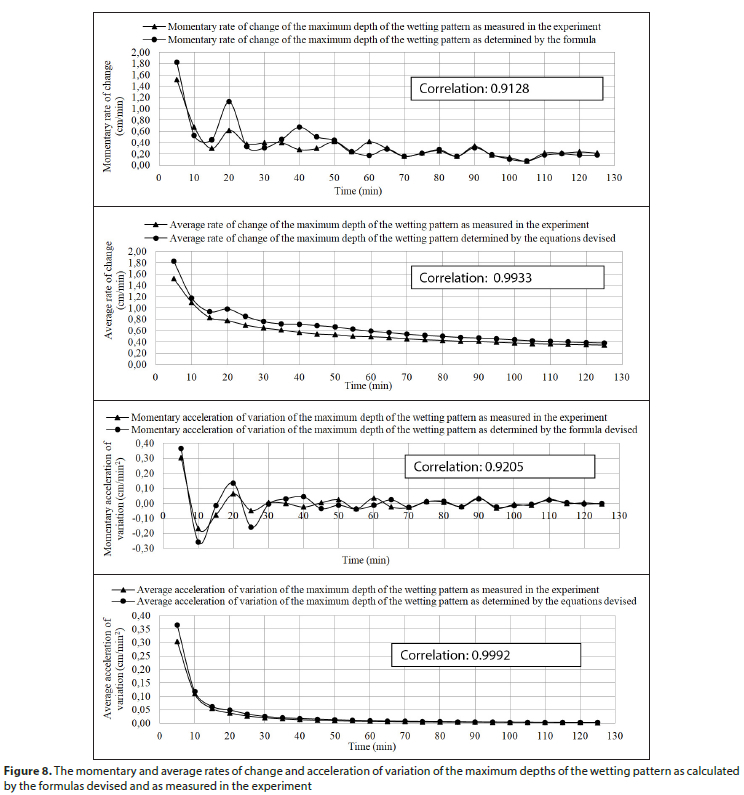
Another subject related to the wetting pattern in the soil profile of the drip irrigation system was the estimation of the rate of change of the maximum depth of the wetting pattern at each time point in the temporal and spatial dimensions. This parameter represents the temporal variation of the length of the line [TnUn] shown in Fig. 2. As seen in Figs 2 and 4, the value of this parameter is the same for both cross-sections I and II. This is because the length of the line [TnUn]on the horizontal axis of x is equal for each of the cross-sections. For instance, as seen in Fig. 5, the maximum depth of the wetting pattern which formed at any time point for cross-section I was shown by the symbol e. In the equation of the parabola which constitutes cross-section I, one of the values of x (root) obtained for the value of zero of y at any time point must be equal to x = -ƒ1 or close to this value. In this way, e = d1 + The momentary and average rates of change and acceleration of variation of the maximum depth of the wetting pattern as calculated by the formula devised and as measured in the experiment are given graphically in Fig. 8.
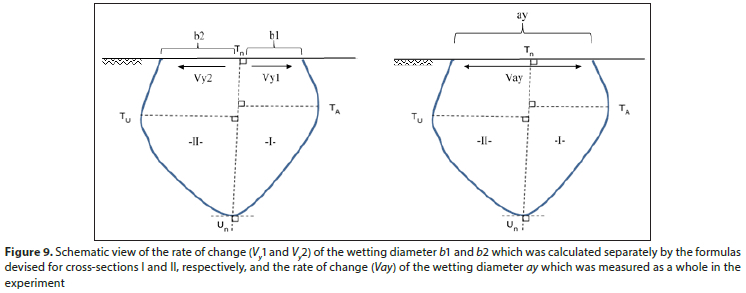
In the next main stage of the investigation, the temporal variation of the wetting diameter which occurred on the soil surface was investigated. In this process, a comparison was made of the total rate of change of the wetting diameter (Vy1 + Vy2), which was calculated separately by the formulas devised for cross-sections I and II, respectively, and the rate of change of the wetting diameter (Vay), which was measured as a whole in the experiment. These vectors of the rate of change are given schematically in Fig. 9.
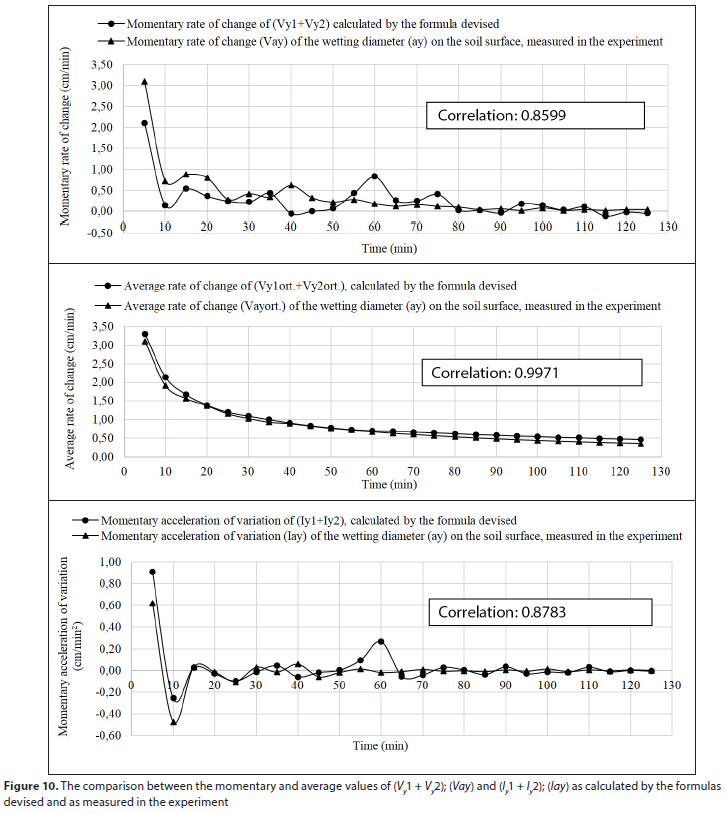
In other words, the value of (Vy1 + Vy2) which was calculated by the formulas devised was compared with the temporal rate of change (Vay) of the wetting diameter (ay) on the soil surface which was measured in the experiment. The comparison between the momentary and average values of (Vy1 + Vy2); (Vay) and (Iy1 + Iy2); (lay) as calculated by the formulas devised and as measured in the experiment are shown graphically in Fig. 10.
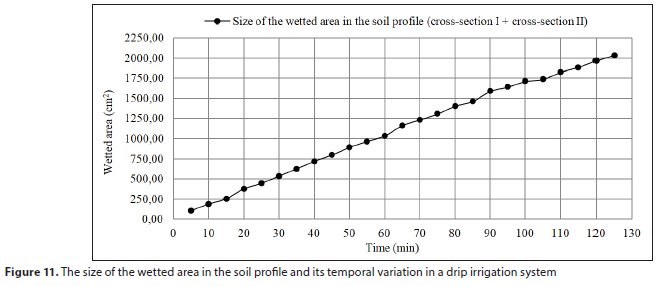
Another subject of this investigation was to research the size of the wetting pattern in the soil profile and its rate of change over time in a drip irrigation system. In this process, the sizes of the wetted areas of cross-sections I and II constituting the wetting pattern were determined separately, and then the size of the wetted area which occurred in the soil profile was obtained by summing these two values for each time point. The temporal rates of change of the size of the wetted area which occurred in the soil profile for each time point when the measurements were carried out in the experiment are shown graphically in Fig. 11.
As seen in Fig. 11, the size of the wetted area in the soil profile took increasing values for each time point. This shows that as the amount of water infiltrating the soil or the length of irrigation time increases, the size of the wetted area in the soil profile also increases.
As explained in the methods section, the location and length of the axis [TnUn], the position of the vertex points TA and TU relative to each other, and the sizes of the wetted areas of cross-sections I and II showed a continuous and unsteady variation independent of each other (Fig. 2), at each time point when the measurements were carried out. However, the total size of the wetted area increased at each consecutive time point. These results show that the values of the measurements obtained from the experiment and the results from the equations devised are in accordance with each other.
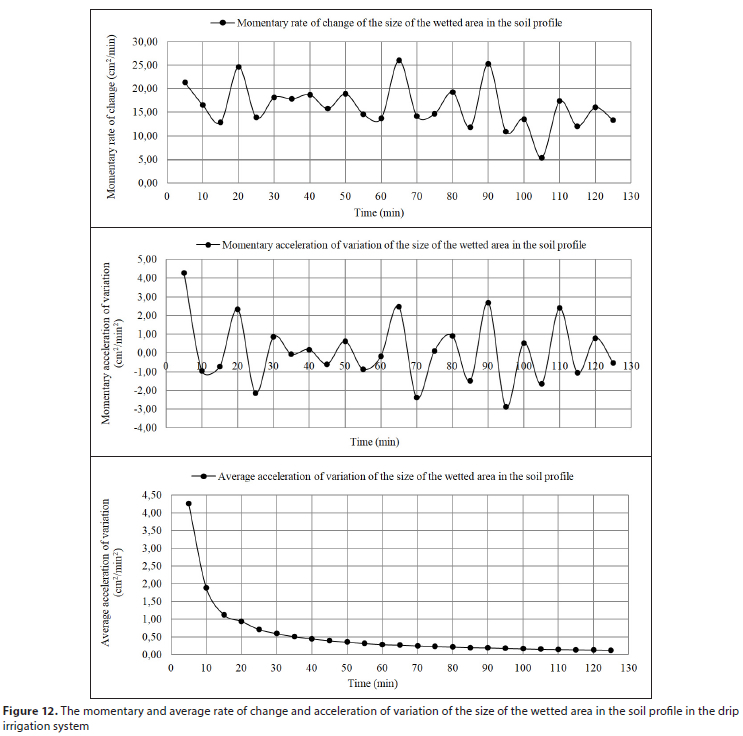
The momentary and average rates of change and acceleration of the variation in the size of the wetted area in the soil profile in the drip irrigation system are shown graphically below. Both the values of the momentary and average rates of change provided an opportunity to investigate the acceleration of variation of the size of the wetted area.
Apart from this, the results obtained by running the proposed model indicate that the sizes of the 2D cross-sectional areas which occur under field conditions can be determined with a very high rate of accuracy. The accuracy rates of field experiments 1, 2 and 3 are 95.52%, 94.52% and 97.47%, respectively (see Supplementary Material). Thus, irrigation programmes can be prepared which provide a wetting pattern which is compatible with the size of the cross-sectional area of the crop root zone.
In addition, it is never necessary to make measurements separately on a glass container in which there is a disturbed soil sample in order to determine the size of the 2D cross-sectional area of the wetting pattern which occurs under field conditions. The necessary parameters for the proposed model can be determined easily by the measurements on the 2D cross-sectional area which occur in a definite field under a certain dripper discharge and water application time. It is adequate to enter these values into the model and to run it. In the running the model, performing the calculations with, for example, 3 repetitions using different drippers for a definite discharge and time point, and determining the results from the arithmetic mean of these values, can better represent the properties of the irrigated area.
The model proposed in this investigation will enable the preparation of irrigation programmes which provide a wetting pattern compatible with the 2D cross-sectional area of the crop root zone. In addition, the wetting pattern which is compatible with the 2D cross-sectional area of the root zone of the crop is also very important for the sustainable use of constrained resources.
DISCUSSION
Bhatnagar and Chauhan (2008) carried out an investigation for estimation of the wetting pattern under a surface dripper by numerical modelling. In this process, a disc source, the radius of which varied depending on time, was taken into consideration. The model was validated by the results of the experiments carried out by Taghavi et al. (1984) and Bresler (1978). The initial water content (0i.) and specific water capacity (C) were 0.0439 cm3/cm3 and 0.0013 cm-1, respectively, in the investigation of Taghavi et al. (1984). The hydraulic conductivity at saturation (Ks), constant (α) and the water content at saturation (0s) were 0.85 cm/h, 0.025 cm1 and 0.53 cm3/cm3, respectively, and in this case it was stated that the wetting front (0) was 10% higher than 0i.
When the model which was devised by Bhatnagar and Chauhan (2008) was solved numerically for the discharges q1 = 2 100 cm3/h and q2 = 3 300 cm3/h, water front advance until the radial distance (r) was predicted well. On the other hand, the model estimated higher values than the observed ones for the higher values of r. It was stated by the authors that the reason for this may be the border effects which occurred in the experiments.
In the model proposed in this investigation, momentary and average rates of change and acceleration of the measured and estimated values of the maximum wetted depth (Fig. 2 and Fig. 8), and of the wetting diameter on the soil surface (Fig. 9, Fig. 10), which constitute the parameters of the wetting pattern, are evaluated statistically. The correlation between the momentary rate of change of the measured and estimated values of the maximum wetted depth is 0.9128 (Fig. 8). In addition, the correlation between the measured and estimated values of the momentary variations of acceleration of this parameter is 0.9205 (Fig. 8). These values show that the proposed model gives good results in the estimation of the maximum wetted depth. Apart from this, another parameter is the wetting diameter, which occurs on the soil surface (Fig. 9). The correlation between the momentary rate of change of the measured and estimated values of this parameter is 0.8599 (Fig. 10). In addition, the correlation between the momentary variations of acceleration of the measured and estimated values of the wetting diameter is 0.8783 (Fig. 10). The high values obtained for correlations between the measurements which were carried out at 5-min intervals and the results from the model solution for the same periods indicate that the proposed model estimates the values of the parameters of the wetting pattern well.
Maximum width of the wetting pattern occurs under the soil surface - in the soil profile - in almost every irrigation application (Al-Ogaidi et al., 2016; Kilic, 2020). On the other hand, it is assumed in most of the investigations that the maximum width of the wetting pattern occurs on the soil surface, and this parameter is defined as the wetting diameter. However, in the proposed model, the solutions are also performed by taking into consideration the condition that the maximum width of the wetting pattern occurs under the soil surface (Fig. 2, Fig. 9).
In addition, the entire wetting pattern is estimated in most of the previous investigations by considering the two points which contain only the wetting diameter on the soil surface and the maximum wetted depth (Schwartzman and Zur, 1986; Amin and Ekhmaj, 2006; Malek and Peters, 2011; Naglic et al., 2014; Al-Ogaidi et al., 2015), whereas in the present investigation, the maximum width of the wetting pattern which occurs under the soil surface is added to the proposed model in addition to the parameters above. The temporal variation of the size of the entire wetting pattern, which is obtained by running the proposed model (Fig. 11), and variations of the acceleration and values of rate of change (Fig. 12), give results which are compatible with the movement properties of water in the soil (Al-Ogaidi et al., 2016; Kilic, 2020). The size of the 2D cross-sectional area of the wetting pattern can be predicted directly for any moment t of the irrigation application, together with the entire shape of the wetting pattern, by running the proposed model which is based on the analytical solution method (Eq. 4).
The proposed model enables optimum irrigation programming by providing the wetting pattern which is compatible with the cross-sectional area of the root zone of the crop, which changes continuously during the different growing stages. Thus, a wetting pattern is obtained which completely covers the root zone of the crop. In addition, the size of the wetting pattern can be arranged exactly for different irrigation applications in accordance with the variations of the size of the cross-sectional area of the root zone in different growing periods of the crop. As this procedure allows the optimum length of irrigation time to be decided, the wetting pattern covers the root zone of the crop at a maximum rate in every irrigation application. The wetting pattern and the root zone overlap and this process enables precise irrigation applications.
Kandelous and Simunek (2010b) estimated the wetting pattern in drip irrigation by using the numerical HYDRUS-2D model, the analytical WetUp software, and the methods devised by Schwartzman and Zur (1986) and Amin and Ekhmaj (2006). The differences in the sizes between the model estimations and the wetting pattern observations and measurements were compared by the Mean absolute error (MAE) approach. MAE values showed variations between the values of 2.43 cm and 9.76 cm for the HYDRUS-2D model, 12.11 cm and 58.1 cm for the WetUp software, 4.42 cm and 11.55 cm for the empirical model of Schwartzman and Zur (1986), and 1.96 cm and 8.47 cm for the empirical model of Amin and Ekhmaj (2006). The models provided good estimations, except the WetUp software. While the WetUp model overestimated the wetting pattern, the model of Schwartzman and Zur (1986) underestimated it. HYDRUS-2D and Amin and Ekhmaj's (2006) model provided better estimations than the other ones. In the present investigation, high levels of correlation were obtained between the estimated and measured values of the momentary spatio-temporal variations of the parameters of the wetting pattern by running the proposed model (Fig. 8, Fig. 10). The mean value of coefficient a of the independent variable x2 in Eq. 1 and in Eq. 4 creates the statistical differences between the results compared. The proposed model gives good results, and this indicates that this method can be used in the estimation of the wetting pattern under a surface drip irrigation system.
FuQiang et al. (2011) devised a numerical model which described the 2D movement of water in soil under a surface dripper. The physical properties of water movement in soil were defined by the 2D Richards equation. The experiments were carried out on sand, loam and clay soils. The model gave good results for long-term simulations. When the validity of the model was verified by the mean absolute relative error (MARE) approach, the result was found to be 12%. When the water balance error was considered in the experimental data, the values of MARE varied between 4% and 10%. In the present investigation, when the measured and estimated values of the momentary variations of the parameters of the wetting pattern are compared with each other, 0.9128 and 0.9205 correlation values (Fig. 8) and 0.8599 and 0.8783 correlation values (Fig. 10) were found by running the proposed model. These results indicate that the proposed model can be used in the estimation of the cross-sectional area of the wetting pattern under a surface drip irrigation system.
Moncef and Khemaies (2016) carried out an investigation for the estimation of the wetted volume under a surface dripper based on an analytical modelling approach. The wetted volumes which occurred in loamy clay and sandy clay loam soils under a discharge of 2 L/h were predicted. A similar trend occurred between the wetted volume calculated (Vbc) and the wetted volume predicted (Vbp). The difference between the Vbc and Vbp was always found to be smaller than the relative error of Vbc. This difference was found to be more significant under a dripper discharge of 1 L/h. It was stated by the authors that the inaccuracy in the values of 0f (volumetric soil water content, L3/L3) and/or 0i (initial volumetric soil water content, L3/L3) caused the differences in the results compared. Apart from this, assuming the wetting pattern to have a semi-elliptical form does not always provide suitable merging of this pattern with the soil surface. In addition, temporal variation of the wetted volume (бVb/бt) under a dripper discharge of 2 L/h without considering the elapsed time was greater than that which occurred under a discharge of 1 L/h. The wetted volume obtained in this investigation was compared with the method developed by Healy and Warric (1988). A fair agreement was obtained. The reasons for the differences between the calculated and estimated values of the wetted volumes after 6, 8 and 10 h of infiltration were reported by Moncef and Khemaies (2016) as inaccuracies in measurements and the border conditions of the wetting pattern.
As was stated by Moncef and Khemaies (2016), assuming the shape of the wetting pattern under a surface dripper to be semi-elliptical does not always provide suitable merging of this pattern with the soil surface, whereas the shape of the wetting pattern described in the present investigation (Fig. 2) and the proposed model based on the analytical solution which provides estimation of the cross-sectional area of the wetting pattern (Eq. 4) simulates this pattern better. High correlations between the measured and estimated values of the parameters (Figs 8 and 10) indicate that the proposed model can be used in the estimation of the wetting pattern.
Al-Ogaidi et al. (2016) devised an empirical model in order to define the wetting patterns which occurred in sand and clay soils under a surface dripper with discharges of 3 L/h and 4.5 L/h. The size of the wetting pattern was described only by considering the wetted radius on the soil surface and maximum wetted depth under the surface dripper by the empirical models devised in most investigations (Schwartzman and Zur, 1986; Amin and Ekhmaj, 2006; Malek and Peters, 2011; Naglic et al., 2014; Al-Ogaidi et al., 2015), whereas the maximum width of the wetting pattern in a surface drip irrigation system occurs under the soil surface in almost every irrigation application. The maximum width of the wetting pattern was added to the two parameters above in the empirical model devised by Al-Ogaidi et al. (2016). Next, the wetting pattern was predicted by connecting these three points. A complete empirical model was not described which directly defined the shape of the entire wetting pattern. In the present investigation, the main or general wetting pattern is defined (Fig. 2) and the analytical model (Eq. 4) which represents this pattern is obtained. In this process, it is considered that the cross-section of the wetting pattern does not have a symmetric shape, and maximum width of the wetting pattern occurs under the soil surface. Thus, the main equation (Eq. 4) which represents the wetting patterns occurring under different irrigation applications is obtained. This model is run for both the cross-sections I and II which constitute the wetting pattern (Figs 2 and 4). Thus the entire size of the cross-sectional area of the wetting pattern is determined. High values of correlation between the measured and estimated values of the parameters of the wetting pattern (Figs 8 and 10) indicate the validity of the proposed model.
CONCLUSIONS
In this investigation, the 2D wetting pattern which occurred under a surface dripper was modelled by considering 4 main parameters: the wetting diameter on the soil surface, the maximum wetted depth and maximum wetted width in the soil profile, and the depth of this maximum wetted width from the soil surface (Figs 2 and 5). The main/general shape (Fig. 2) which represents the wetting patterns which occur under different irrigation conditions was divided into two cross-sections, cross-section I and cross-section II (Fig. 4). It was determined that each of these cross-sections could be simulated by the parabola equation y = ax2 + k. When the comparative analysis of the parameters of the wetting pattern was performed, the correlation was found to be 0.9128 between the momentary rate of change of the maximum depth of the wetting pattern as measured in the experiment and as determined by the model (Fig. 8). In addition, the correlation between the momentary acceleration of variation of the maximum depth of the wetting pattern as measured in the experiment and as determined by the model was 0.9205 (Fig. 8). Apart from this, the correlation was found to be 0.8599 for the momentary rate of change of the wetting diameter, and the correlation for momentary acceleration of variation of the wetting diameter was 0.8783 (Figs 9 and 10). These results indicate that the model devised in this investigation represents the movement properties of water in soil under a surface dripper.
In addition, the increment of the size of the cross-sectional area of the wetting pattern in the temporal dimension shows that the model results are compatible with the results of the experiment (Fig. 11). Apart from this, the average acceleration of variation of the size of the wetted area in the soil profile (Fig. 12) indicates that the cross-sectional area of the wetting pattern shows an increment in size with reducing velocities. This result is also compatible with the spatio-temporal variation of the wetting pattern which occurs under a surface dripper.
Apart from this, the results obtained by running the proposed model indicate that the sizes of the 2D cross-sectional areas which occur under field conditions can be determined with a very high rate of accuracy. The accuracy rates of field experiments 1, 2 and 3 are 95.52%, 94.52% and 97.47% respectively (see Supplementary Material). Thus, irrigation programmes can be prepared which provide a wetting pattern which is compatible with the size of the cross-sectional area of the crop root zone.
These results indicate that the model devised in this investigation can be used in the estimation of the size of the 2D cross-sectional area of the wetting pattern which occurs under a surface dripper.
SYMBOLS
A(T) Each size of the wetted area of cross-sections I and II (cm2), (Figs 4 and 5)
a The coefficient of x2 in the equations of the parabolas constituting cross-sections I and II
Ia The acceleration of variation of a, which is the coefficient of x2 in the equation of the parabola for cross-sections I and II (cm/min2). In other words, the acceleration of variation of the distance of the arms of the parabolas from the y-axis for the cross-sections I and II, which constitutes the wetting pattern in the soil profile (Fig. 4).
Ik The acceleration of variation of the maximum width of the wetting pattern (c1 and c2) in the soil profile for cross-sections I and II respectively (cm/min2) (Figs 5 and 7). In other words, acceleration of variation of the values of the ordinates of the vertex points (TA and TU) of the parabolas constituting cross-sections I and II.
Ix The acceleration of variation of the lengths of d1 and d2 for cross-sections I and II respectively (cm/min2) (Figs 5 and 7).
Iy The acceleration of variation ofthe wetting diameter (b1 and b2) on the soil surface for cross-sections I and II respectively (cm/min2) (Figs 5 and 7).
k Ordinate values of c1 and c2 of the vertex points TA and TU of the parabolas, constituting cross-sections I and II respectively (cm) (Fig. 4 and Fig. 5).
Va The rate of change of a which is the coefficient of x2 in the parabolas of cross-sections I and II (cm/min). This variable gives the rate of change of the distance of the arms of the parabolas in cross-sections I and II from the y-axis (Figs 4 and 6).
Vk This variable represents the rate of change of the maximum width of the wetting pattern (c1 and c2) in the soil profile for cross-sections I and II respectively (cm/min) (Figs 5 and 6). This variable represents the rate of change of the ordinates of the vertex points (TA and TU) of the parabolas, constituting cross-sections I and II respectively.
Vx The rate of change of the lengths of d1 and d2 for cross-sections I and II respectively (cm/min) (Figs 5 and 6).
Vy The rate of change of the wetting diameter (b1 and b2) on the soil surface for cross-sections I and II respectively (cm/min) (Figs 5 and 6).
x The lengths of d1 and d2 which are in cross-sections I and II respectively (cm) (Fig. 5).
REFERENCES
ABUARAB ME, HAFEZ SM, SHAHEIN MM, HASSAN AM, EL-SAWY MB, EL-MOGY MM and ABDELDAYM EA (2020) Irrigation scheduling for green beans grown in clay loam soil under a drip irrigation system. Water SA 46 (4) 573-582. https://doi.org/10.17159/wsa/2020.v46.i4.9070 [ Links ]
AL-OGAIDI AAM, WAYAYOK A, ROWSHON MK and ABDULLAH AF (2015) A modified empirical model for estimating the wetted zone dimensions under drip irrigation. J. Teknol. 76 69-73. https://doi.org/10.11113/jt.v76.5954 [ Links ]
AL-OGAIDI AAM, WAYAYOK A, ROWSHON MK and ABDULLAH AF (2016) Wetting patterns estimation under drip irrigation systems using an enhanced empirical model. Agric. Water Manage. 176 203-213. https://doi.org/10.1016/j.agwat.2016.06.002 [ Links ]
AMIN MSM and EKHMAJ A.M (2006) DIPAC-drip irrigation water distribution pattern calculator. In: 7th International Micro Irrigation Congress, 10-16 September 2006, PWTC, Kuala Lumpur, Malaysia. [ Links ]
ANGELAKIS AN, KADIR TN and ROLSTON DE (1993) Time-dependent soil-water distribution under a circular trickle source. Water Resour. Manage. 7 225-235. https://doi.org/10.1007/BF01675305 [ Links ]
BADR AE and ABUARAB ME (2013) Soil moisture distribution patterns under surface and subsurface drip irrigation systems in sandy soil using neutron scattering technique. Irrig. Sci. 31 317-332. https://doi.org/10.1007/s00271-011-0306-0 [ Links ]
BHATNAGAR PR and CHAUHAN HS (2008) Soil water movement under a single surface trickle source. Agric. Water Manage. 95 799-808. https://doi.org/10.1016/j.agwat.2008.02.003 [ Links ]
BRESLER E (1978) Analysis of trickle irrigation with application to design problems. Irrig. Sci. 1 3-17. https://doi.org/10.1007/BF00269003 [ Links ]
COLOMBO A and OR D (2006) Plant water accessibility function: A design and management tool for trickle irrigation. Agric. Water Manage. 82 45-62. https://doi.org/10.1016/j.agwat.2005.07.025 [ Links ]
DOS SANTOS LNS, MATSURA EE, CONCALVES IZ, BARBOSA EAA, NAZÁRIO AA, TUTA NF, ELAIUY MCL, FEITOSA DRC and DE SOUSA ACM (2016) Water storage in the soil profile under subsurface drip irrigation: Evaluating two installation depths of emitters and two water qualities. Agric. Water Manage. 170 91-98. https://doi.org/10.1016/j.agwat.2015.09.025 [ Links ]
ELMALOGLOU S and DIAMANTOPOULOS E (2008) The effect of hysteresis on three-dimensional transient water flow during surface trickle irrigation. Irrig. Drain. 57 (1) 57-70. https://doi.org/10.1002/ird.353 [ Links ]
ELMALOGLOU S and DIAMANTOPOULOS E (2009) (Short communication) Effects of hysteresis on redistribution of soil moisture and deep percolation at continuous and pulse drip irrigation. Agric. Water Manage. 96 533-538. https://doi.org/10.1016/j.agwat.2008.09.003 [ Links ]
ELMALOGLOU S, DIAMANTOPOULOS E and DERCAS N (2010) Comparing soil moisture under trickle irrigation modeled as a point and line source. Agric. Water Manage. 97 426-432. https://doi.org/10.1016/j.agwat.2009.11.003 [ Links ]
ELMALOGLOU S, SOULIS KX and DERCAS N (2013) Simulation of soil water dynamics under surface drip irrigation from equidistant line sources. Water Resour. Manage. 27 4131-4148. https://doi.org/10.1007/s11269-013-0399-8 [ Links ]
ELMALOGLOU ST and MALAMOS N (2007) Estimation of width and depth of the wetted soil volume under a surface emitter, considering root water-uptake and evaporation. Water Resour. Manage. 21 1325-1340. https://doi.org/10.1007/s11269-006-9084-5 [ Links ]
FUQIANG T, LONG G and HEPING H (2011) A two-dimensional Richards equation solver based on CVODE for variably saturated soil water movement. Sci. China Technol. Sci. 54 (12) 3251-3264. https://doi.org/10.1007/s11431-011-4566-y [ Links ]
GHALI GS (1989) Multi-dimensional analysis of soil moisture dynamics in trickle irrigated fields. I: Mathematical modelling. Water Resour. Manage. 3 11-34. https://doi.org/10.1007/BF00872334 [ Links ]
HAMMAMI M and ZAYANI K (2016) An analytical approach to predict the moistened bulb volume beneath a surface point source. Agric. Water Manage. 166 123-129. https://doi.org/10.1016/j.agwat2015.12.020 [ Links ]
HEALY W and WARRICK AW (1988) A generalised solution to infiltration from surfacesoil point source. Soil Sci. Soc. Am. J. 52 1245-1251. https://doi.org/10.2136/sssaj1988.03615995005200050006x [ Links ]
KANDELOUS MM and SIMUNEK J (2010a) Numerical simulations of water movement in a subsurface drip irrigation system under field and laboratory conditions using HYDRUS-2D. Agric. Water Manage. 97 1070-1076. https://doi.org/10.1016/j.agwat.2010.02.012 [ Links ]
KANDELOUS MM and SIMUNEK J (2010b) Comparison of numerical, analytical, and empirical models to estimate wetting patterns for surface and subsurface drip irrigation. Irrig. Sci. 28 435-444. https://doi.org/10.1007/s00271-009-0205-9 [ Links ]
KILIC M (2018) 3D movement of water in soil at drip irrigation system and mathematical description of the wetting pattern by a new method. Ege University Scientific Research Project: ID 975 (2016-ZRF-060). [ Links ]
KILIC M (2020) A new analytical method for estimating the 3D volumetric wetting pattern under drip irrigation system. Agric. Water Manage. 228 (2020) 105898. https://doi.org/10.1016/j.agwat.2019.105898 [ Links ]
KUKLIK V and HOANG TD (2014) Soil moisture regimes under point irrigation. Agric. Water Manage. 134 42-49. https://doi.org/10.1016/j.agwat.2013.11.012 [ Links ]
LAZAROVITCH N, POULTON M, FURMAN A and WARRICK AW (2009) Water distribution under trickle irrigation predicted using artificial neural networks. J. Eng. Math. 64 207-218. https://doi.org/10.1007/s10665-009-9282-2 [ Links ]
MALEK K and PETERS RT (2011) Wetting pattern models for drip irrigation: new empirical model. J. Irrig. Drain. Eng. 137 530-536. https://doi.org/10.1061/(ASCE)IR.1943-4774.0000320 [ Links ]
MONCEF H and KHEMAIES Z (2016) An analytical approach to predict the moistened bulb volume beneatha surface point source. Agric. Water Manage. 166 123-129. https://doi.org/10.1016/j.agwat.2015.12.020 [ Links ]
NAGLIC B, KECHAVARZI C, COULON F and PINTAR M (2014) Numerical investigation of the influence of texture: surface drip emitter discharge rate and initial soilmoisture condition on wetting pattern size. Irrig. Sci. 32 421-436. https://doi.org/10.1007/s00271-014-0439-z [ Links ]
PARLANGE JY (1974) Water movement in soils. Geophys. Surv. 1 357-387. https://doi.org/10.1007/BF01449119 [ Links ]
QIN S, LI S, KANG S, DU T, TONG L and DING R (2016) Can the drip irrigation under film mulch reduce crop evapotranspiration and save water under the sufficient irrigation condition? Agric. Water Manage. 177 128-137. https://doi.org/10.1016/j.agwat.2016.06.022 [ Links ]
RAINE SR, MEYER WS, RASSAM DW, HUTSON JL and COOK FJ (2007) Soil-water and solute movement under precision irrigation: knowledge gaps for managing sustainable root zones. Irrig. Sci. 26 91-100. https://doi.org/10.1007/s00271-007-0075-y [ Links ]
ROLSTON DE, BIGGAR JW and NIGHTINGALE HI (1991) Temporal persistence of spatial soil-water patterns under trickle irrigation. Irrig. Sci. 12 181-186. https://doi.org/10.1007/BF00190521 [ Links ]
SCHWARTZMAN M and ZUR B (1986) Emitter spacing and geometry of wetted soil volume. J. Irrig. Drain. Eng. 112 (3) 242-253. https://doi.org/10.1061/(ASCE)0733-9437(1986)112:3(242) [ Links ]
SIMUNEK J, SEJNA M and VAN GENUCHTEN MTH (1999) The Hydrus-2d software package for simulating the two-dimensional movement of water, heat and multiple solutes in variably-saturated media, Version 2.0. Rep IGWMC-TPS-53, Int. Ground Water Model. Cent., Colorado School of Mines, Golden. [ Links ]
SINGH DK, RAJPUT TBS, SINGH DK, SIKARWAR HS, SAHOO RN and AHMAD T (2006) Simulation of soil wetting pattern with subsurface drip irrigation from line source. Agric. Water Manage. 83 130-134. https://doi.org/10.1016/j.agwat.2005.11.002 [ Links ]
SOULIS KX, ELMALOGLOU S and DERCAS N (2015) Investigating the effects of soil moisture sensors positioning and accuracy on soil moisture based drip irrigation scheduling systems. Agric. Water Manage. 148 258-268. https://doi.org/10.1016/j.agwat.2014.10.015 [ Links ]
SOUZA CF, FOLEGATTI MV and OR D (2009) Distribution and storage characterization of soil solution for drip irrigation. Irrig. Sci. 27 277-288. https://doi.org/10.1007/s00271-008-0143-y [ Links ]
TAGHAVI SA, MARINO MA and ROLSTON E (1984) Infiltration from a trickle irrigation source. J. Irrig. Drain. Eng. 110 (4) 331-341. https://doi.org/10.1061/(ASCE)0733-9437(1984)110:4(331) [ Links ]
WANG FX, KANG Y and LIU SP (2006) Effects of drip irrigation frequency on soil wetting pattern and potato growth in North China Plain. Agric. Water Manage. 79 248-264. https://doi.org/10.1016/j.agwat.2005.02.016 [ Links ]
WATSON J, HARDY L, CORDELL T, CORDELL S, MINCH E and PACHEK C (1995) Subject: how water moves through soil. URL: https://tr.scribd.com/document/80543003/az9516 (Accessed August 2018). [ Links ]
 Correspondence:
Murat Kilic
Email: kilic.murat@ege.edu.tr
Received: 9 September 2021
Accepted: 12 April 2023

