


Serviços Personalizados
Artigo
 Inglês (pdf)
 Artigo em XML
 Referências do artigo
Indicadores

Links relacionados
-
 Citado por Google
 -
 Similares em Google
Compartilhar

 Permalink
Water SA
versão On-line ISSN 1816-7950
versão impressa ISSN 0378-4738
Water SA vol.49 no.2 Pretoria Abr. 2023
http://dx.doi.org/10.17159/wsa/2023.v49.i2.3965
RESEARCH PAPER
Canola (Brassica napus L.) water use indicators as affected by sustained deficit irrigation and plant density in central Free State, South Africa
KA Seetseng; JH Barnard; LD van Rensburg; CC du Preez
Department of Soil, Crop and Climate Sciences, University of the Free State, Bloemfontein 9300, South Africa
ABSTRACT
In South Africa canola (Brassica napus L.) is cultivated in rotation with wheat under winter rainfall in the Western Cape Province, primarily for seed to make oil. Expansion of the crop to the other 8 provinces is proposed to reduce shortages of locally produced plant oils. At the same time, canola can serve as a rotational crop for wheat in these summer rainfall provinces. In central Free State, information on evapotranspiration and various water use indicators for canola as influenced by sustained deficit irrigation and plant density is lacking. An experiment with a line source sprinkler irrigation system was therefore conducted, comprising of full irrigation as a control with 4 sustained deficit irrigation levels (mean reduction in irrigation depth per event of 67%, 52%, 34% and 19%) and 5 plant densities (25, 50, 75, 100 and 125 plants-m-2). Mean seasonal maximum evapotranspiration amounted to 429 mm across plant densities. Plant density did not significantly influence seasonal evapotranspiration. Reducing the irrigation depth per event by more than 20% decreased seasonal evapotranspiration by a mean 3.5 mm per percentage increase in irrigation depth. A maximum biomass water productivity of 22 kg-ha-1-mm-1 was measured with full irrigation and a plant density of 75 plants-m-2. Seed water productivity amounted to a high of 11 kg-ha-1-mm-1 with full irrigation and a plant density of 25 plants-m-2. A percentage reduction in irrigation depth and increase in plant density above 25 plants-m-2 will reduce seed water productivity by 0.071 and 0.033 kg-ha-1-mm-1, respectively. Sustained deficit irrigation increased water use efficiency by a mean 0.5% per percentage reduction in irrigation depth per event.
Keywords: biomass yield, crop factor, evapotranspiration, seed yield, semi-arid
INTRODUCTION
Canola (Brassica napus L.) is primarily cultivated to produce seed to make edible oil (Przybylski and Eskin, 2011). Canola oil is generally blended with oil from crops like soybean and sunflower. Canola, soybean, and sunflower oils are widely used in the food industry either in the pure or blended form, despite some diversity among their properties (Zhou et al., 2020). The food industry in South Africa is no exception with respect to the usage of these three edible plant oils (USDA, 2021). Compared to soybean and sunflower oils, the local production of canola oil is the least (DAFF, 2020).
The demand (approx. 720 000 tonnes annually) for edible plant oils in South Africa exceeds the production (approx. 325 000 t annually) thereof. As a result ofthis shortage, the South African Protein Research Foundation advocated the expansion of canola production, particularly in the summer rainfall region under irrigation (De Kock, 2018). This is because the rainfall during canola's growth period from June to November is insufficient (< 100 mm; ARC-SCW, 2020) for dryland production of canola in semi-arid climates. Production of dryland canola in this region is only possible when water is stored in soil during a preceding fallow period from December to May when rainfall occurs more frequently (Beukes et al., 2004).
Currently, production of canola is largely restricted to the Western Cape Province, mainly under rainfed conditions (DAFF, 2019; Galal, 2021). In this province, 195 000 t of canola was produced on 100 000 ha in 2020/21, contributing 99% of South Africa's canola production (Crop Estimates Committee, 2022). This dryland production is possible because of the winter rain during canola's growth period. Canola also serves as a rotational crop for wheat, which is the major field crop produced in the province (Agenbag and De Kock, 2009; Hardy and Wallace, 2013). In this regard canola is an important crop for conservation agriculture in the Western Cape Province.
For the successful expansion of canola production to the summer rainfall provinces in South Africa, proper guidelines on agronomy practices like cultivar choice, planting date, planting density, optimal fertilization and irrigation are essential. Such information is very scanty for the aforementioned region, probably because canola production is a rarity. A general overview of agronomic practices is given by Hammond (2011), but these are usually site-specific due to being based on experience in the Western Cape (DAFF, 2020). As canola will probably be cultivated under irrigation in a semiarid climate, quantification of the crop's water use will be vital to several role players in the farming industry. Farmers need such information for planning weekly and seasonal water budgets at farm level (Barnard et al., 2013; Barnard et al., 2021), i.e., irrigation scheduling decisions. In addition, farmers can benefit from knowledge regarding canola's response to sustained deficit irrigation (SDI), as a strategy for reducing agricultural water use. SDI has been recognized as a popular deficit irrigation strategy (Fereres and Soriano, 2007). With this strategy water deficit increases progressively during the season, because of a reduced irrigation depth per event, which allows plants to adapt to water deficits in soils with high water storage capacities. On the other hand, water user associations require this kind of information for balancing the supply and demand of water by all the farming enterprises at scheme level (Steduto et al., 2007; Barnard et al., 2015). Agricultural engineers may also benefit from this knowledge when designing irrigation systems (Reinders, 2011).
In South Africa, to our knowledge, very little research has been done on the evapotranspiration and response of canola to water deficits. The research done by Tesfamariam et al. (2010) and Dirwai et al. (2021) at Pretoria and Pietermaritzburg, respectively, are the exceptions. Even internationally, evapotranspiration data for cultivated canola under irrigation in a semi-arid climate are not abundant. Reported evapotranspiration values range between 390 and 710 mm, (e.g., Tesfamariam et al., 2010; Kamkar et al., 2011; Sadras and McDonald, 2012; Ismail, 2016; Abdelraouf et al., 2021). A similar argument can be made regarding the lack of benchmarks for several water use indicators that are used to assess on-farm irrigation decisions. This is aggravated by the lack of consensus regarding terms and equations used for various indicators (Fernández et al., 2020).
Despite that canola has a high plasticity, it is important that plant density matches SDI because of the complementary nature of the two factors (Angadi et al., 2003). Across a range of 175 to 420 mm water application in central Free State, the highest seed (4 653 kg-ha-1) and stover (5 388 kg-ha-1) yield was realized at densities of 25 and 75 plants-m-2 (Seetseng et al., 2022). The influence of the two factors on one another is, to our knowledge, rarely investigated with respect to water use by canola. Either SDI or plant density was shown independently to influence water use indicators (Hergert et al., 2016; Abelraouf et al., 2021).
A need therefore exists in South Africa for in-situ values of evapotranspiration and various water use indicators when canola is cultivated under a semi-arid climate in a summer rainfall region. The objectives with this study were two-fold: to quantify the effects of sustained deficit irrigation and plant density combinations on (i) seasonal evapotranspiration and (ii) various water use indicators for canola.
MATERIALS AND METHODS
Description of experimental site
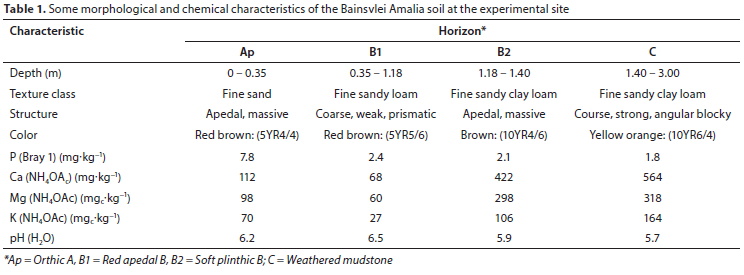
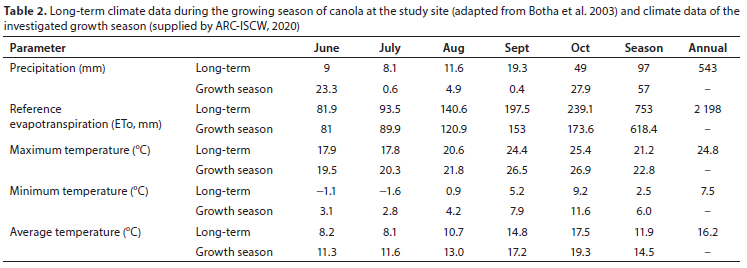
The study was conducted in 2016 on the experimental farm of the Department of Soil, Crop and Climate Sciences, University of the Free State. This farm is located (latitude = 29° 01' 12" S, longitude = 26° 08' 60" E, elevation = 1 354 m) about 15 km northwest of Bloemfontein. The soil of the experimental site was classified as a Bainsvlei soil form of the Amelia family (Soil Classification Working Group, 1991), which qualifies as a Plinthosol (Fey, 2010), although a few of the set criteria are not met (Van Huyssteen, 2020). Some properties of the deep, apedal, eutrophic soil relevant to the study are given in Table 1. The soil has a high potential, with no apparent physical, chemical or biological constraints for canola production. Long-term climate data of Glen Agriculture Institute situated 30 km from the study site (adapted from Botha et al., 2003) and climate data for the canola growing season, which was measured with an automatic weather station located 50 m from the study site (supplied by ARC-SCW, 2020), are presented in Table 2. The precipitation and reference evapotranspiration were slightly lower than the long-term values, while the opposite is true for maximum, minimum and average temperatures.
Agronomic practices
Before the onset of the experiment, the area was used for commercial wheat production. After the summer fallow period of 5 months, fertilizers were broadcast with a fertilizer caster at a rate of 170 kg N-ha-1 as limestone ammonium nitrate (28% N) and 60 kg P-ha-1 as single superphosphate (10.5% P). These applications were estimated for the assumed 5 000 kg-ha-1 seed yield under no water shortage conditions using published (FERTASA, 2016) removal figures of 40 kg N and 7 kg P per 1 000 kg seed. The estimated amounts of 200 kg N-ha-1 and 35 kg P-ha-1 were down-scaled to 170 kg-ha-1 for N mineralization and up-scaled to 60 kg P-ha-1 for extractable P increase, respectively. Thereafter the area was ploughed to a depth of 0.25 m and then disk ploughed to smooth the soil surface. A rotavator was used to prepare a seedbed. The canola cultivar Outback was planted mid-June 2011 with a modified Bramley wheat planter at a seeding rate of 6.2 kg-ha-1 as recommended. Unfortunately, this cultivar became obsolete within a few years of completion of the experiment due to exceptional advances with canola hybrids.
Experimental design and treatments
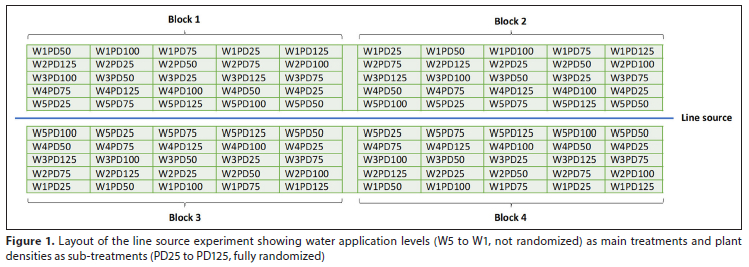
The line source irrigation approach of Hanks (1976) was used (Fig. 1). Five non-randomized water application levels (full irrigation, SDI67%, SDI52%, SDI34% and SDI19%, hereafter referred to as W5, W4, W3, W2 and W1 respectively) were combined with five fully randomized plant densities (25, 50, 75, 100 and 125 plants-m-2, hereafter referred to PD25, PD50, PD75, PD100 and PD125, respectively). The resulting 25 treatment combinations were replicated 4 times as blocks.
The water application level decreased approximately linearly, in a perpendicular direction from the lateral on both sides, W5 to W1. Bird 30H sprinklers (Rain Bird Cooperation, Azusa, California, USA) were installed on the lateral with 1.5 m rises (20 mm diameter) at 6 m intervals. The operating pressure was set at 350 kPa throughout the growing season. Irrigation was not always possible at wind speeds lower than the specified 3 m-s-1. Water applications were therefore measured with rain gauges installed just above the plant canopy. The perpendicular distances of the rain gauges from the lateral were 11.1, 9.0, 6.9, 4.8 and 2.7 m for the W1 to W5 treatments, respectively. Seasonal mean irrigation amounted to 118 mm for W1, 176 mm for W2, 238 mm for W3, 294 mm for W4 and 363 mm for W5, i.e., water application treatments with a mean reduction in irrigation depth per event of 67%, 52%, 34%, 19% and 0%, respectively (SDI67%, SDI52%, SDI34%, SDI19% and full irrigation). This resulted in water application levels of 175 mm, 233 mm, 295 mm, 351 mm and 420 mm when the 57 mm precipitation (Table 2) is added. Seasonal irrigation at W5 was estimated based on the assumption that a seed yield of 5 000 kg ha-1 with a water use efficiency of 14 kg-ha-1-mm-1 is attainable (e.g., Taylor et al., 1991; Robertson and Kirkgaarde, 2005). Based on volumetric water contents measured weekly with a calibrated neutron water meter (CPN 503 Hydroprobe) at 300 mm intervals to 2.1 m depth, soil profiles of the W5 plots were refilled to upper drain limit (0.24 mm-mm-1) by weekly irrigations. The upper drain limit of the soil was determined in a previous study (Bennie et al., 1994). The amount of water irrigated each time was measured in the rain gauges as a check.
The experimental block consisted of 45 plant rows parallel to each side of the lateral. Plant rows started 0.3 m from the lateral and were spaced at 0.3 m widths. Three rows, with the installed rain gauge in the centre row, were used to represent a plot which was 10.4 m long. The area of an individual plot was therefore 9.36 m2. Three weeks after germination, the seedlings were hand thinned to densities of 7.5, 15, 22.5, 30, and 37.5 plants-m-1 in the row, hence equivalent to 25, 50, 75, 100 and 125 plants-m-2 for the PD25, PD50, PD75, PD100 and PD125 treatments, respectively. According to literature, this plant density range covers the full spectrum usually recommended for diverse water supply conditions (e.g., Clarke and Simpson, 1978; Momoh and Zhou, 2001; Gan et al., 2007). In the Western Cape Province, due to the introduction of modern canola hybrids, the recommended plant density was reduced from 80 to 50 plants-m-2 for production of dryland canola.
Data collection and processing
Seasonal (S) evapotranspiration (ET, mm) was calculated with Eq. 1, where P is precipitation (mm), I is irrigation (mm), D is drainage (mm), R is run-off (mm) and ΔW is the change in soil water content of the measured profile (mm).

Precipitation and irrigation were measured with the installed rain gauges. The concept of crop-modified upper limit (CMUL) as described by Hattingh (1993) was used to calculate drainage. Weekly measured volumetric soil water content in the W1PD75 experimental plots was never above CMUL values, indicating no drainage. The maximum application rate of the line source irrigation system (6.25 L-h-1) was lower than the soil's final infiltration rate (13.2 L-h-1), as measured with a double ring infiltrometer by Bennie et al. (1994), implying that there was no runoff during irrigation. No signs of runoff were observed also after rainfall events. Runoff was therefore assumed to be zero. Gravimetric soil water content was measured in all plots at the start (first week of June) and the end of the growing season (last week of November).
Seasonal change in soil water (Eq. 1) was obtained from samples that were collected in triplicate from a plot at 0.3 m depth intervals to 1.5 m, using an Edelman auger. The samples were weighed immediately, before drying at 105°C to constant weight. After drying, the samples were weighed again to calculate gravimetric water content. The gravimetric soil water contents were converted to volumetric soil water contents using bulk densities (Hillel, 1982), measured with the core method (Blake and Hartge 1986). For the conversions, bulk density values of 1 670, 1 650, 1 600, 1 660 and 1 690 kg-m-3 were used for the 0-300, 600-900, 9001 200 and 1 200-1 500 mm depth intervals, respectively.
Indicators of water use by canola that were calculated were crop water use efficiency (WUEC) and water productivity for either bio-mass (WPBM) or seed (WPS) yield. According to Perry et al. (2009), WUEC is the ratio of the amount of water used by the crop to the total amount of water added through irrigation and precipitation. In this study WP is the ratio between either above-ground biomass or seed yield and evapotranspiration (Fernandez et al., 2020).
Harvesting was done by hand because the experimental farm is not equipped with a plot combine harvester. The seed and stover yield of canola in each plot were determined on an area of 6 m2. After racemation, plastic sheets were spread between the rows to collect shattered pods. The plants were cut just above the soil surface when most of the pods had matured. All of the plants and pods were put into plastic bags before being transferred to a glasshouse and dried to constant weight. Seeds were then separated from the pods by hand, and seed and stover were weighed separately. These weights were converted to kg-ha-1 before biomass yield (seed yield plus stover yield) and harvest index (seed yield/biomass yield) were calculated.
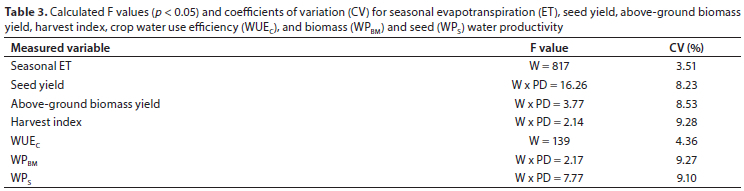
Two-way analyses of variance were done at a confidence level of 95% with the NCSS statistical package, on seasonal evapotranspiration, seed yield, above-ground biomass yield, harvest index, WUEC, WPBM and WPS, after testing residuals for normality and variance for homogeneity (Hintze, 1998). Table 3 provides the associated F values and coefficients of variation for the above-mentioned variables. Treatment means were compared where necessary with Tukey's multiple comparison test by calculating honestly significant differences (HSD) at p = 0.05. The associated HSD values for the main (SDI, PD) or interacting (SDI x PD) effects are provided in the captions of Figs 2 to 7.
RESULTS AND DISCUSSION
Seasonal evapotranspiration
The seasonal ETs for each SDI and plant density treatment are summarized in Fig. 2. With a mean seasonal reference evapotranspiration (ETo) of about 620 mm, the mean seasonal ET over the various plant densities for the fully irrigated treatment amounted to 429 mm (standard deviation = 14 mm). Tesfamariam (2004) reported seasonal ET values of about 700 mm for canola produced on the highveld (Pretoria) of South Africa. From several field trials done in California, USA, George et al. (2018) reported maximum ET values of about 360 mm. For the High Plains of the USA, maximum seasonal ET amounted to 582 mm (Hergert et al., 2016), while in Albacete, Spain, López-Urrea et al. (2020) measured a seasonal ET of 472 and 602 mm during 2008 and 2012, respectively. Katuwal et al. (2020) reported seasonal ETs of 582 and 459 mm during 2015 and 2016, respectively, as measured at New Mexico State University, USA.
In contrast to planting density, the SDI treatments influenced seasonal ET significantly (Fig. 2). Reducing the irrigation depth per event by 19%, through an SDI strategy, did not affect seasonal ET compared to where full irrigation was applied. This was possible because of the soil's high water storage capacity (sandy loam 1.5 m deep = ± 170 mm, Bennie et al., 1994) given that rainfall was about 50 mm, i.e., the mean change in soil moisture over the growing season for the SDI19% treatment amounted to -71 mm. Reducing the irrigation depth per event by more than 20% under these aforementioned conditions, will decrease the mean seasonal ET by 3.5 mm per unit percentage increase, irrespective of plant density.
Yield and harvest index
The effects of SDI and plant density on seed yield are displayed in Fig. 3. Seed yield was highest (approx. 5 000 kg-ha-1) with 0% SDI at PD25 and lowest (approx. 500 kg-ha-1) with 67% SDI at PD125. Regardless of the SDI treatment, seed yield decreased from PD25 to PD125. Compared to the current recommended plant density of 50 plants-m-2 for dryland canola in the Western Cape, a plant density of 25 plants-m-2 is apparently suitable for SDI canola in the Free State. This lower plant density can be attributed to the high plasticity of canola (Seetseng et al., 2022).
Figure 4 shows the effect of SDI and plant density on above-ground biomass yield. An SDI of 19% and 34% reduced mean above-ground biomass yield by 23% and 39%, respectively, compared to full irrigation. The mean above-ground biomass yield stabilized just below 4 000 kg-ha-1 when the irrigation depth per event was reduced by more than 52%, through an SDI strategy, irrespective of plant density. The PD25, PD50 and PD75 did not significantly influence above-ground biomass yield for all the SDI treatments on average. Only at a PD100 and PD125 did mean above-ground biomass yield decrease by 16% and 25%, respectively, compared to the mean of PD25, PD50 and PD75.
Figure 5 depicts the harvest index as affected by SDI and plant density. The SDI67% treatment significantly reduced the mean harvest index, irrespective of plant density, compared to the other treatments. For PD75, PD100 and PD125, the mean harvest index was below 0.2 and for PD25 and PD50 it was 0.28 and 0.20, respectively. Less than 50% of maximum biomass was produced, irrespective of the plant density. Hence, the results of this study were in accordance with literature on deficit irrigation. According to Fereres and Soriano (2007), a maximum harvest index for maize (Farre and Faci, 2006), wheat (Ilbeyi et al., 2006) and sunflower (Soriano et al., 2002) should be realized when irrigation is sufficient to produce at least 60% of maximum biomass.
An important interaction of SDI and plant density on harvest index of canola only became evident when the irrigation depth per event was not reduced by 52% or less. No literature on this was found. In the case of PD25, the mean harvest index was more than 0.45, irrespective of SDI strategy. Hence, the harvest index was maintained close to a maximum value even when only 38% (SDI52%), 55% (SDI34%) and 70% (SDI19%) of maximum biomass was produced, provided the plant density is low (PD25). When the plant density was increased to PD50 the mean harvest index for the various SDI treatments, except for SDI19, decreased below 0.4. A further increase in plant density (i.e., PD75, PD100 and PD125) for SDI34%, SDI19% and SDIcontrol, did not significantly influence the harvest index, as the mean value stabilized at 0.35 with a standard deviation of 0.023. With these treatment combinations more than 60% of maximum biomass was produced. At SDI52% the mean harvest index for PD75, PD100 and PD125 was 0.28, while a mean 44% of maximum biomass was produced.
Water use indicators
The WUEC for canola is presented in Fig. 6. A value of 1 would indicate highly efficient use of irrigation-plus-precipitation in supplying canola evapotranspiration. As expected, plant density did not influence WUEC. An advantage of SDI is clearly shown in Fig. 6, as a unit percentage reduction in irrigation depth per event caused a mean increase in WUEC of 0.0053.
Canola's WPBM and WPS as influenced by SDI and plant density are shown in Fig. 7. No clear visual trend regarding the response of WPBM to SDI and PD was observed. This is probably because of the plasticity properties associated with the production of canola (Seetseng et al., 2022). It seems however that for PD100 and PD125 the WPBM was lower compared to the other plant densities, irrespective of SDI. The highest mean WPBM for SDI67%, SDI52%, SDI34%, SDI19% and SDIcontrol was 18, 15, 17, 18 and 22 kg-ha-1-mm-1 for PD75, PD50, PD75, PD75 and PD75, respectively (Fig. 7).
The highest WPs was obtained with no SDI at PD25, which amounted to a mean of 11 kg-ha-1-mm-1. Tesfamariam (2004), George et al. (2018), Faraji et al. (2009), Hergert et al. (2016) and Katuwal et al. (2020) reported maximum WPs values of around 5, 16, 12, 7.5 and 4.4 kg-ha-1-mm-1, for canola produced in Pretoria (South Africa), California (USA), Gonbad (Iran), Scottsbluff and Alliance (High Plains, USA) and Clovis (U.S. Southern Great Plains), respectively. For all treatments a visual decreasing trend in WPs can be observed with an increase in plant density. The WPS at all plant densities also tended to decrease with an increase in the reduction of irrigation depth per event (Fig. 7). The authors acknowledge that these decreasing trends in WPS due to SDI and PD are apparently non-linear. However, due to the limited data points a multiple linear regression was done. WPS was taken as the dependent variable and SDI and PD as the independent variables, which explained a high (R2 = 0.87) proportion of variation in WPS. The regression (function), intercept and two independent variables (SDI and PD) were highly significant (at 1%). The intercept amounted to 10.13 kg-ha-1-mm-1. For a unit increase in the percentage reduction of irrigation depth, through SDI, WPS decreased by a mean of 0.071 kg-ha-1-mm-1, while a unit increase in plant density will decrease WPS by a mean of 0.033 kg-ha-1-mm-1. Katuwal et al. (2020) reported a mean WPS of 2.8, 4.7 and 2.2 kg-ha-1-mm-1 for treatments of no irrigation at the reproductive stage, no irrigation at the vegetative stage and dryland canola, respectively.
The water use indicators were established with an outdated cultivar that is no longer locally available and is likely inferior to current genetics in terms of the estimated indicators. Hence the water use indicators may deviate from those reported here if the study is repeated with new hybrids that usually have a higher harvest index when they are not subject to any stress (Steduto et al., 2012). Steduto et al. (2012) are of the opinion, however, that changes in fertilizer applications and atmospheric CO2 concentrations have a larger influence on water use indicators than plant breeding, aspects that have not yet been thoroughly investigated. But if water use indicators are indeed significantly influenced by improved canola hybrids, the implication is that the indicators should be regularly updated to optimize the cultivation of irrigated canola. A thorough study to quantify the influence of canola hybrids on water use indicators is therefore suggested.
CONCLUSION
The data derived from this study with an outdated cultivar could support informed decision making when canola production is expanded to the semi-arid summer rainfall areas of South Africa, especially under irrigation. Seasonal evapotranspiration was not significantly influenced by plant density. Reducing the irrigation depth per event by less than 20% through sustained deficit irrigation for this deep sandy loam soil did not significantly decrease seasonal evapotranspiration compared to fully irrigated plants. Decreasing irrigation depth per event further reduced seasonal evapotranspiration by 3.5 mm per unit percentage increase in the irrigation deficit.
Water use efficiency (evapotranspiration/rainfall-plus-irrigation) increased by a mean of 0.5% for a unit percentage reduction in irrigation depth per event. No sustained deficit irrigation and a plant density of 75 plants-m-2 provided the highest biomass water productivity (22 kg-ha-1-mm-1). Biomass water productivity did not differ much between the various sustained deficit irrigation treatments for plant densities of 50 and 75 plants-m-2 (15 to 18 kg-ha-1-mm-1). Full irrigation and a plant density of 25 plants-m-2 gave the highest seed water productivity (11 kg-ha-1-mm-1).
A percentage reduction in irrigation depth and increase in plant density reduced seed water productivity by 0.071 and 0.033 kg-ha-1-mm-1, respectively.
ACKNOWLEDGEMENTS
Our gratitude to the National Department of Agriculture, National Research Foundation and University of the Free State for financial support of this study. The study would also not have been possible without the help of several staff members of the Department of Soil, Crop and Climate Sciences.
REFERENCES
ABDELRAOUF RE, EL-SHAWADFY MA, DEWEDAR OM and HOZAYN M (2021) Improving yield and water productivity of canola under irrigation frequency of N-fertilization. Asian J. Plant Sci. 20 143-156. https://doi.org/10.3923/ajps.2021.143.156 [ Links ]
AGENBAG GA and DE KOCK J (2009) Overview: canola in South Africa. Protein Research Foundation, Pretoria. [ Links ]
ANGADI SV, CUTFORTH HW, McCONKRY BG and GAN Y (2003) Yield adjustment by canola at different plant populations under semi-arid conditions. Crop Sci. 43 1538-1366. https://doi.org/10.2135/cropsci2003.1358 [ Links ]
ARC-SCW (Agricultural Research Council - Soil, Climate and Water, South Africa) (2020) Agrometeorological data base. Agricultural Research Council - Soil, Climate and Water, Pretoria. [ Links ]
BARNARD JH, BENNIE ATP, VAN RENSBURG LD and DU PREEZ CC (2015) Swamp: a soil layer supply model for simulating macroscopic crop water uptake under osmotic stress. Agric. Water Manage. 148 150-163. https://doi.org/10.1016/j.agwat.2014.09.024 [ Links ]
BARNARD JH, MATTHEWS N and DU PREEZ CC (2021) Formulating and assessing of on-farm water and salt management practices: Lessons from non-saline and water-logged irrigated fields. Agric. Water Manage. 247 106706. https://doi.org/10.1016/j.agwat.2020.106706 [ Links ]
BARNARD JH, VAN RENSBURG LD, BENNIE ATP and DU PREEZ CC (2013) Simulating water uptake of irrigated field crops from non-saline water table soils: validation and application of the model SWAMP. Agric. Water Manage. 126 19-32. https://doi.org/10.1016/j.agwat.2013.04.008 [ Links ]
BENNIE ATP, HOFFMAN JE, COETZEE MJ and VREY HS (1994) Storing and using of rainwater for the stabilization of plant production in semi-arid areas (In Afrikaans). WRC Report No. 227/1/94. Water Research Commission, Pretoria. [ Links ]
BEUKES DJ, BENNIE ATP and HENSLEY M (2004) Optimizing soil water balance components for sustainable crop production in dry areas of South Africa. In: Rao SC and Ryan J (eds) Challenges and Strategies for Dryland Agriculture. Crop Science Society of America, Madison. [ Links ]
BLAKE GR and HARTGE KH (1986) Bulk density. In Klute A (ed.). Methods of Soil Analysis. Part 1: Physical and Mineralogical Methods. Soil Science Society of America, Madison, Wisconsin. [ Links ]
BOTHA JJ, VAN RENSBURG LD, ANDERSON JJ, HENSLEY M, MACHELI MS, VAN STADEN PP, KUNHLANDE G, GROENEWALT DG and BAIPHETHI MN (2003) Water conservation techniques on small plots in semi-arid areas to enhance rainfall efficiency, food security sustainable crop production. WRC Report No. 1176/1/03. Water Research Commission, Pretoria. [ Links ]
CLARKE JM and SIMPSON GM (1978) Influence of irrigation and seeding rates on yield and yield components of Brassica napus cv. Tower. Can. J. Plant Sci. 58 731-737. https://doi.org/10.4141/cjps78-108 [ Links ]
CROP ESTIMATES COMMITTEE (2022) Winter cereals: Final area planted and production figures. Directorate of Statistics and Economic Analysis, Department of Agriculture, Land Reform and Rural Development, Pretoria. [ Links ]
DAFF (Department of Agriculture, Forestry and Fisheries, South Africa) (2019) A profile of the South African canola market value chain. Directorate Marketing of the Department of Agriculture, Forestry and Fisheries, Pretoria. [ Links ]
DAFF (Department of Agriculture, Forestry and Fisheries, South Africa) (2020) Production guideline for canola. Department of Agriculture, Forestry and Fisheries, Pretoria. [ Links ]
DE KOCK J (2018) Development plan for canola - 2018. Protein Research Foundation, Protein. [ Links ]
DIRWAI TL, SENZANJE A and MABHAUDHI T (2021) Calibration and evaluation of the FAO AquaCrop model for canola (Brassica napus) under varied moistube irrigation regimes. Agriculture 11 410. https://doi.org/10.3390/agriculture11050410 [ Links ]
FARAJI A, LATIFI N, SOLTANI A and RAD AHS (2009) Seed yield and water use efficiency of canola (Brassica napus L.) as affected by high temperature stress and supplemental irrigation. Agric. Water Manage. 96 132-140. https://doi.org/10.1016/j.agwat.2008.07.014 [ Links ]
FARRé I and FACI JM (2006) Comparative response of maize (Zea mays L.) and sorghum (Sorghum bicolour L. Moench) to deficit irrigation in a Mediterranean environment. Agric. Water Manage. 83 135-143. https://doi.org/10.1016/j.agwat.2005.11.001 [ Links ]
FERERES E and SORIANO MA (2007) Deficit irrigation for reducing agricultural water use. J. Exp. Bot. 58 147-159. https://doi.org/10.1093/jxb/erl165 [ Links ]
FERNáNDES JE, ALCON F, DIAZ-ESPEJO A, HERNANDEZ-SANTANA V and CUEVAS MV (2020) Water use indicators and economic analysis for on-farm irrigation decision: a case study of a super high density olive orchard. Agric. Water Manage. 237 106074. https://doi.org/10.1016/j.agwat.2020.106074 [ Links ]
FERTASA (2016) Fertilizer Handbook (8th edition). Fertilizer Association of South Africa, Pretoria. [ Links ]
FEY MV (2010) Soils of South Africa. Cambridge University Press, Cambridge. [ Links ]
GALAL S (2021) Production of Canola in South Africa 2000 - 2019. Statistica GmbH, Hamburg. [ Links ]
GAN Y, MAHI SS, BRANDT S, KATEPA-MUPONDWA F and KUTCHER HR (2007) Brassica juncea canola in the Great Plains: responses to diverse environments and nitrogen fertilization. Agron. J. 99 1208-1218. https://doi.org/10.2134/agronj2006.0296 [ Links ]
GEORGE N, THOMPSON SE, HOLLINGSWORTH J, ORLOFF S and KAFFKA S (2018) Measurement and simulation of water-use by canola and camelina under cool-season conditions in California. Agric. Water Manage. 196 15-23. https://doi.org/10.1016/j.agwat.2017.09.015 [ Links ]
HAMMOND R (2011) Agronomy. In: Daun JK, Eskin NAM and Hickling D (eds) Canola: Chemistry, Production, Processing, and Utilization. AOCS Press, Urbana, Illinois. [ Links ]
HANKS RJ (1976) Model for predicting plant yield as influenced by water use. Agron. J. 66 660-665. https://doi.org/10.2134/agronj1974.00021962006600050017x [ Links ]
HARDY MB and WALLACE MG (2013) Determining the area of arable land suited to canola production in the Western Cape. Western Cape Department of Agriculture, Elsenburg. [ Links ]
HATTINGH HW (1993) The estimation of evaporation from soil surface under rainfed wheat and maize cultivation (In Afrikaans). MSc. Agric. Dissertation, University of the Free State. [ Links ]
HERGERT GW, MARGHEIM JF, PAVLISTA AD, MARTIN DL, SUPALLA RJ and ISBELL TA (2016) Yield, irrigation response and water productivity of deficit to fully irrigated spring canola. Agric. Water Manage. 168 96-103. https://doi.org/10.1016/j.agwat.2016.02.003 [ Links ]
HILLEL D (1982) Introduction to Soil Physics. Academic Press, New York. https://doi.org/10.1016/B978-0-08-091869-3.50005-6 [ Links ]
HINTZE JL (1998) Number Cruncher Statistical System - NCSS 2000. NCSS, Kaysville, Utah. [ Links ]
ILBEYI A, USTUN H, OWEIS T, PALA M and BENLI B (2006) Wheat water productivity and yield in a cool high land environment: effect of early sowing with supplemental irrigation. Agric. Water Manage. 82 399-410. https://doi.org/10.1016/j.agwat.2005.08.005 [ Links ]
ISMAIL SM (2016) Maximizing production and irrigation water productivity of canola crop (Brassica napus L.) under arid land conditions. Irrig. Drainage 65 254-263. https://doi.org/10.1002/ird.1956 [ Links ]
KAMKAR B, DANESHMAND AR, GOOSHCHI F, SHIRANIRAD AH and LAROUDI AR (2011) The effects of irrigation regimes and nitrogen rates on some agronomic traits of canola under semiarid environment. Agric. Water Manage. 98 1005-1012. https://doi.org/10.1016/j.agwat.2011.01.009 [ Links ]
KATUWAL KB, CHO Y, SINGH S, ANGADI SV, GEGNA S and STAMM M (2020) Soil water extraction pattern and water use efficiency of spring canola under growth-stage-based irrigation management. Agric. Water Manage. 239 106232. https://doi.org/10.1016/j.agwat.2020.106232 [ Links ]
LÓPEZ-URREA R, SANCHEZ JM, DE LA CRUZ F, GONZALEZ-PIQUERAS J and CHAVEZ JL (2020) Evapotranspiration and crop coefficients from lysimeter measurements for sprinkler-irrigated canola. Agric. Water Manage. 239 106260. https://doi.org/10.1016/j.agwat.2020.106260 [ Links ]
MOMOH EJJ and ZHOU W (2001) Growth and yield responses to plant density and stage of transplanting in winter oilseed rape (Brassica napus L.). J. Agron. Crop Sci. 186 253-259. https://doi.org/10.1046/j.1439-037x.2001.00476.x [ Links ]
PERRY C, STEDUTO P, ALLEN RG and BURT CM (2009) Increasing productivity in irrigated agriculture: agronomic constraints and hydrological realities. Agric. Water Manage. 96 1517-1524. https://doi.org/10.1016/j.agwat.2009.05.005 [ Links ]
PRZYBYLSKI R and ESKIN NAM (2011) Oil composition and properties. In: Daun JK, Eskin NAM, Hickling D (eds) Canola: Chemistry, Production, Processing, and Utilization. AOCS Press, Urbana, Illinois. https://doi.org/10.1016/B978-0-9818936-5-5.50011-5 [ Links ]
REINDERS FB (2011) Irrigation methods for efficient water application: 40 years of South African research excellence. Water SA 37 765-770. https://doi.org/10.4314/wsa.v37i5.13 [ Links ]
ROBERTSON MJ and KIRKGAARDE JA (2005) Water-use efficiency of dryland canola in equi-seasonal rainfall environment. Aust. J. Agric. Res. 56 1373-1386. https://doi.org/10.1071/AR05030 [ Links ]
SADRAS VO and MCDONALD G (2012) Water use efficiency of grain crops in Australia: principles, benchmarks and management. Grains Research and Development Cooperation, Adelaide. [ Links ]
SEETSENG KA, VAN RENSBURG LD, BARNARD JH and DU PREEZ CC (2022) Influence of water application levels and plant densities on the plasticity of canola (Brassica napus L.) in central Free State, South Africa. S. Afr. J. Plant Soil 39 77-84. https://doi.org/10.1080/02571862.2021.2001597 [ Links ]
SOIL CLASSIFICATION WORKING GROUP (1991) Soil classification - a taxonomic system for South Africa. Memoirs of the National Agricultural Resources for South Africa No.15. Department of Agriculture, Pretoria. [ Links ]
SORIANO MA, VILLALOBOS FJ and FERERES E (2002) Stress timing effects on sunflower harvest index. In: Villalobos FJ and Testi L (eds) VII Congress of the European Society for Agronomy, Sevilla, Spain. JA Consejena de Agricultura y Pesca. 141-142. [ Links ]
STEDUTO P, HSIAO TC and FERERES E (2007) On the conservative behavior of biomass water productivity. Irrig. Sci. 25 189-207. https://doi.org/10.1007/s00271-007-0064-1 [ Links ]
STEDUTO P, HSIAO TC, FERERES E and RAES D (2012) Crop yield response to water. FAO Irrigation and Drainage Paper No 66. FAO, Rome. [ Links ]
TAYLOR AJ, SMITH CJ and WILSON IB (1991) Effect of irrigation and nitrogen fertilizer on yield, oil content, nitrogen accumulation and water use of canola (Brassica napus L.). Fert. Res. 29 249-260. https://doi.org/10.1007/BF01052393 [ Links ]
TESFAMARIAM EH (2004) Modelling the soil water balance of canola Brassica napus L. (Hyola 60). MSc. (Agric) dissertation, University of Pretoria. [ Links ]
TESFAMARIAM EH, ANNANDALE JG and STEYN JM (2010) Water stress effects on winter canola growth and yield. Agron. J. 102 658-666. https://doi.org/10.2134/agronj2008.0043 [ Links ]
USDA (2021) South Africa: oilseeds and products annual. Foreign Agriculture Science - United States Department of Agriculture, Washington, DC. [ Links ]
VAN HUYSSTEEN CW (2020) Relating the South African soil taxonomy to the World Reference Base for soil resources. Sun Media, Bloemfontein. https://doi.org/10.18820/9781928424666 [ Links ]
ZHOU Y, ZHAO W, LAI Y, ZHANG B and ZHANG D (2020) Edible plant oil: global status, health issues and perspectives. Front. Plant Sci. 11 1315. https://doi.org/10.3389/fpls.2020.01315 [ Links ]
 Correspondence:
CC du Preez
Email: dpreezcc@ufs.ac.za
Received: 10 November 2021
Accepted: 8 March 2023

