


Servicios Personalizados
Articulo
 Inglés (pdf)
 Articulo en XML
 Referencias del artículo
Indicadores

Links relacionados
-
 Citado por Google
 -
 Similares en Google
Compartir

 Permalink
Water SA
versión On-line ISSN 1816-7950
versión impresa ISSN 0378-4738
Water SA vol.49 no.2 Pretoria abr. 2023
http://dx.doi.org/10.17159/wsa/2023.v49.i2.3957
RESEARCH PAPER
Comprehensive characterization of selected South African brines
Brenda Mehlo; Alison Lewis; Jemitias Chivavava
Crystallization and Precipitation Research Unit, Department of Chemical Engineering, University of Cape Town, Rondebosch, Cape Town, South Africa
ABSTRACT
South Africa produces significant quantities of brines but there is insufficient information on their biological and physicochemical characteristics and nature, which limits the ability to propose sustainable brine handling procedures. This study aimed to comprehensively characterize selected brines from major brine-producing industries in South Africa. This was achieved through an analysis of the majority of the brine constituents, thereby allowing for the proposal of suitable brine handling procedures, the identification and harnessing of potential economic value, as well as the identification of the environmental impact of the brines. The brines were analysed for physical, metallic, organic, and inorganic constituents using a variety of methods including inductively coupled plasma-mass spectrometry (ICP-MS) and gas chromatography-mass spectrometry (GC-MS). The total dissolved solids (TDS) of most of the brines was below 35 000 mg/L and it was concluded that most South African brines may be brackish. All the brines contained toxic constituents in concentrations that exceeded set discharge and re-use limits. It was concluded that comprehensive characterization is crucial in understanding the quality of brines and is a crucial step in proposing suitable brine handling strategies.
Keywords: brines, comprehensive characterization, brine treatment, discharge limits, desalination, reject brine, concentrate management, disposal, sustainability
INTRODUCTION
The increasing application of desalination and wastewater treatment to produce fresh water has been responsible for the increasing production of brines as a by-product. Brines are defined as saline wastewaters with a total dissolved solids (TDS) content that is equal to or greater than 35 000 mg/L. In South Africa, mining, petrochemical, steel manufacturing, power generation, and pulp and paper industries have been identified as the largest producers of inland brines (Van der Merwe et al., 2009).
Brines are unsuitable for many domestic, industrial, and agricultural applications, and, to date, brine handling strategies involve disposal into evaporation ponds, co-disposal with municipal waste, and ocean disposal for coastal brine-producing facilities (Swartz et al., 2006). Evaporation ponds are a common brine-handling strategy for inland water treatment. However, many South African evaporation ponds are reaching their full capacity (Claassen and Masangane, 2015). South African regulations around the building of new evaporation ponds are stringent due to the environmental concerns surrounding brines; furthermore, evaporation ponds are expensive to build, and require large areas ofland. Therefore, evaporation ponds are not a viable brine-handling strategy for South African industries.
Potential brine handling strategies include minimization techniques and the recovery of salts, chemicals, and metals, which allow for the re-use of the brines. These are deemed sustainable brine handling strategies (Claassen and Masangane, 2015; Giwa et al., 2017).
To assess the potential for recovery of value from brines and understand the potential toxicity of the brines, it is critical to understand their biological and physicochemical nature. This is crucial for evaluating the potential for recovery of the constituents for reuse/resale as well as understanding the potential environmental threat posed by the brines. Such evaluations require comprehensive characterization of brines, i.e., the constituents of the brines are identified and quantified. Characterising only certain major constituents of the brines is not sufficient, as this can result in unsuitable treatment design, according to Melcer (2004).
Information about the nature of brines from the major brine-generating industries in South Africa is scanty, as well as insufficient to allow evaluation of their hazardous nature or economic potential. Harding (2018) reported on the characterization of brines by the petroleum, pulp and paper, mining, agriculture, and power generation industries in South Africa and found that the pulp and paper industry reported the lowest number of characterization parameters, while the petroleum industry reported the most comprehensive wastewater data.
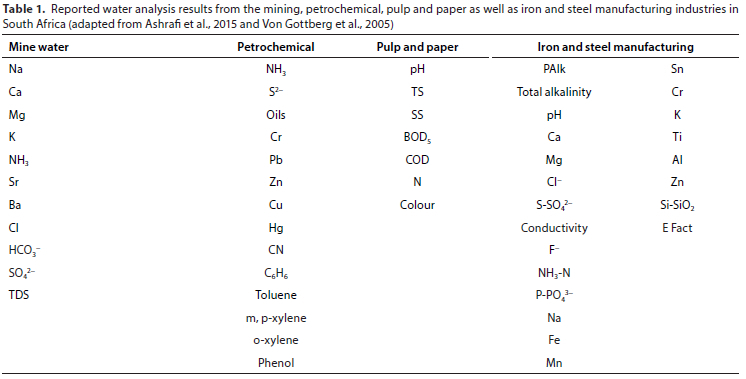
Table 1 shows the parameters tested by the mining, petrochemical, pulp and paper, and iron and steel manufacturing companies in South Africa. This information supports the analysis by Harding (2018). It can be noted that the pulp and paper industry reported the lowest number of parameters, which are largely physical and organic. The table shows that characterization is usually for the purpose of identifying potential nuisance components as well as parameters that are key for process control.
However, a comprehensive understanding of the quality of brines requires comprehensive characterization. This will allow the design of suitable treatment processes as well as the ability to identify potential economic value from these streams. Therefore, the aim of this study was to comprehensively characterize brines from major brine generating industries in South Africa to assess their quality and as a crucial step in proposing suitable brine handling strategies.
METHODS
Nature of brines: comprehensive characterization
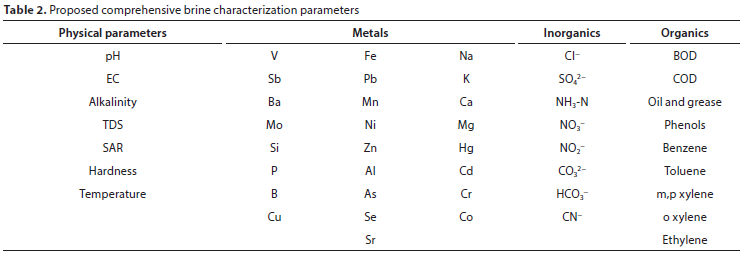
Comprehensive characterization refers to the analysis of physical parameters, metals, inorganic non-metals, and organic constituents of water (Lenore et al., 1985). A proposed list of parameters to be identified is listed in Table 2. This list was adopted from the proposed full water characterization presented by Lenore et al. (1985) and modified based on several factors, including brine sample holding time.
Selection of brines
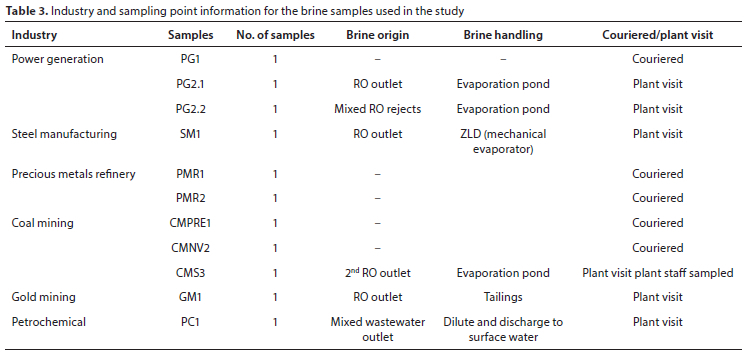
This study focused on inland high-volume brine-producing industries in South Africa, i.e., power generation, steel manufacturing, mining, petrochemical, and the pulp and paper industry. The study aimed to have a representative number of samples from each of the abovementioned industries (Table 3). However, due to limitations associated with the sourcing of brines, a limited number of samples were collected. Seasonal and spatial variations were not accounted for in this study but were considered to be relatively small since the samples are RO samples. The samples are thus not a complete representation of brines from different industries in South Africa but nonetheless can give valuable insights.
Sampling, preservation and analysis
Brine samples were collected in clean plastic and/or glass containers to preserve the integrity of the samples. Different container materials were used as some of the brine constituents can react with the materials of the container (Duncan et al., 2007). The containers were filled to the brim to limit the interaction of the samples with air and the samples were transported in ice-refrigerated containers.
Upon collection, samples were immediately placed in icerefriger-ated containers to avoid the volatilization of analytes. At the laboratories, the samples were filtered using 0.45 μηι nitrocellulose membrane filters and then preserved using 2% HNO3 (nitric acid) to a pH less than 2 (Duncan et al., 2007) to delay sample degradation. Preservation was conducted at temperatures below 4°C to ensure that there was no volatilization.
Analytical methods: physical parameters
The pH and electrical conductivity (EC) of the brines were measured using Mettler Toledo electrodes. The pH probe meters were calibrated to values 4.01, 7.00, and 10.00. The EC meter was calibrated using EC standards of 1 413 μS/cm and 12.88 mS/cm. The electrodes were rinsed with de-ionized water before every measurement. Electrical conductivity (EC) values were converted to EC25 using the nonlinear temperature compensation equation (Atkins et al., 2018).
The total dissolved solids (TDS) of the brines was calculated by adding the total ion concentration of the brines.
The sodium adsorption ratio (SAR) of the brines was calculated from the equation 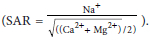 . Waters with high levels of SAR (above 9 meq/L) are not suitable for irrigation.
The total alkalinity of the brines was estimated using photometric analysis through the use of a Gallery discrete analyser, and total hardness (TH) was calculated as the sum of the Mg and Ca hardness expressed as equivalent of calcium carbonate.
Analytical methods: metals
Before the analysis of the brine samples for the presence and concentration of metal ions, microwave digestion was conducted to ensure the redissolution of solids and to free ions that were bound in chemical structures. Major and minor metallic elements were analysed using Therm ICap 6200 inductively coupled plasma-atomic emission spectrometry (ICP-AES). Ultra-trace elements were analysed using Agilent 7900 inductively coupledplasma-mass spectrometry (ICP-MS) or Agilent 8800 ICP-MS.
Calibration solutions, prepared from NIST traceable standards, were used to quantify the data, and the USEPA guideline-stated quality control procedures, were followed to ensure the accuracy of data.
Analytical methods: organics
Organic constituents were measured using different analytical equipment including Gallery discrete analyser and titration methods. The Gallery discrete analyser uses photometric measurements as well as electrochemical measurements. When using the Gallery discrete analyser, 2 mL of the filtered sample were added to the sample vials and placed in the sample rack. Reagents were selected depending on the tests to be performed and these were placed in corresponding racks. An automatic pre-dilution of the samples that were out of range was conducted before analyses.
Due to a lack of proper on-site dissolved oxygen (DO) equipment and couriered samples, DO was not measured. Chemical oxygen demand (COD) and biological oxygen demand (BOD) were measured as their holding time is 0-7 days (Duncan et al., 2007).
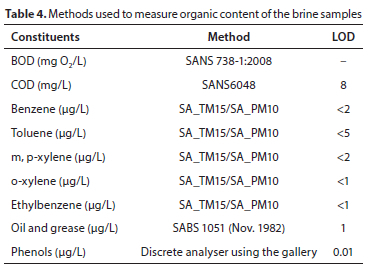
Table 4 shows a summary of the methods used to measure the reported organic constituents. The SA_TM15 test method is described as the modified USEPA 8260, quantitative determination of volatile organic compounds by headspace gas chromatography-mass spectrometry (GC-MS), and the SA_ PM10 is the sample preparation method described as modified USEPA method 5021, preparation of solid and liquid samples for GC headspace analysis. The GC-MS was used for the determination of benzene, toluene, m, p-xylene, and o-xylene.
Analytical methods: inorganics
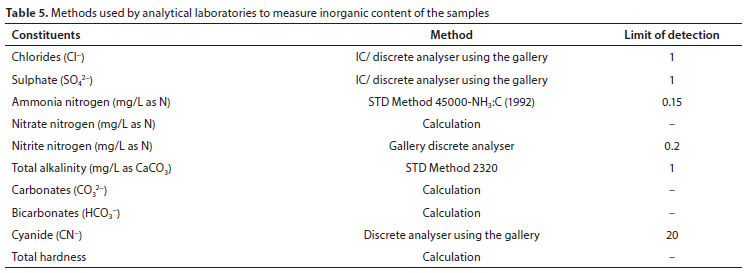
Table 5 shows the different methods and equipment used to measure the inorganic components. For the ion chromatography (IC) measurements, the IC column used was the Dionex IonPac AG16 (4 x 250 mm) and a sample volume of 10 μL was used. Eluents used were 5.0 mM NaOH, deionized water, and 100 mM NaOH at a flow rate of 1.5 mL/min and an operating temperature of 30°C.
In addition to the IC, a Gallery discrete analyser was used for some inorganics. Ammonia nitrogen was determined using Standard Method 2320 with a limit of detection (LOD) of 1.
RESULTS
The results are dealt with separately in the categories of physical parameters, metals, organic, and inorganic constituents. The ionic imbalance for each brine was found to be below 10% in each case, i.e., the analyses were sufficiently accurate to be used for modelling and evaluation purposes (Randall et al., 2013).
Physical parameters
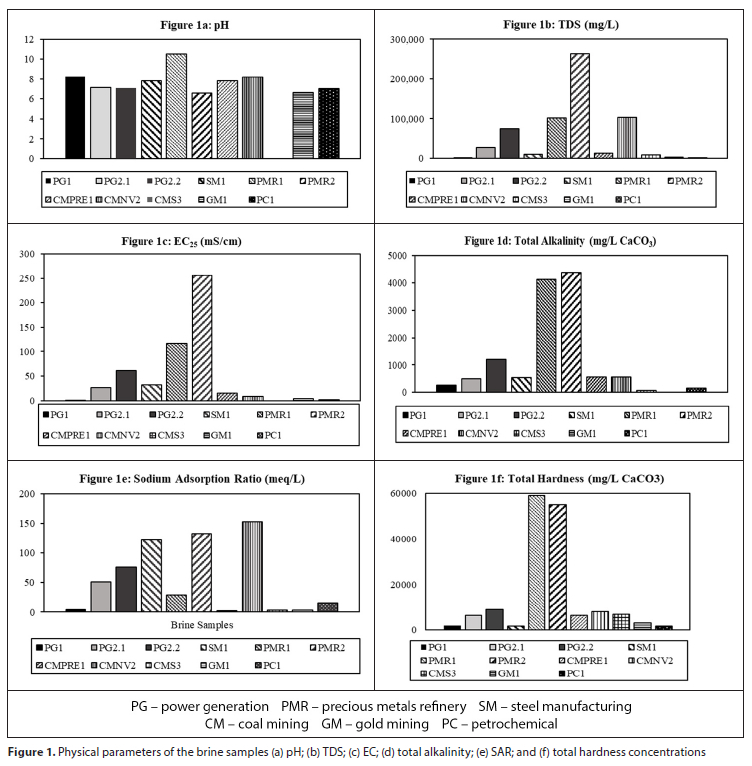
Figure 1 shows results for the physical parameters of the brines with Fig. 1a showing pH results. Brine samples from precious metals refinery (PMR2) and gold mining (GM1) had pH values of less than 7 making them acidic. The rest of the samples were alkaline, having pH values above 7. Nyamhingura (2009) reported a tested brine pH range of 6.60-8.96 from the Tutuka Power Station and the pH of all the brine samples from power generation (PG1, PG2.1, and PG2.2) was within this range. Harding (2018) presented a reported range of 6.00-10.00 for brine pH values from the petroleum industry and 6.50-9.00 for the mining industry and PC1, and all the brines from the mining sector, except PMR1, fell within these ranges. The South African Water Quality Guideline (SAWQG) for industrial use has a pH range of 6.5-8.0 for Category 2 industrial processes, and the SAWQG for domestic use has a Target Water Quality Range (TWQR) of 6-9 for pH. Category 2 water limits were used to determine the fitness of the brines for industrial use in this study. This water can be used for cooling and as process water. The pH of the PMR1 brine sample was 10.5, which was out of the TWQR for both domestic and industrial usage. The South African National Standards (SANS241, 2015) sets a range of 5-9.7 for the pH of drinking water, and all of the brines except for PMR1 were within this set range. The PMR1 brine could potentially result in scale build-up and blockages in the piping systems due to its high pH. The pH of this brine must therefore be reduced if the brine is to be used for industrial applications. The measured pH of CMS3 was not included in the graph, since the measurement was conducted after the sample had exceeded the recommended holding time.
The second parameter presented in Fig. 1b is the total dissolved solids (TDS) of the brine samples, with waters having TDS values above 35 000 mg/L being classified as brines. The SANS241 TDS standard is 1 200 mg/L and the South African Water Quality Guideline (SAWQG) for industrial use is 200 mg/L for Category 2 industrial processes. Only four of the analysed brines had TDS values above 35 000 mg/L and the rest were below this value. The four samples that contained dissolved solids above 35 000 mg/L were PG2.2, CMNV2, PMR1, and PMR2. These were therefore classified as 'true brines. The rest of the samples had TDS values ranging from 1 400 mg/L to 27 000 mg/L and were classified as brackish water. It should however be noted that although some brines had TDS values below 35 000 mg/L the respective industries referred to them as brines and in this work they were treated as such. In his research, Nyamhingura (2009) reported a TDS of 20 412 mg/L for a RO brine from Tutuka Power Station sampled in 2008, and among the three power generation brines, only PG2.1 had a TDS value close to 20 412mg/L. PG1 and PG2.2 were not sampled directly after the RO process, PG2.2 was sampled before discharge into an evaporation pond at the same plant and the TDS of PG2.2 is similar to that of Vapor Compressor brine at 71 068 mg/L as reported by Nyamhingura (2009).
Figure 1c presents the electrical conductivity (EC) of the brines. The EC25 of all the brine samples exceeded the general discharge limit of 250 mS/m, except for PG1 and PC1. The SANS241:2015 has a limit of 170 mS/m and only the EC25 of PG1 and PC1 was below this limit. A comparison between the TDS and EC graphs, Figs 1b and 1c, respectively, indicates that brines that were found to be highly saline (having high TDS values) were also found to have high EC values, as was expected. The EC value of CMS3 was not included in the data. The CMNV2 sample had a high TDS value and was expected to have a high EC. However, this was not the case. Zibi (2010) recorded a similar observation and concluded that an increase in molar ionic concentration results in electrolytic effects, resulting in a decrease in conductivity.
The alkalinities of the brines are shown in Fig. 1d. Waters with high alkalinity can result in scaling due to the precipitation of carbonate salts (DWAF, 1996). There is no domestic, discharge or SANS241:2015 limit set for alkalinity. PMR2 had the highest alkalinity of 4 300 mg/L CaCO3, followed by PMR1 with 4 100 mg/L CaCO3 and this could be a result of the alkaline solutions used when refining precious metals (Mpinga, 2012). The rest of the brines had alkalinities below 1 100 mg/L CaCO3. The alkalinities of PMR2 and PMR1 would need to be reduced to the levels specified for the targeted industrial use of the treated water. Nyamhingura (2009) reported an alkalinity value of 320 mg/L CaCO3 for the Tutuka Power Station RO brine which is in the same range as the PG1 with an alkalinity of 259 mg/L CaCO3.
Figure 1e shows the SAR of brines. Most of the brines had SAR concentrations above 40 meq/L with CMNV2 the highest at 153 meq/L, making them unfit for irrigation. Nyamhingura (2009) reported SAR values of 40.4 meq/L for the petrochemical brine and 77.8 meq/L for the Tutuka brine. Brines PG1, CMPRE1, CMS323, and GM1 had SAR values below 9 meq/L; and they could be considered for irrigation. Figure 1f shows the hardness of the brines. Brines PG1, PG2.1, PG2.2, PMR1, PMR2, CMPRE1, CMNV2, CMS3, and GM1 were classified as hard; while SM1 was classified as slightly hard and PC1 classified as moderately soft.
High levels of hardness can result in scaling of pipes, blockages, and precipitation in industrial processes due to the precipitation of sulfate and carbonate salts of calcium and magnesium which are insoluble in water, especially at elevated temperatures (DWAF, 1996). The hardness of these brines would need to be reduced in the early stages of treatment if the brines are to be used or discharged.
Metals
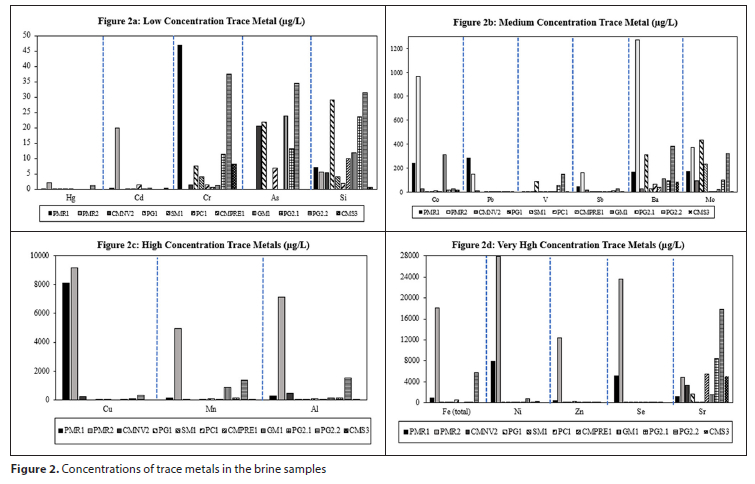
Characterization results for metal constituents were divided into trace metals presented in Fig. 2, and major metals in Fig. 3. From the results presented in Fig. 2, it can be noted that there are numerous trace metals in the different brine samples. These species can affect the design and effectiveness of brine treatment processes.
Figure 2a shows the concentrations for mercury (Hg), cadmium (Cd), chromium (Cr), arsenic (As), and silicon (Si). The discharge limit and the SAWQG limit for domestic usage for Hg are both 1 μg/L. The PMR2 and PG2.2 brine samples had Hg values that were above this limit at 2.2 μg/L and 1.3 μg/L respectively. All the other brines had concentrations below the set Hg limit. The special discharge limit for Cd is 1 μg/L and the SAWQG limit for domestic use is 0-5 μg/L. Samples PMR2 and PC1 were above the limits, with PC1 slightly above the limit at 1.5 μg/L. All brines exceeding these limits require treatment before discharge or re-use. The discharge limit for Cr is 20 μg/L and all brines had Cr concentrations below the limit, apart from PMR1 and PG2.2 having Cr concentrations of 46.8 μg/L and 37.50 μg/L, respectively. The SAWQG limit for Cr in domestic usage is 50 μg/L and all the brines had concentrations below this limit. The discharge limit and domestic usage limit for As are both set at 10 μg/L and only CMNV2, PG1, GM1, PG2.1, and PG2.2 brine samples had As concentrations exceeding this limit. These brines were therefore unfit for domestic re-use and/or discharge. No discharge limits and SAWQG limits for domestic usage are set for Si. There is a set limit of 10 mg/L in the SAWQG for industrial usage and Si concentrations of all brines were below this limit. Nyamhingura (2009) also reported an Si value of 0 for the Tutuka brine.
Figure 2b shows the trace metal concentrations for cobalt (Co), lead (Pb), vanadium (V), antimony (Sb), barium (Ba), and molybdenum (Mo). In these brine samples, Pb, V and Sb were present in low concentrations compared to Ba, Mo, and Co. The V SAWQG limit for domestic usage is 100 μg/L and only the vanadium concentration in the PG2.2 brine exceeded this, with a concentration of 147 μg/L. The SAWQG for domestic use has a limit of 10 μg/L for Pb, and the special discharge limit is 6 μg/L while the SAWQG for industrial usage did not specify a limit for Pb. Only the PMR1, PMR2, and CMNV2 brine exceeded the Pb set limits at concentrations of 287 μg/L, 147 μg/L, and 12 μg/L of Pb, respectively. There is no set SAWQG limit or discharge limit for Sb and results showed that all the brine samples had Sb concentrations below 200 μg/L. Similarly, there are no limits set for Co, Ba, and Mo and results showed that PMR1 had the highest Co concentration, above 900 μg/L, while PMR2 had the highest Ba concentration at 1 273 μg/L. All brine samples had Mo concentrations below 500 μg/L. Although some of the parameters have no set limits, exposure to high quantities is deemed toxic to humans and thus measurements of these parameters are still crucial and their levels in the brines should be below toxic levels.
Figure 2c shows results for copper (Cu), manganese (Mn), and aluminium (Al). The SAWQG domestic use limit for Cu is 1 mg/L and the special discharge limit for Cu is 2 mg/L. The Cu content of all brine samples was below these set limits except for PMR1 and PMR2, both from the precious metals refinery industries, at concentrations above 8 000 μg/L. The domestic use limit for Mn is 50 μg/L, the discharge limit is 100 μg/L and the water specifications for Category 2 industrial processes have a Mn limit of 100 μg/L. At such high concentrations, Mn could result in fouling, blockages, and discolouration due to the precipitation of Mn because of oxidation, resulting in the formation of black hydrated oxide (DWAF, 1996). All the brines, except CMNV2, PG1, SM1, CMPRE1, and CMS3, had Mn concentrations above the 100 μg/L set limit for Category 2 industrial processes. The PMR1, PMR2, PC1, GM1, PG2.1, and PG2.2 brines had Mn concentrations that exceeded both the discharge and the domestic use limits. The Al limit for domestic usage is 150 μg/L and the Al content in brines PMR1, PMR2, CMNV2, GM1 and PG2.2 exceeded this limit.
Figure 2d presents results for total iron (Fe), nickel (Ni), zinc (Zn), selenium (Se), and strontium (Sr). There are no set limits for Sr. However, the results showed most of the brines to have significant concentrations of Sr, with PG2.2 having the highest concentration at 17 800 μg/L. The domestic use limit and discharge limits for Fe are 100 μg/L and 300 μg/L, respectively. The Fe content in PMR1, PMR2, PC1, and PG2.2 exceeded both the domestic use and discharge limit while the Fe concentrations in CMNV2, SM1, and GM1 were below the discharge limit but above the limit for domestic use. The rest of the brine samples contained amounts below the specified limits. The limit of Fe in water used for Category 2 industrial processes is 200 μg/L and Fe concentrations in brine samples PMR1, PMR2, SM1, PC1 and PG2.2 exceeded this limit. Although classified as a heavy metal, there are no domestic and industrial usage limits set for the allowable concentration of Ni in water. The PMR1 and PMR2 brines, from the precious metals refinery industry, had the highest Ni concentrations as compared to other brines. The PMR2 brine had a concentration of approx. 28 000 μg/L while the PMR1 brine had a concentration of approx. 8 000 μg/L. The domestic usage limit and discharge limit for Zn are 3 000 μg/L and 40 μg/L, respectively. The recommended dietary allowance (RDA) for Zn is above 10 mg/L (Gibson et al., 2016) and this could explain the reason for the high domestic usage limit for Zn. Only brine CMNV2, PG1, CMPRE1, and CMS3 had Zn concentrations above the discharge limit and all samples except PMR2 had Zn concentrations above the domestic use limit. The Se domestic limit is 20 μg/L and the discharge limit is 20 μg/L. All brine samples had Se concentrations below the limit, except for precious metal refinery brines, which contained relatively high Se concentrations, and CMNV2 whose Se concentrations slightly exceeded the limit.
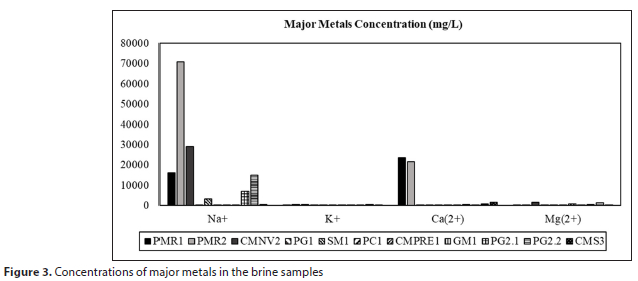
Figure 3 shows the major metals that are normally found at high concentrations in different industrial wastewaters: sodium (Na), potassium (K), calcium (Ca), and magnesium (Mg). These major metals are abundant in nature, and this can explain the high concentrations in some of the brines. The results show that most of the brine samples contained high Na concentrations, followed by Ca, Mg and then K.
Sodium usually occurs naturally in the form of sodium chloride, and, due to its high solubility in water, industrial wastewaters typically contain elevated concentrations of sodium (DWAF, 1996). The domestic use limit for Na is 100 mg/L and this is because at higher levels Na causes a salty taste in water and can also aggravate some disease conditions such as hypertension. The Na concentration in all the brine samples was above this limit. The brine sample from the precious metals refinery (PMR2) had the highest Na concentration, at 70 000 mg/L, followed by CMNV2, which originated from coal mining, with a concentration of 29 000 mg/L. The sodium adsorption ratios of both CMNV2 and PMR2 were the highest of all the brine samples, and this can be attributed to their high sodium concentrations. These high concentrations could be a result of the mineralogy of the ores at the different mining sites as well as the chemicals used in the processes.
Potassium is normally found in high concentrations in wastewaters and brines due to its high solubility (DWAF, 1996). The domestic usage limit for K is 50 mg/L due to the negative health effects that high levels of K have on humans. All the brine samples, except SM1, PC1, CMPRE1, and GM1, contained K in quantities above this limit. Nyamhingura (2009) reported K values of 164 mg/L for the Tutuka Power Station and 790 mg/L for the petrochemical sample, which also exceed the domestic usage limit. Potassium (K) is normally used in the alkylation processes in the petrochemical industry (Nafis et al., 2015) and this could also explain the high levels of K in brine PC1.
The limit of Ca for domestic usage is 32 mg/L and it is harmful at higher levels (DWAF, 1996). All the brines, except for PC1, had Ca concentrations exceeding this limit. Calcium is one of the key elements that contribute to the hardness of water and, as was expected, Fig. 1f showed that all the brines except SM1 were classified as hard.
The Mg concentration limit for domestic water quality is 30 mg/L. All the brines, except the power generation and coal mining brine samples, had Mg values below the limit. Similarly, Nyamhingura (2009) reported an Mg value of 201 mg/L for the Tutuka brine which also exceeds the limit for domestic water quality. These high levels of Mg could largely be due to the mineralogy of the mining sites.
Inorganic non-metals
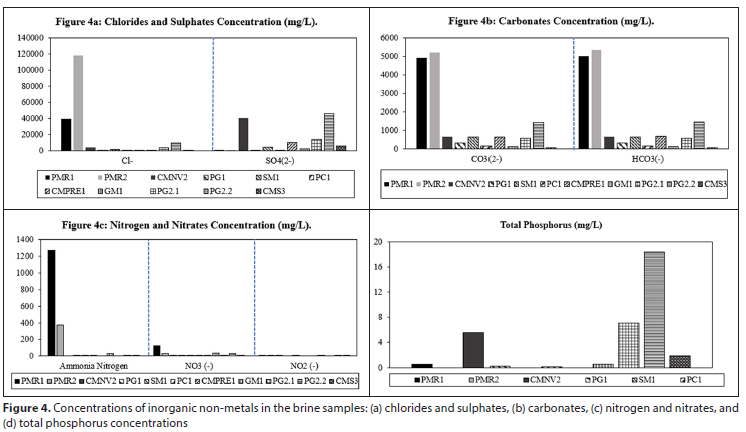
Figure 4 shows characterization for inorganic constituents, which are a group of constituents that do not contain carbon and hydrogen elements in their make-up. Inorganic constituents generally consist of chlorides, sulphates, phosphate systems, carbonate systems, and nitrogen systems. From the trends, it can be noted that precious metal brines generally contain a high inorganic content compared to the other brines. Brines from coal mining and power generation were found to contain higher phosphorus and sulphate content when compared to the other brines. All brines contained low nitrate and nitrite concentrations.
Figure 4a shows the major inorganic anions in the brines: chlorides (Cl-) and sulphates (SO42-). The SAWQG for domestic usage is 100 mg/L for Cl- and the water specifications for Category 2 industrial usage give a Cl- limit of 40 mg/L. All of the brine samples, except for CMS3, had Cl- concentrations greater than the set limits, with PMR2 having the highest Cl- concentration of approx. 120 000 mg/L, followed by PMR1 at a concentration of approx. 40 000 mg/L. Since Cl- is classified as a strong oxidizer, these high concentrations could result in corrosion. The SAWQG has an SO42- limit of 200 mg/L for domestic use and 80 mg/L for Category 2 industrial processes. All the brine samples contained SO42- concentrations above the specified limits. Brine PG2.2. had the highest SO42- concentration of approx. 45 000 mg/L followed by CMNV2 at a concentration of approx. 40 000 mg/L. These brines are therefore unfit for use in industry and domestically since high SO42- concentrations can result in corrosion and scaling as a result of salts of SO42-.
Figure 4b shows concentrations for carbonates (CO32-) and bicarbonates (HCO3-). These constituents are major indicators of the alkalinity of water and it is thus expected that brines that were identified to have high alkalinity will generally have high levels of CO32- and HCO3-. The PMR1 and PMR2 brines, from the precious metal refineries, were found to have the highest concentrations of both CO32- and HCO3-. This was an expected observation since these brines had the highest alkalinity values. The PG2.2 brine had CO32- and HCO3- concentrations of approx. 1 500 mg/L and this was expected as it had the third highest alkalinity. The rest of the brine samples had CO32- and HCO3- concentrations below 1 500 mg/L.
Figure 4c shows the concentrations of ammonia (NH3), nitrates (NO3-), and nitrites (NO2-). PMR1 and PMR2 had the highest ammonia concentrations. The discharge limit for ammonia is 2 mg/L as nitrogen and the domestic use limit is 1 mg/L. All of the brine samples, except CMS3, PG2.1, CMPRE1, PG1 and CMNV2, contained dissolved ammonia at concentrations above the set limits.
The concentration of NO2- in all of the brines was almost negligible. The SAWQG for domestic use has a nitrate/nitrite concentration limit of 6 mg/L when measured as nitrogen. The special discharge limit for nitrate/nitrite is 1.5 mg/L. The NO2- concentrations in all samples were below both limits for nitrites except for GM1 which contained 3.9 mg/L N of nitrites. Brine CMNV2 had a NO3- concentration of about 100 mg/L and this was the highest concentration recorded. All of the brine samples, except CMS3, CMPRE1, PC1, SM1, PG1, and CMNV2, had nitrate concentrations higher than the limit and could cause health problems if ingested. The nitrate content must be reduced before disposal into surface waters since excess nitrogen causes eutrophication in receiving waters.
Figure 4d shows the total phosphorus (P) concentrations in the brines and concentrations include the different forms of P in the wastewater, for example, ortho-phosphates. The discharge limit has a maximum orthophosphate special limit of 2.5 mg/L and brines CMNV2, PG2.1 and PG2.2 exceeded this limit. Phosphates are normally used as cooling tower additives for reducing scale and corrosion (Critchley and Bentham, 2009) and this could explain the high P concentration in PG2.2 and PG2. Nyamhingura (2009) reported a P value of 4.6 mg/L for the Tutuka Power Station which also exceeds the discharge limit. CMNV2 showed a high P concentration, and this possibly originated from the interaction of the ore with water during washing. Furthermore, P was possibly added as an antiscalant in reverse osmosis plants, hence the significant concentrations in the brines.
Organics
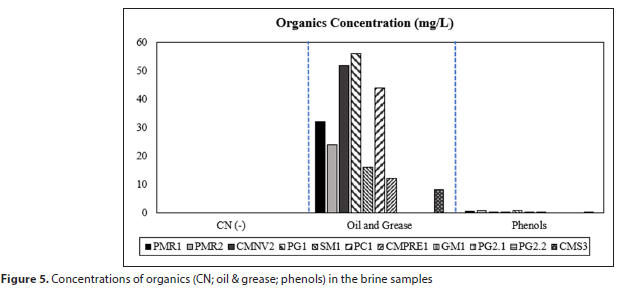
Organic constituents are carbon-based compounds present in the water. Figure 5 shows the results for CN-, O&G, and phenols. CN- concentrations were negligible and thus below the instrument detection limit for all the brine samples. The discharge limit for dissolved CN- is 0.01 mg/L. All the brines had a CN-concentration below 0.02 mg/L. It would be expected that GM1 would have a high CN- content since CN- is normally used in the refining of gold and silver. However, the sampled brine was a reject from the RO plant that treated underground water extracted during dewatering; hence the low CN- concentration.
The special discharge limit for oil and grease was 0 mg/L. All samples had very high concentrations of oil and grease and would require the removal of these species before discharge to the environment or surface waters. Phenol concentrations were found to be very low in all the brines. The SAWQG limit for domestic use for phenols was 0.001 mg/L and all brine samples, except for GM1, PG2.1 and PG2.2, exceeded this limit slightly and thus contained phenols in toxic amounts. Treatment would be required to reduce the concentration to acceptable levels.
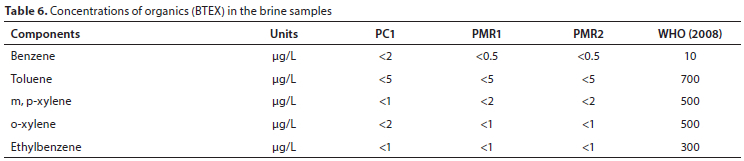
Table 6 shows the benzene, toluene, ethylbenzene and xylene (BTEX) results for brines PC1, PMR1 and PMR2. These tests were specifically done on these brines as BTEX is commonly found in these industrial processes, especially in the petrochemical industry. These results were compared to the World Health Organisation (WHO) drinking water quality standards of 2008 (WHO, 2008). All three samples had concentrations below the standards which was not expected. Given the results shown in Table 6 for brines PC1, PMR1 and PMR2, the BTEX analyses were not conducted for steel manufacturing and power generation since BTEX compounds are unlikely to be found in these wastewaters.
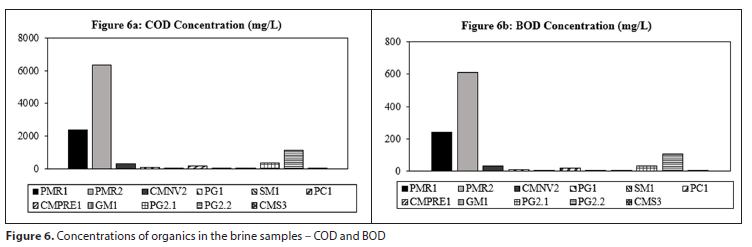
Figure 6 shows the chemical oxygen demand (COD) and biological oxygen demand (BOD). The COD followed a similar trend to the BOD, as expected. Since the COD encompasses the BOD, set limits usually only specify the COD. The industrial use limit for COD is 15 mg/L as oxygen for Category 2 processes and the special discharge limit for COD is 30 mg/L after the removal of algae. All the brines had COD concentrations above the allowable levels. Since COD gives indirect measurements of oxidizable organic matter present in water (DWAF, 1996), high levels of COD, which imply high levels of organic matter, could result in discolouration and biological growth problems. When comparing the concentration levels for the different brines, the COD concentrations are higher for the PMR industry followed by the power generation industry. According to Dobson and Burgess (2007), the PMR industry generates large volumes of wastewater containing high concentrations of organic solvents during the refining process, and this would explain the high COD levels.
The power generation facilities from which the brines in this study were collected treat the water from the mines that supply them with the coal used for generating electricity. According to Ghose (2001), the wastewater produced through the coal washing process contains high levels of COD and metals; this could explain the high COD levels in the PG brines. The COD value for PC1 was 182 mg/L; according to Harding (2018), the COD levels in the South African petroleum industry range from 50 to 100 mg/L which supports the results obtained in this study that are above the discharge limit.
The results show that all the brines tested contain constituents at levels that exceed the set limits or standards for usage and/ or disposal and that they need to be treated to reduce the concentrations of the constituents to acceptable levels.
Elsheikh and Al-Hemaidi (2012) compiled a list of different technologies that can be used to treat industrial wastewaters based on their characteristics. These technologies include chemical precipitation, membrane separation, thermal desalination, and biological treatment. Comprehensive characterization results can be used to determine the most suitable treatment process and technologies for the different brines.
CONCLUSIONS AND RECOMMENDATIONS
The following was concluded based on the comprehensive characterization results:
• Only four of the brine samples, PG2.2, PMR1, PMR2 and CMNV2 had TDS values above 35 000 mg/L, in other words, classified as 'true brines', with the rest being classified as brackish water. Since most of the selected brines were found to have low TDS values, it was concluded that there is a possibility that South African RO brines are brackish in nature. Although classified as brackish, these brines were found to have high scaling potentials as a result of their high hardness and alkalinity values, and they were found unfit for irrigation due to their high SAR. The majority of these brines had neutral pH values.
• All of the brine samples, except for CMS3 and CMPRE1, contained heavy metals in concentrations exceeding the set limits for either discharge, domestic usage or both. It was concluded that these brines are toxic, and that the reduction of these heavy metals is crucial. Brine sample CMPRE1 contained Mn in excessive amounts and thus this brine could cause staining in plumbing fixtures due to Mn oxidation and precipitation. Furthermore, all brines had major metal, Na, Ca, K and Mg, concentrations exceeding the domestic usage limit and, depending on the intended usage of the brines, these constituents must be reduced in the brines.
• Most ofthe brine samples contained high levels of chlorides, carbonates and nitrogen and these inorganic constituents can cause bad odours in water and excess nitrogen can result in eutrophication, in the case of brine discharge, of receiving waters. The inorganic constituent concentrations must be reduced.
• The organic content of the brines was high, particularly oil and grease, as well as COD. These organics must be reduced if the brines are to be discharged or re-used. It was concluded that these brines are not suitable for discharge into the environment unless treated.
• Brine samples from similar industries were found to contain slightly different constituents in varying concentrations. It is thus crucial that water discharge or re-use standards be guided by comprehensive characterization from the different key players in each industry. It is recommended that a study focusing on the full or comprehensive characterization of a representative number of brines from major brine producing industries be undertaken with the intention of proposing suitable brine handling procedures and identifying any potential economic value from these streams. The studies should include seasonal as well as temporal variations to augment this study.
AUTHOR CONTRIBUTIONS
Conceptualisation and methodology of the study, interpretation of results, draft reviews, revision after review: Prof. Alison Lewis; Mr Jemitias Chivavava.
Sample collection, sample/data analysis, interpretation of results, writing of the initial draft, revision after review: Ms Brenda Mehlo.
ORCIDS
Alison Lewis: http://orcid.org/0000-0001-6544-1227
REFERENCES
ASHRAFI O, YERUSHALMI L and HAGHIGHAT F (2015) Wastewater treatment in the pulp-and-paper industry: A review of treatment processes and the associated greenhouse gas emission. J. Environ. Manage. 158 146-157. https://doi.org/10.1016/j.jenvman.2015.05.010 [ Links ]
ATKINS PW, DE PAULA J and KEELER J (2018) Atkins' Physical Chemistry. Oxford University Press, Oxford, UK. [ Links ]
CLAASSEN M and MASANGANE W (2015) The current state and future priorities of brine research in South Africa: Workshop proceedings, February 2014. WRC Report No. KV 338/15. Water Research Commission, Pretoria. [ Links ]
CRITCHLEY M and BENTHAM R (2009) The efficacy of biocides and other chemical additives in cooling water systems in the control of amoebae. J. Appl. Microbiol. 106 (3) 784-789. https://doi.org/10.1111/j.1365-2672.2008.04044.x [ Links ]
DWAF (Department of Water Affairs and Forestry, South Africa) (1996) South African Water Quality Guidelines. Volume 1. Domestic Water Use. 190 pp. [ Links ]
DOBSON RS and BURGESS JE (2007) Biological treatment of precious metal refinery wastewater: A review. Miner. Eng. 20 (6) 519-532. https://doi.org/10.1016/j.mineng.2006.10.011 [ Links ]
DUNCAN D, HARVEY F and WALKER M (2007) EPA Guidelines: Regulatory monitoring and testing water and wastewater sampling. United States Environmental Protection Agency, Washington DC. [ Links ]
ELSHEIKH MA and AL-HEMAIDI WK (2012) Approach in choosing suitable technology for industrial wastewater treatment. J. Civ. Environ. Eng. 2 (5) 3-4. [ Links ]
GHOSE M (2001) Design of cost-effective coal washery effluent treatment plant for clean environment. J. Sci. Ind. Res. 60 (1) 40-47. [ Links ]
GIBSON RS, KING JC and LOWE N (2016) A review of dietary zinc recommendations. Food Nutr. Bull. 37 (4) 443-460. https://doi.org/10.1177/0379572116652252 [ Links ]
GIWA A, DUFOUR V, AL MARZOOQI F, AL KAABI M and HASAN S (2017) Brine management methods: Recent innovations and current status. Desalination 407 1-23. https://doi.org/10.1016/j.desal.2016.12.008 [ Links ]
HARDING GE (2018) Developing methods to access sensitive industrial wastewater information in South Africa (with treatment in mind). MSc thesis, University of Cape Town. [ Links ]
LENORE S, ARNOLD E and RHODES R (1985) Standard Methods for the Examination of Water and Wastewater Vol. 1193. American Public Health Association, Washington DC. [ Links ]
MELCER H (2004) Methods for Wastewater Characterization in Activated Sludge Modelling. IWA Publishing, London [ Links ]
MPINGA CN (2012) The extraction of precious metals from an alkaline cyanided medium by granular activated carbon. Doctoral dissertation, Stellenbosch University. [ Links ]
NAFIS DA, DETRICK KA and MEHLBERG RL (2015) Alkylation in petroleum processing. In: Handbook of Petroleum Processing. Springer, Cham. 435-453. https://doi.org/10.1007/978-3-319-14529-7_5 [ Links ]
NYAMHINGURA A (2009) Characterization and chemical speciation modelling of saline effluents at Sasol Synthetic Fuels Complex-Secunda and Tukuta power station. MSc thesis, University of the Western Cape. [ Links ]
RANDALL D, LEWIS A, RODRIGUEZ-PASCUAL M, NATHOO J, REDDY T, APSEY G, KAPEMBWA M, EGAN T and CHIVAVAVA J (2013) Extended investigations into recovery of water and salts from multi-component hypersaline brines using eutectic freeze crystallization. WRC Report No. 2012/1/13. Water Research Commission, Pretoria. [ Links ]
SWARTZ C, DU PLESSIS J, BURGER A and OFFRINGA G (2006) A desalination guide for South African municipal engineers. Water SA 32 (5) 641-647. https://doi.org/10.4314/wsa.v32i5.47845 [ Links ]
VAN DER MERWE I, LOURENS A and WAYGOOD C (2009) An investigation of innovative approaches to brine handling. WRC Report No. 1669/1/09. Water Research Commission, Pretoria. [ Links ]
VON GOTTBERG AJ, PERSECHINO JM and YESSODI A (2005) Integrated membrane systems for water reuse. Technical Paper. General Electric - Water and Wastewater Technologies. [ Links ]
ZIBI LM (2010) Industrial brine characterisation and modelling. MSc thesis, University of Cape Town. [ Links ]
 Correspondence:
Alison Lewis
Email: Alison.Lewis@uct.ac.za
Received: 2 November 2021
Accepted: 8 March 2023

