


Serviços Personalizados
Artigo
 Inglês (pdf)
 Artigo em XML
 Referências do artigo
Indicadores

Links relacionados
-
 Citado por Google
 -
 Similares em Google
Compartilhar

 Permalink
Water SA
versão On-line ISSN 1816-7950
versão impressa ISSN 0378-4738
Water SA vol.49 no.1 Pretoria Jan. 2023
http://dx.doi.org/10.17159/wsa/2023.v49.i1.3979
RESEARCH PAPER
Moisture content distribution model for the soil wetting body under moistube irrigation
Yanwei Fan; Weifan Yin; Zhiwei Yang; Yanxiang Wang; Liangjun Ma
College of Energy and Power Engineering, Lanzhou University of Technology, Lanzhou 730050, China
ABSTRACT
This study investigated the moisture distribution characteristics of a soil wetting body under different influencing factors to inform the design and management of a moistube irrigation system. A mathematical model of soil moisture movement under moistube irrigation was established based on Hydrus-2D software. The suitability of the Hydrus-2D simulation model was verified by laboratory experiments. Numerical simulations were carried out with Hydrus-2D to investigate the influence of soil texture, initial moisture content, moistube specific discharge and irrigation time on the moisture distribution of a soil wetting body. The soil moisture content is highest at the moistube, and its value is related to the moistube-specific discharge and soil texture. The soil moisture content at any point in the wetting body decreased linearly with increasing distance from the wetting front to the moistube in the five set directions (vertical downward, 45° downward, horizontal, 45° upward and vertical upward). This trend is applicable to fine-textured and coarse-textured soil. An estimation model of soil moisture content including soil saturated hydraulic conductivity, initial soil moisture, the specific flow rate of the moistube and the maximum value of the wetting front distance in all directions is proposed. The model estimation is good (root mean square error = 0.008-0.018 cm3-cm-3, close to 0; Nash-Sutcliffe efficiency coefficient = 0.987, close to 1), and it can provide a practical tool for moistube irrigation design and agricultural water management.
Keywords: moistube irrigation, wetting body, soil moisture, Hydrus-2D, moisture content model
INTRODUCTION
Water loss in irrigated agriculture can be reduced by using high-efficiency irrigation systems. Moistube irrigation technology is a new form of subsurface irrigation using a moistube made from a semipermeable polymer membrane. The micro-irrigation system is composed of three parts - a water tower, a pressure-reducing valve, and a moistube - and the system structure is simple. It is a popular irrigation system because of its high water use efficiency. The membrane technology is installed in the irrigation field, and moistubes leak water to the soil in the root zone of crops for absorption and utilization (Namara et al., 2007; Niu et al., 2013; Li et al., 2016). With this technology, the moistube allows water to flow continuously over the entire lateral length. The water seepage rate is mainly adjusted using the applied water pressure (Zhang et al., 2017; Kanda et al., 2018; Fan et al., 2018a; Fan et al., 2018b). Compared with traditional surface irrigation methods, micro-irrigation systems are simple to operate, the working pressure head of micro-irrigation is generally in the range of 1-2 m (Niu et al., 2013; Yao et al., 2021; Qi et al., 2021), and micro-systems have a better water-saving and yield-increasing effect on field and greenhouse crops (Wood et al., 1987; Shirgure et al., 2012; Dirwai et al., 2021). Since moistube irrigation is relatively new, a better understanding of the soil moisture distribution around moistubes can help to improve the water utilization efficiency to fully leverage the potential of moistube irrigation technology and improve the success rate of moistube irrigation systems.
Research on the laws of soil water movement under different irrigation methods is performed using field experiments, laboratory experiments and numerical simulations. Field tests are able to assess the infiltration process of irrigation water entering the soil through the surface. However, spatial differences in the field soil characteristics (such as soil texture, porosity, moisture, soil temperature, pH, etc.) may result in such tests having poor repeatability. In addition, these tests are difficult to analyse quantitatively (Flury et al., 1994; Weiler et al., 2003). Therefore, the field test method is unsuitable for studying soil infiltration mechanisms (Flury et al., 1994; Weiler et al., 2003). Soil parameters (such as the soil texture, bulk density, initial water content, etc.) and irrigation parameters (such as the water pressure head, dropper flow, dropper burial depth, etc.) can be better controlled with laboratory experiments, and therefore this method is widely used in the study of irrigation mechanisms (Xue et al., 2013; Zhang et al., 2017; Zhong et al., 2020; Appels et al., 2021).
To analyse the characteristics of soil moisture under moistube irrigation, the dynamic changes in the advance of the wetting front can be directly observed in laboratory tests, and the moisture content of the soil can also be measured at the end of the test. However, it is not easy to obtain the dynamic distribution law of the soil moisture content from laboratory experiments (Vereecken et al., 2014; Xu et al., 2021). When using soil moisture sensors, such as time-domain reflectometers, frequency-domain reflectometry and other soil moisture sensors to observe the moisture content of the wetting body, because the wetting body of the moistube irrigation soil box test is not large, and the monitoring equipment will cause disturbance of the soil, it is difficult to accurately observe the change in moisture content in the wetting body. With the rapid development of computer technology, Hydrus and other software have been widely used to evaluate the water use efficiency of irrigation system designs (Saito et al., 2006; Kandelous et al., 2010; Bufon et al., 2012 Han et al., 2015; Simûnek et al., 2016). Compared with laboratory tests, Hydrus-simulated micro-irrigation can more intuitively reveal the infiltration process, such as the shape of the wetting front, especially the dynamic distribution law for the moisture content of the wetting body over time (Kanda et al., 2020b; Kanda et al., 2020c). The reliability of soil water movement estimation model based on numerical simulation needs to be verified by experimental results (Paterson et al., 2015). Therefore, combining the two methods of numerical simulation and laboratory testing to study the law of soil water movement can result in these methods complementing each other and improving the reliability of the research results.
Many scholars have carried out related research on moistube irrigation in recent years. Xie et al. (2014) found through indoor soil tank experiments that the correlation between wetting front migration distance, wetting front advance speed and infiltration time is significant, and conforms to the power-function relationship (R2 > 0.99). Based on indoor soil box experiments, Zhang et al. (2014) found that the moisture distribution in the wetting body is concentric circles with the moistube as the axis. The uniformity of the moistube irrigation increases with increasing initial water content, whereas the average water content of the wetting body is less affected by the initial water content. The soil moisture diffusivity index in different directions ranges from 0.5 to 0.6, and the evenness of moistube irrigation is as high as 95.62%. Fan et al. (2020) established a model for estimating the size of the wetting body of homogeneous soil with moistube irrigation through numerical simulation and experimental verification, in order to discover the influencing factors and changing relations for wetting body migration in the slightly moistened soil. Li et al. (2014) found that moistube irrigation realizes continuous and dynamic irrigation for crop water demand, with high irrigation uniformity, and when the soil evaporation intensity increases, the surface water gradually decreases, and the water content is gradually decreased. The coefficient of variation is low for the water content of the 0-30 cm soil layer. Fan et al. (2018a) performed numerical simulations and showed that the contours of the soil wetting body for moistube irrigation are all approximately 'concentric circles. For fine-textured soil, the migration rate of the wetting front is slower, and the moisture content near the moistube is higher. Xue et al. (2013) showed through laboratory experiments that the greater the water pressure head, the farther the soil moisture migration distance, with the soil water content around the moistube being closer to saturated water content.
Kanda et al. (2020c) studied the water distribution in soil (loam and sandy clay loam) under micro-irrigation conditions through numerical simulation and laboratory experiments. The simulated value of the wetting distance for the two soil textures was close to the measured value, and it was shown that soil texture has a significant effect on the movement of soil moisture. The soil moisture content above the moistube was significantly lower than that downward and laterally from the tube (p < 0.05). The abovementioned research mainly addressed the shape and size of the wetting body under moistube irrigation; research on the distribution characteristics of the moisture content of the wetting body has primarily been qualitative and empirical research, and there has been a lack of quantitative research (Zhang et al., 2012; Xie et al., 2014; Zhang et al., 2016; Kanda et al., 2020a; Kanda et al., 2020b; Kanda et al., 2020c; Fan et al., 2020). It is imperative to study soil moisture distribution characteristics in moistube irrigation in order to select optimal parameters in the design of moistube irrigation systems and thus achieve appropriate and accurate crop water management in the field.
This research simulated and studied the distribution law of the moisture content of the soil wetting body resulting from moistube irrigation using Hydrus-2D. Based on the previous qualitative research on the factors influencing the moisture distribution of the wetting body under moistube irrigation, this study increased the simulation volume and used the Hydrus-2D software to obtain moisture content data for the wetting body based on different factors: the mathematical relations for the simulation data were analysed and used to establish an estimation model for soil moisture content distribution under moistube irrigation. Finally, the model's validity was evaluated by laboratory experiments to provide a theoretical and technical reference for selecting the optimal parameters in the design of the micro-irrigation system and for appropriate and accurate field crop water management.
MATERIALS AND METHODS
Laboratory experiments
Experimental design
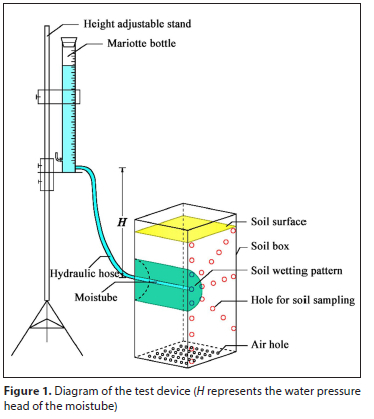
The experimental set-up consisted of a height-adjustable stand, a Mariotte bottle, a hydraulic hose, a moistube and a soil box (Fig. 1). The soil box was made of 10 mm thick plexiglass, and the dimensions were 60 cm (length) χ 60 cm (width) χ 100 cm (height). There were multiple ventilation holes (diameter 2 mm) at the bottom of the soil box to prevent air resistance in the soil. After the test, the soil was collected from the sampling soil hole (Fig. 1) to measure the soil moisture content. To facilitate the observation of the shape and size of the soil wetting body, the moistube was placed close to the inner wall of the soil box when the soil was loaded and placed horizontally at the set buried depth of 40 cm. In the experiment, a Mariotte bottle provided a constant head and the contour of the wetting body at different times was drawn with a marker.
Determination of test soil parameters
The silt loam from Qilihe District, Lanzhou City, Gansu Province, was used for the experiments, and the soil depth was 0-50 cm. The soil samples were air-dried, rolled, evenly mixed, and passed through a 2 mm sieve for later use. Before starting the experiments, water was added to the soil sample according to the desired initial moisture content, and then the sample was mixed evenly, sealed with plastic film and allowed to stand for 1 day.
To obtain as uniform a soil profile as possible, soil moisture was evenly distributed. The soil was loaded in layers according to the set bulk density (5 cm per layer). The experiment was stopped for 1 day after the soil was loaded. The relevant parameters of the test soil used in the evaluation are shown in Table 1, where the specific flow rate of the moistube is the actual measured value when the burial depth is 40 cm.
Numerical simulation
Basic equation
To simplify the numerical model, it is assumed that the soil is uniform and isotropic during the infiltration process of moistube irrigation. The water seepage rate of the moistube is evenly distributed along the direction of the moistube belt. Based on these assumptions, the soil water movement of moistube irrigation can be simplified as the two-dimensional motion of a point source on the vertical plane, and its flow governing equation is the two-dimensional Richards equation Richards (1931):
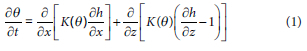
where z is the vertical coordinate and defined as positive downward (cm), x is the horizontal coordinate, h is the matrix potential (cm), θ is the soil moisture content (cm3-cm-3), t is the infiltration time (min), and K(θ) is the unsaturated soil hydraulic conductivity (cm-min-1).
The relationship between θ, h and K(θ) in Eq. 1 is fitted by the Van Genuchten-Mualem (VG-M) model (Van Genuchten, 1980):
where Se is the relative saturation of the soil, with Se = (θ - θ,)/ (θ5 - θ,); Ks is the saturated hydraulic conductivity of the soil (cm-min-1); θΓ and θ,, are the residual moisture content and saturated moisture content of the soil, respectively (cm3-cm-3); n and m are empirical constants, where n > 1, m = 1 - 1/n; and α is the empirical parameter (cm-1).
Condition of a definite solution
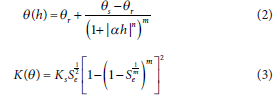
Figure 2 shows the initial and boundary conditions considered when simulating different modelling scenarios in this study. Considering the axial symmetry of the horizontal moistube in the field, the area shown in Fig. 2 is selected as the simulation calculation domain. The selection principle of the simulation calculation domain is that the vertical direction is from the moistube, as the starting point, to the soil surface and down to the depth not affected by irrigation, and the horizontal direction is half the distance between the two moistubes.
Before the simulation starts, the moisture content of the different soil types is the given initial moisture content. During the irrigation process, the soil surface is dry. Although the upper boundary is affected by the atmosphere, the evaporation is minimal and can be set as a nonflux boundary. The bottom was a free drainage boundary where water flow is driven by gravity (Fan et al., 2018b; Qi et al., 2021). The left boundary is the centreline passing downward through the moistube. The right boundary is the centreline of the adjacent moistube, which is all set according to the nonflux boundary (Fan et al., 2018b; Qi et al., 2021). The specific discharge of moisture for a unit length is constant (Zhang et al., 2012; Zhang et al., 2017), which is set according to the constant flow boundary. Equation 4 established by Fan et al. (2018b) is used for the calculation:

where Q is the specific flow rate of the moistube (mL-cm-2-min-1); K is the comprehensive permeability coefficient of the moistube (cm-min-1); H is the water pressure head in the moistube (cm); M is the calculation node and the distance between the water inlets (cm); B is the buried depth of the calculation node (cm), and a and b are the fitting parameters. It should be noted that Eq. 4 is obtained through experiments when the moistube is placed vertically in the soil. When the moistube is placed horizontally, the calculation node is the placement point of the moistube, that is, M = 0, B = D.
Simulation scheme
Eight typical soil textures in the field were selected to reflect the diversity of soil types and ensure the universal applicability of research results. The VG-M model parameters were taken from Carsel et al. (1988), and the soil bulk density (γ) was taken from Pachepsky et al. (2015), shown in Table 2.
After determining the soil texture, 3 moisture burial depths (D = 30, 40, 50 cm) and 3 water pressure heads (H = 100, 150, 200 cm) were selected based on the literature (Zhang et al., 2012; Liu et al., 2012; Zhang et al., 2017). For selecting the initial water content simulation value, each soil texture's field water-holding capacity is used as the benchmark, and different initial water content values can be obtained by multiplying different coefficients. The field capacity (FC) of 8 soil textures was obtained by Hydrus-2D/3D simulated saturated soil water redistribution. Due to the different water-holding capacities of different soil textures, the value of field water-holding capacity varies greatly. Therefore, the initial water content of soil textures is not the same. See Table 3 for details.
Model solution
Using Hydrus-2D to simulate the moisture content of the soil wetting body under different combinations of soil texture, water pressure head, moistube burial depth, and initial moisture content and considering the actual irrigation conditions and calculation accuracy requirements, simulations were performed of the area, which was set as a rectangular area (Dd = 100 cm and W/2 = 60 cm), with a space step of 1 cm, and a time step of 0.1 min. When solving, the Galerkin finite element method is used for the spatial discretization of the soil profile, and the implicit difference scheme is used for the discretization of time.
Statistical analysis
The root mean square error (RMSE) and Nash-Sutcliffe efficiency coefficient (NSE) are used to evaluate the model's performance. If the comparison results show that the RMSE is close to 0 and the NSE is close to 1, then the model has good predictive performance. The parameters are calculated using the following equation (Moriasi et al., 2007):
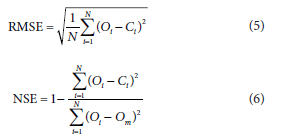
where Ot is the Ith measured value; Ci is the ith calculated value; Om is the average of the measured values, N is the total number of data points.
RESULTS AND DISCUSSION
Influencing factors and distribution law of moisture content of wetting body
To explore the distribution law and influencing factors of soil moisture content in moistube irrigation, the moistube was used as the endpoint and 5 directions (vertical downward, 45° downward, horizontal, 45° upward and vertical upward) were selected to characterize the values for soil moisture content distribution. Referring to Liu et al. (2012) and Fan et al. (2020), the initial soil moisture content, soil texture, irrigation time and specific discharge of the moistube were selected as the influencing factors. Origin 9.0 and Excel were used for the simulation data analysis.
Effects of soil texture and initial moisture content on moisture content distribution of soil wetting body
To analyse the influence of soil texture and initial moisture content on the moisture content distribution in the wetting body, two kinds of fine soil and two kinds of coarse soil were selected (D = 40 cm, H = 150 cm, T = 24 h). As an example, three initial moisture contents (0.143, 0.172 and 0.200 cm3-m-3) were selected, and the results are shown in Fig. 3.
Figure 3 shows that under silt conditions the distribution law of the moisture content of the wetting body in the vertical downward, horizontal, 45° downward, 45° upward and vertical upward directions is the same: when the initial moistube content was 0.143, 0.172 and 0.200 cm3-cm-3, the soil moisture content (θ) at any point inside the wetting body and the distance (S) from any point inside the wetting body to the center of the moistube are in line with a linear function relationship, and the coefficient of determination (R2) is greater than 0.93 for the fitted regression line. Under different initial soil moisture contents, the wetting front migration distance increases with increasing initial moisture content. In addition, due to the high initial soil moisture content, less water is required to fill the soil voids, thereby accelerating the migration of the wetting front.
To further determine the law obtained under the condition of fine soil, the silty loam (D = 40 cm, H = 150 cm) was selected, and the results plotted for 5 samples under 3 conditions of initial moisture content (0.196, 0.235 and 0.274 cm'-cm-3). The distribution law of soil moisture content along the five directions is shown in Fig. 4.
Figure 4 shows that under the conditions of silty loam, the distribution law of the moisture content of the wetting body in the vertical downward, horizontal, 45° downward, 45° upward and vertical upward directions is the same, that is, when the initial water content is 0.162, 0.194 and 0.226 cm3-cm-3, the soil moisture content (θ) at any point inside the wetting body and the distance (S) from any point inside the wetting body to the centre of the moistube are in line with the linear function relationship, and the coefficient of determination (R2) greater than 0.93 for the fitted regression line.
To compare and analyse soil texture's influence on the moisture content distribution in the wetting body of the slightly moistened soil, we selected coarse sandy loam, (D = 40 cm, H = 150 cm). We plotted the results for three initial moisture contents (0.1, 0.12 and 0.14 cm'-cm-3). The distribution law of soil moisture content in five directions under these conditions is shown in Fig. 5.
A further analysis of Fig. 5 finds that under the condition of sandy loam, the distribution law of the moisture content of the wetting body in the vertical downward, horizontal, 45° downward, 45° upward and vertical upward directions is the same, that is, when the initial water content is 0.1, 0.12 and 0.14 cm3-cm-3, the soil moisture content (θ) at any point inside the wetting body and the distance (S) from any point inside the wetting body to the centre of the moistube are in line with the linear function relationship, and the coefficient of determination (R2) is greater than 0.90 for the fitted regression.
To further determine the law obtained under the condition of coarse soil, the coarse sandy soil (D = 40 cm, H = 150 cm) was selected, and 5 samples were drawn under the conditions of 3 initial moisture contents (0.046, 0.052 and 0.060 cm3-cm-3). The distribution law of soil moisture content along the directions is shown in Fig. 6.
A further analysis of Fig. 6 finds that under the sandy soil conditions, the distribution law of the moisture content of the wetting body in the five directions is the same, that is, when the initial water content is 0.046, 0.052 and 0.060 cm3-cm-3, the soil moisture content (θ) at any point inside the wetting body and the distance (S) from any point inside the wetting body to the centre of the moistube are in line with a linear function relationship, and the coefficient of determination (R2) is greater than 0.893 for the fitted regression line.
According to the above analysis, under different soil textures and different initial moisture contents, the soil moisture content (θ) at any point inside the wetting body and the distance (S) from any point inside the wetting body to the centre of the moistube conform to a linear function relationship. Whether this functional relationship is affected by irrigation time was the next aspect investigated.
Effects of irrigation time on moisture content distribution of soil wetting body
The silt loam soil was selected. The variation curve of θ with S in five directions of the silty loam soil at different irrigation times was drawn under the condition of initial moisture content of 0.196 cm3-cm-3. The specific situation is shown in Fig. 7.
A further analysis of Fig. 7 finds that the initial moisture content of silt loam is 0.196 cm3-cm-3; different irrigation time has no significant effect on the law of variation of θ with S in five directions for silt loam. However, the slopes of the different straight lines decrease with the increase in irrigation time. The coefficient of determination (R2) is greater than 0.990 for the fitted regression line.
The sandy loam soil was selected. Under the initial moisture content of 0.14 cm3-cm-3, the variation curves of θ with S in five directions of the sandy loam soil at different irrigation times were drawn. The specific situation is shown in Fig. 8.
A further analysis of Fig. 8 finds that for the initial soil moisture content of 0.14 cm3-cm-3, the irrigation time has no significant effect on the variation of θ with S in five directions of the sandy loam soil. Comprehensive analysis of Figs 7 and 8 shows that: for fine soil, with the extension of irrigation time, the linear function relationship between water content and wetting front migration distance is highly consistent; for coarse soil, with the prolongation of irrigation time, the conformity of the linear function relationship between θ and S decreases slightly. The reason for this may be that when the soil texture is coarse, the saturated hydraulic conductivity of the soil is higher. At the same time, the moistube irrigation is continuous, the outflow is slow, the specific discharge of the moistube is minor relative to the soil saturated hydraulic conductivity, and the irrigation mode is that of inadequate water supply - the soil around the moistube is not fully saturated. At the same time, the water-holding capacity of coarse soil is relatively low. During actual irrigation, the initial water content of coarse soil is low, and the soil water content will drop sharply at the wetting front. The relationship between θ and S in five directions under silty loam and sandy loam is consistent with the law obtained above. Therefore, considering the influence of soil texture, the obtained laws are applicable to both fine and coarse soils.
Effects of specific discharge of moistube on moisture content distribution of soil wetting body
To analyse the effect of the specific discharge of the moistube on the moisture content of the soil wetting body, a fine-textured silty loam was selected and studied under three different specific flow conditions. The results are shown in Fig. 9.
The variation of silty loam water content with the migration distance of the wetting front under the three Q conditions was compared and analysed. As shown in Fig. 9, when the initial soil water content was 0.235 cm3-cm-3, the larger the Q value, the greater the migration distance of the soil wetting front. For example, if the irrigation was continued for 24 h, the migration distances of the wetting body in five directions under 3 values for Q (0.0158, 0.0207, 0.0256 mL-cm-1-min-1 increased with increasing specific flow rate. However, the variation of θ with S in five directions of the silty loam soil has no significant effect under different specific discharges of the moistube.
To further analyse the effect of the specific discharge of the moistube on the moisture content of the wetting body of the coarse-textured soil, sandy loam was selected and studied under 3 specific flow conditions. The results are shown in Fig. 10.
The variation of sandy loam water content with the migration distance of the wetting front under 3 values for Q was compared and analysed. Figure 10 shows that when the initial soil water content is 0.12 cm3-cm 3, the larger the Q value, the greater the migration distance of the wetting front. If the irrigation was continued for 24 h, the migration distances of the wetting front in five directions under three values for Q (0.0143, 0.0187, 0.0230 mL-cm-1-min-1 increased. However, the variation of θ with S in five directions of the silty loam has no significant effect under the conditions of different specific discharges of the moistube.
Model building
Based on the above analysis, the relation between θ and S can be summarized as follows: The relationship between soil moisture content and S in the selected five directions is a linear function, and is not affected by irrigation time. As the soil particles change from fine to coarse, there is a linear functional relationship between θ and S in all directions. Based on this, an estimation model for the moisture content distribution of the wetting body of fine soil and coarse soil is established as follows:
By analysing the obtained law, it is found that the relationship between water content and wetting distance has common characteristics for both fine and coarse soils: that is, the value of the vertical coordinate of the starting point of the curve is the maximum water content that the soil can actually achieve; the value of the vertical coordinate of the end point is the initial water content of the soil, and the horizontal coordinate value is the maximum distance of the wetting front migration.
If maximum water content, initial water content and the maximum value of the wetting front migration distance of different soils are expressed by symbols θs', θi and L, respectively, then the primary form of the linear function relationship can be expressed as θ = λS + δ. A schematic diagram of the model relating θ and S can be drawn according to the assumed conditions, as shown in Fig. 11.
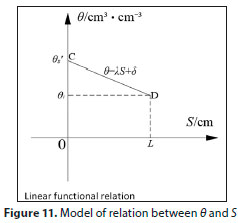
Figure 11 shows that the coordinates of point C are (0, θ5), the coordinates of point D are (L, θ,), and L is the maximum distance of the wetting front migration in each direction. Based on the conditions given above, substituting the coordinates of points C into θ = λS + δ, the following formula can be obtained:
Further substituting the coordinates of point D into the formula θ = λS + δ gives:
With further processing of Eqs 7 and 8, the following can be obtained:
After arranging Eqs 7, 8 and 9, the model for estimating the distribution of moisture content in the wetting body of a slightly moistened soil is as follows:
where θs' is the highest actual soil moisture content, that is, the actual saturated moisture content (cm3-cm-3).
To further improve the estimation model for the distribution of the moisture content of the wetting body, the saturated moisture content of 8 typical soils under simulated conditions was selected, and the burial depth D and the water pressure head H were converted into the specific flow Q of the moistube by Eq. 4. The fitting parameters and Q by Origin 9.0 conform to a power function relationship, that is, θ' = AQβ and the coefficient of determination (R2) was not less than 0.97. The fitting results are shown in Table 4.
A further analysis of Table 4 finds that coefficient A changes irregularly with the increase of the soil saturated hydraulic conductivity, Ks. However its value fluctuates little, and its average value is 0.553. Further analysis found that the exponent β increased logarithmically with the increase in soil saturated hydraulic conductivity, Ks, as shown in Fig. 12.
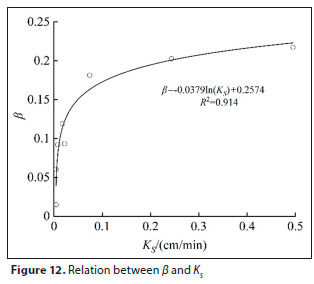
Based on the above analysis, the actual saturated moisture content of the soil (θs') can be expressed by the specific flow rate (Q) of moisture irrigation and the saturated conductivity (Ks) of the soil:
Equation 11 was substituted into Equation 10. Finally, the soil wetting body's moisture content distribution estimation model under moistube irrigation is obtained:
Model evaluation
Verification with simulated values
During the establishment of the model, the simulated data were used to explore the distribution law of the moisture content of the wetting body. However, after simplification to a mathematical model, the simulated value of the moisture content of the wetting body was not used in the formula derivation. Therefore, the simulation data can be used to verify that the mathematical model is an appropriate simplification of the distribution law. The model's ability to estimate the moisture content distribution in the wetting body of the slightly moistened soil can then be evaluated. Four kinds of soil, including fine soil (silt and silt loam) and coarse soil (sand loam and sandy soil) were selected to explore the distribution law of moisture content in the wetting body. The fine soil was selected as a loam in the model evaluation. The coarse soil is loamy sand soil and two simulation schemes were selected for each soil (as shown in Table 5). Figure 13 show the comparison between the simulated value and the calculated value for moisture content of the wetting body under the two soil textures.
Figure 13a and Figure 13b show the simulated and model-determined water contents in the vertical downward, 45° downward, horizontal, 45° upward and vertical upward directions of the loam wetting body for the two initial water contents. The points with coordinates are all distributed near the 1:1 line, and the simulated and calculated values are in good agreement, demonstrating that simplifying the model to the given mathematical problem was appropriate. A further analysis of Fig. 13c and Fig. 13d shows that when the initial moisture content is 0.062 cm3-cm-3, the simulated value of the moisture content of the soil wetting body of loam sand in the vertical downward, 45° downward, horizontal, 45° upward and vertical upward directions agrees with the model-calculated value. When the initial moisture content is 0.086 cm3-cm-3, the simulated value of the soil moisture content in the five directions is in good agreement with the model-calculated value. This shows that the model can estimate the moisture content distribution of the wetting body of coarse- and fine-textured soil under the condition of slightly moist soil from moistube irrigation.
Verification with measured values
To further evaluate the model's accuracy, the indoor soil box test was used to verify the model. The calculated value from the model was compared with the measured data, and the calculated and measured values were statistically analysed by Eqs 5 and 6 (Table 6).
Figure 14 shows that when the initial water content is 0.196 cm3-cm-3, the measured values and model calculations of the water content of the soil wetting body in the five directions are in good agreement. When the initial water content is 0.274 cm3-cm3-, the measured values of the soil moisture content in the vertical downward, 45° downward, horizontal, 45° upward and vertical upward directions are in good agreement with the model-calculated values, indicating that the model can estimate the water content distribution of the soil wetting body with finer soil texture under the condition of slightly moist soil.
Figure 15 shows that when the initial water content is 0.10 cm3-cm-3 and 0.14 cm3-cm-3, the measured values of soil moisture content in five directions are in good agreement with the model calculated values, indicating that the model can also estimate the distribution of water content in the soil wetting body with coarser soil texture under the condition of slightly moist soil.
Table 6 shows that when the initial water content is 0.015 cm3-cm-3, the model can estimate the water content distribution in the soil wetting body with a finer soil texture under the condition of slightly moist soil. It can be further seen from Table 6 that the RMSE is between 0.009 and 0.012 cm3-cm-3 for the sandy loam with an initial moisture content of 0.1 cm3-cm-3 in five directions, and the NSE is between 0.978 and 0.987. For the silt with an initial moisture content of 0.196 cm3-cm-3, the RMSE between the measured moisture content and the calculated value of the model in five directions is between 0.008 and 0.018 cm3-cm-3, and the NSE is between 0.911 and 0.983, indicating that the model's predictive ability is good.
Although the results from the evaluation of the model are good, three additional points need to be noted. Firstly, the accuracy of the specific discharge of the moistube, the soil saturated hydraulic conductivity and the initial soil moisture content must be guaranteed. The saturated hydraulic conductivity ensures that the highest water content (i.e, the actual saturated water content) that the soil near the moistube can reach during actual irrigation is accurate. Secondly, the model is suitable for fine and coarse soil under irrigation conditions that result in the soil being 'slightly moist'. Finally, Eq. 12, for calculating soil saturated water content, shows that the larger the specific discharge of the moistube, the higher the soil saturated water content. This ignores the fact that when the soil is fully supplied with water, the voids in the soil will be filled with water after a certain period. However, considering that the moistube irrigation is continuous, the outflow is slow, the specific discharge of the moistube will not be too large, and that the calculated value of Eq. 12 does not exceed the soil water content, when the peak value is reached, the calculated result is relatively accurate. Therefore, for the particular case where the specific flow rate of the moistube is significant, the measured value of the saturated water content of the soil can be used directly. However, the spatial distribution of soil characteristics is uneven, and the moisture content of the same soil is different in different regions. Therefore, to improve the model's practicability in the later stage, it is necessary to study the soil's saturated water content further.
CONCLUSIONS
This article presents the distribution law for the moisture content of the soil wetting body of moistube irrigation, based on simulation data from Hydrus-2D. The model for calculating the distribution of moisture content of the soil wetting body of moistube irrigation is established using Origin 2018 and Excel analysis. Finally, laboratory studies were used to confirm the model's validity, and the following conclusions were drawn:
Selecting the initial water content (50%-70% FC), the soil water content in five directions conforms to a linear functional relationship with wetting front migration distance; this law is not affected by the irrigation time. As the soil texture changes from fine to coarse, the relationship between the soil water content and the migration distance of the wetting front still conforms to a linear function in all directions.
The saturated hydraulic conductivity of the soil, the starting moisture content, the specific discharge of the moistube, and the maximum value of the migration distance of the wetting front in all directions are all included in the constructed model. The evaluation results show that for fine-textured soil, the RMSE between the measured water content and the model-calculated in five directions, with an initial water content of 0.196 cm3 cm-3, is between 0.009 and 0.012 cm3-cm-3, and the NSE is between 0.978 and 0.987. For the silty loam with an initial moisture content of 0.274 cm3 cm-3, the RMSE between the measured moisture content and the model-calculated value in five directions is between 0.008 and 0.015 cm3-cm-3, and the NSE is 0.896 and 0.965.
For coarse soil, the RMSE for the sandy loam with an initial moisture content of 0.100 cm3-cm-3 in five directions is between 0.008 and 0.018 cm3-cm-3 and NSE is between 0.910 and 0.983. For sandy loam soil with an initial moisture content of 0.140 cm3-cm-3, the RMSE of the measured moisture content and model-calculated values in five directions is between 0.008 and 0.017 cm3-cm-3, and the NSE is between 0.867 and 0.962. The predictive ability of the model is good. This study can provide a theoretical and technical reference for selecting optimal parameters in the design of moistube irrigation systems to achieve appropriate and accurate field crop water management.
ACKNOWLEDGEMENTS
This research was supported by the National Natural Science Foundation of China (No. 51969013) and the National Natural Science Foundation of Gansu Province (No. 21JR7RA225 and No.51409137).
DATA AVAILABILITY
All data are available from the corresponding author upon request.
CONFLICT OF INTEREST
The authors declare that they have no conflict of interest.
REFERENCES
APPELS WM and KARIMI R (2021) Analysis of soil wetting patterns in subsurface drip irrigation systems Indoor alfalfa experiments. Agric. Water Manage. 250 106832. https://doi.org/10.1016/j.agwat.2021.106832 [ Links ]
BUFON VB, LASCANO RJ, BEDNARZ C, BOOKER JD and GITZ DC (2012) Soil water content on drip irrigated cotton: comparison of measured and simulated values obtained with the HYDRUS 2D model. Irrig. Sci. 30 (4) 259-273. https://doi.org/10.1007/s00271-011-0279-z [ Links ]
CARSEL RF and PARRISH RS (1988) Developing joint probability distributions of soil water retention characteristics. Water Resour. Res. 24 (5) 755-769. https://doi.org/10.1029/WR024i005p00755 [ Links ]
DIIRWAI TL, MABHAUDHI T and KANDA EK (2021) Moistube irrigation technology development, adoption and future prospects: A systematic scoping review. Heliyon 7 (2) e06213. https://doi.org/10.1016/j.heliyon.2021.e06213 [ Links ]
FAN YW, YANG ZW and HU WL (2020) Establishment and validation of wetting pattern model of moistube irrigation in homogeneous soil. Trans. Chin. Soc. Agric. Eng. 36 (13) 83-91. https://doi.org/10.11975/j.issn.1002-6819.2020.13.010 [ Links ]
FAN YW, HUANG N, ZHANG J and ZHAO T (2018a) Simulation of soil wetting pattern of vertical moistube-irrigation. Water 10 (5) 601. https://doi.org/10.3390/w10050601 [ Links ]
FAN YW, ZHAO T, BAI GL and LIU WG (2018b) HYDRUS-2D simulation of soil wetting pattern with horizontal moistube-irrigation and analysis of its influencing factors. Trans. Chin. Soc. Agric. Eng. 34 (4) 115-124. https://doi.org/10.11975/j.issn.1002-6819.2018.04.014 [ Links ]
FLURY M, FLUHLER H and JURY WA (1994) Susceptibility of soils to preferential flow of water: A field study. Water Resour. Res. 30 (7) 1945-1954. https://doi.org/10.1029/94WR00871 [ Links ]
HAN M, ZHAO CY, FENG GR, YAN YY and YU S (2015) Evaluating the effects of mulch and irrigation amount on soil water distribution and root zone water balance using HYDRUS-2D. Water 7 (6) 2622-2640. https://doi.org/10.3390/w7062622 [ Links ]
KANDA EK, MABHAUDHI T and SENZNJE A (2018) Hydraulic and clogging characteristics of moistube irrigation as influenced by water quality. J. Water Suppl. Res. Technol. Aqua 67 (5) 438-446. https://doi.org/10.2166/aqua.2018.166 [ Links ]
KANDA EK, NIU WQ, MABHAUDHI T and SENZANJE A (2020a) Moistube irrigation technology: a review. Agric. Res. 9 (2) 139-147. https://doi.org/10.1007/s40003-019-00448-0 [ Links ]
KANDA EK, SENZANJE A and MABHAUDHI T (2020b) Modelling soil water distribution under Moistube irrigation for cowpea crop. Irrig. Drain. 69 (5) 1116-1132. https://doi.org/10.1002/ird.2505 [ Links ]
KANDA EK, SENZANJE A and MABHAUDHI T (2020c) Soil water dynamics under moistube irrigation. Phys. Chem. Earth 115 1-10. https://doi.org/10.1016/j.pce.2020.102836 [ Links ]
KANDELOUS MM and SIMUNEK J (2010) Numerical simulations of water movement in a subsurface drip irrigation system under field and laboratory conditions using HYDRUS-2D. Agric. Water Manage. 97 (7) 1070-1076. https://doi.org/10.1016/j.agwat.2010.02.012 [ Links ]
LI CY, XIA JH and WANG XP (2014) Soil water distribution characteristic and irrigation uniformity of low-pressure moisture irrigation. Water Saving Irrig. 9 15-18. [ Links ]
LI JS, LI YF, WANG J, WANG Z and ZHAO WX (2016) Micro irrigation in China: history, current situation and prospects. J. Hydraul. Eng. 47 (3) 372-381. https://doi.org/10.13243/j.cnki.slxb.20151141 [ Links ]
LIU HJ, YANG HY, ZHENG JH, JIA DD, WANG J, LI Y and HUANG GH (2012) Irrigation scheduling strategies based on soil matric potential on yield and fruit quality of mulched-drip irrigated chili pepper in northwest China. Agric. Water Manage. 115 232-241. https://doi.org/10.1016/j.agwat.2012.09.009 [ Links ]
MORIASI DN, ARNOLD JG, VAN LIEW MW, BINGNER RL, HARMEL RD and VEITH TL (2007) Model evaluation guidelines for systematic quantification of accuracy in watershed simulations. Trans. ASABE 50 (3) 885-900. https://doi.org/10.13031/2013.23153 [ Links ]
NAMARA RE, NAGAR RK and UPADHYAY B (2007) Economics adoption determinants, and impacts of micro-irrigation technologies: Empirical results from India. Irrig. Sci. 25 (3) 283-297. https://doi.org/10.1007/s00271-007-0065-0 [ Links ]
NIU WQ, ZHANG J, ZHANG LL, XUE WL and ZHANG LT (2013) Effects of buried depth and pressure head on water movement of wetted soil during moistube-irrigation. Trans. Chin. Soc. Agric. Machin. 44 (12) 128-134. https://doi.org/10.6041/j.issn.1000-1298.2013.12.021 [ Links ]
PACHEPSKY Y and PARK Y (2015) Saturated hydraulic conductivity of US soils grouped according to textural class and bulk density. Soil Sci. Soc. Am. J. 79 (4) 1094-1100. https://doi.org/10.2136/sssaj2015.02.0067 [ Links ]
PATERSON G, TURNER D and WIESE L (2015) Spatial soil information in South Africa: Situational analysis, limitations and challenges. S. Afr. J. Sci. 111 (5-6) 1-7. https://doi.org/10.17159/sajs.2015/20140178 [ Links ]
QI W, ZHANG ZY, WANG C, HUANG MY, LIU C and CHEN Y (2021) Model construction and simulation of soil water movement under Moistube irrigation based on water potential difference-driven outflow mechanism. J. Hydraul. Eng. 52 (9) 1091-1102. https://doi.org/10.13243/j.cnki.slxb.20210072 [ Links ]
RICHARDS LA (1931) Capillary conduction of liquids through porous mediums. J. Appl. Phys. 1 (5) 318-333. https://doi.org/10.1063/1.1745010 [ Links ]
SAITO H, SIMUNEK J and MOHANTY BP (2006) Numerical analysis of coupled water, vapor, and heat transport in the vadose zone. Vadose Zone J. 5 (2) 784-800. https://doi.org/10.2136/vzj2006.0007 [ Links ]
SHIRGURE PS (2012) Micro-irrigation systems, automation and fertigation in citrus. Sci. J. Rev. 1 (5) 156-169. https://doi.org/10.1016/S1049-2585(03)09002-1 [ Links ]
SIMUNEK J, VAN GENUCHTEN MT and SEJNA M (2016) Recent developments and applications of the HYDRUS computer software packages. Vadose Zone J. 15 (7) 1-25. https://doi.org/10.2136/vzj2016.04.0033 [ Links ]
VAN GENUCHTEN MT (1980) A closed-form equation for predicting the hydraulic conductivity of unsaturated soils. Soil Sci. Soc. Am. J. 44 (5) 892-898. https://doi.org/10.2136/sssaj1980.03615995004400050002x [ Links ]
VEREECKEN H, HUISMAN JA and PACHEPSKY Y (2014) On the spatio-temporal dynamics of soil moisture at the field scale. J. Hydrol. 516 76-96. https://doi.org/10.1016/j.jhydrol.2013.11.061 [ Links ]
WEILER M and NAEF F (2003) An experimental tracer study of the role of macropores in infiltration in grassland soils. Hydrol. Process. 17 (2) 477-493. https://doi.org/10.1002/hyp.1136 [ Links ]
WOOD JC, WOOD MK and TROMBLE JM (1987) Important factors influencing water infiltration and sediment production on arid lands in New Mexico. J. Arid Environ. 12 (2) 111-118. https://doi.org/10.1016/s0140-1963(18)31181-9 [ Links ]
XIE XW, QI SL, LIU GH, WANG ZY and MA XP (2014) Buried moistube infiltration testing under sandy loam. Xinjiang Agric. Sci. 51 (12) 2201-2205. [ Links ]
XU L, WANG ZC, MAINA JN and LIU G (2015) Determining soil water content of salt-affected soil using far-infrared spectra: laboratory experiment. J. Appl. Remote Sens. 9 (1) 095983-1. https://doi.org/10.1117/1.JRS.9.095983 [ Links ]
XUE WL, NIU WQ and ZHANG J (2013) Effects of hydraulic head on soil water movement under moistube-irrigation. J. Irrig. Drain. 32 (6) 7-11. [ Links ]
YAO JW, QI YQ, LI HH and SHEN YJ (2021) Water saving potential and mechanisms of subsurface drip irrigation: A review. Chin. J. Eco-Agric. 29 (6) 1076-1084. https://doi.org/10.13930/jxnki.cjea.200980 [ Links ]
ZHANG GX, SHEN LX and GUO YM (2016) Effect of soil structure on water infiltration under moistube irrigation. J. Irrig. Drain. 35 (7) 35-39. https://doi.org/10.13522/jxnki.ggps.2016.07.006 [ Links ]
ZHANG GX, SHEN LX and GUO YM (2017) Effect of pressure heads and soil bulk density on water infiltration under moistube irrigation. Agric. Res. Arid Areas 35 (4) 67-73. https://doi.org/10.7606/j.issn.1000-7601.2017.04.11 [ Links ]
ZHANG J, NIU WQ, ZHANG LL and SHI LY (2012) Experimental study on characters of wetted soil in moistube irrigation. Sci. Soil Water Conserv. 10 (6) 32-38. https://doi.org/10.16843/j.sswc.2012.06.007 [ Links ]
ZHANG J, NIU WQ, ZHANG LL and WU ZG (2014) Effects of soil initial water content on line-source infiltration characteristic in moistube irrigation. J. Drain. Irrig. Machin. Eng. 32 (1) 72-79. https://doi.org/10.3969/j.issn.1674-8530.12.0153 [ Links ]
ZHANG MZ, NIU WQ, LU ZG, LI Y, WANG JW and QIU XQ (2017) Effect of moistube-irrigation on crop yield and water use efficiency. Chin. J. Eco-Agric. 25 (11) 1671-1683. https://doi.org/10.13930/jxnki.cjea.170243 [ Links ]
ZHONG Y, FEI LJ and LI YB (2020) Infiltration characteristics of film hole irrigation under the influence of multiple factors. Irrig. Drain. 69 (3) 417-426. https://doi.org/10.1002/ird.2417 [ Links ]
 Correspondence:
Yanwei Fan
Email: fanyanwei24@163.com
Received: 23 January 2022
Accepted: 8 December 2022

