


Services on Demand
Article
 English (pdf)
 Article in xml format
 Article references
Indicators

Related links
-
 Cited by Google
 -
 Similars in Google
Share

 Permalink
Water SA
On-line version ISSN 1816-7950
Print version ISSN 0378-4738
Water SA vol.49 n.1 Pretoria Jan. 2023
http://dx.doi.org/10.17159/wsa/2023.v49.i1.3943
RESEARCH PAPER
Use of remote sensing to determine rainwater harvesting sites for piped micro-irrigation schemes in Chimanimani District, Zimbabwe
Mike M Mushayi; Samuel Kusangaya; Never Mujere
Department of Geography, Geospatial Sciences and Earth Observation, University of Zimbabwe, Harare, Zimbabwe
ABSTRACT
The eastern highlands of Zimbabwe, particularly Chimanimani District, are endowed with natural wate bodies such as springs, pools, wetlands, puddles and river systems, which are potential sources of water for irrigated farming. Despite this, water challenges continue to exist due to rainfall seasonality and lack of suitable water harvesting sites. This calls for solutions to harness water in long-lasting sources to support the piped micro-irrigation schemes. These schemes are pillars in agricultural interventions such as horticulture, livestock farming, fish farming and beekeeping. This study therefore, determined potential rainwater larvesting (RWH) sites in Chimanimani District using geospatial techniques. Water pixels from fandsat 8 images were extracted using the normalised difference moisture index (NDMI) and normalized difference vegetation index (NDVI). Potential RWH sites were classified into land-based zones, wetlands and natural water bodies. Findings show that land-based zones cover 27.53%, wetlands cover 24.65% and water bodies cover 6.11% of the district. The study also indicates that integrating geographic information systems with remote-sensing tools is a useful approach in identifying RWH sites. Thus, this study provided a spatially explicit approach and presents a suitability map for RWH in Chimanimani District.
Keywords: rainwater harvesting, spectral indices, GIS, remote sensing, Chimanimani District, Zimbabwe
INTRODUCTION
In arid and semi-arid regions, availability of water is one of the main limiting factor towards achieving food security and socio-economic development and thus meeting the Sustainable Development Goals (SDGs). These water-stressed regions cover 35% of the Earth and contain more than 40% of the world's population who are predominantly practising rainfed agriculture (Kahinda et al., 2008; Adham et al., 2016). Rainfed agriculture is increasingly vulnerable to frequent water scarcities due to errratic rainfall, aridity, droughts, seasonality of rainfall, climate change and variability. Thus, rainwater harvesting (RWH) is largely employed to mitigate the spatial and temporal variability of rainfall by providing alternative sources of water for domestic needs, crop and livestock production (Adham et al., 2016). RWH captures, conserves and stores rainfall and surface runoff in repositories such as reservoirs, bunds, pans, terraces and ponds. Harvested rainwater extends the duration of the growing season by supplementing water during times of dry spells and supplying water for irrigation (Berhanu and Bisat. 2018). Nevertheless, the success of RWH systems depends heavily on identifying suitable sites for their location (Adham et al., 2016).
Methods and tools that have been used for identifying suitable sites for RWH include field surveys, and GIS-based multi-criteria evaluations (Nyirenda et al., 2021). Field surveys are appropriate for selecting suitable RWH sites for small and accessible areas. However, field surveys are less effective for selection of appropriate RWH sites for larger areas. In addition, fieldwork is costly in terms of time and financial resources (Bisrat and Berhanu, 2018). Field surveys require experienced personnel to locate reliable sites for RWH, which are not always available in low-income countries. Thus, given the challenges and difficulties of conducting field surveys, novel methods which integrate GIS and remote sensing offer relatively cheap, simple and quick ways to identify suitable sites for RWH even in inaccessible areas. For example, the use of remote-sensing based spectral indices such as the topographic wetness index (TWI), normalized difference vegetation index (NDVI) and the normalised difference moisture index (NDMI) aid in understanding the soil moisture regimes in an area (Kahinda et al., 2008; Nyirenda et al., 2021). TWI requires very high-resolution input data which, however, are not readily available in arid and semi-arid regions such as Zimbabwe. This challenge inherent in using the TWI can be addressed by using NDMI and NDVI. The two indices complement each other to characterise water and moisture stress by extracting surface water from other ground surface features (Grabs et al., 2009; Sahu, 2014). However, little attention has been paid to the performance of these indices in selecting suitable RWH sites especially in dryland regions. Against this backdrop, the purpose of this study was to identify RWH sites using NDMI and NDVI in Chimanimani, Zimbabwe.
MATERIALS AND METHODS
Study area
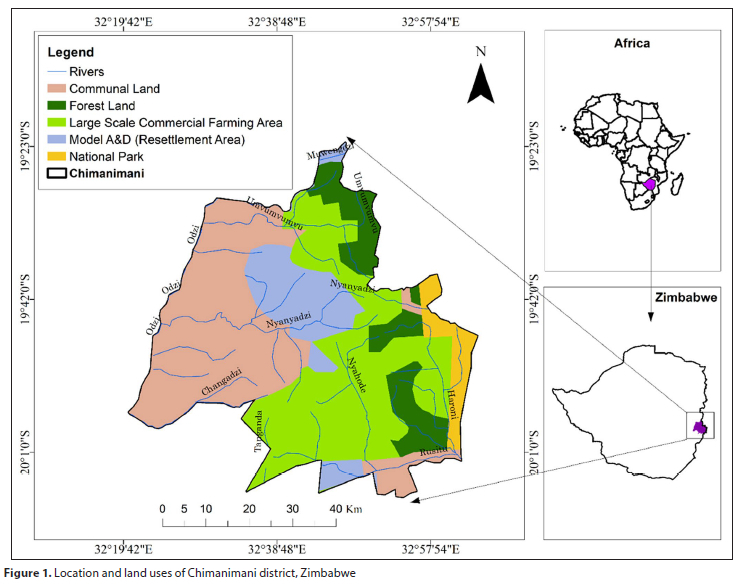
Chimanimani District lies on the eastern boundary of Zimbabwe with Mozambique (Fig. 1). It covers an area of 30 283.36 km2. The district has a population of 153 620 (Chimanimani Rural District Council, 2017; ZimStat, 2022). The geology of Chimanimani is dominated by limestone, shale, quartzite, dolerite and metasediments. Soils are primarily determined by the underlying geology.
Four main soil types are: red soils or ferralsols derived from schist, white sandy soils or leptosols derived from quartzite, alluvial soils or luvisols fringing larger streams and small rivers, and forest soils or lixisols which are humus-rich (Ghiurghi et al., 2010). The relief varies from 2 436 m amsl on the east to 600 m amsl in the west. It comprises a mountain plateau of folded quartzite and metamorphosed sandstones to the east and a low-lying valley in the west. Of significance is the Chimanimani mountain range that stretches from west to east with altitudes ranging between 1 000 m amsl and 2 436 m amsl. The mountain range intercepts moisture air from the Indian Ocean resulting in relief rainfall on windward slopes to the east (Timberlake et al., 2016).
The climate of Chimanimani varies from humid tropical in the eastern highlands to semi-arid in the north and west lowlands The mean annual temperature varies from 22°C in the lowlands to 18°C in the mountains. The rainy season extends from November to April. On average, about 1 074 mm of rainfall is received annually with significant variation from the highland to the lowland. Low-lying semi-arid areas receive on average 484 mm/yr of rainfall while the neighbouring highlands receive 1 300 mm/yr. The average pan evaporation rate is 2 000 mm/yr (Timberlake et al., 2016). Chimanimani District experiences an average annual temperature of 16°C. Rainfall in the district varies from the eastern highlands to the low-lying western regions. The eastern highlands receive 1 400 mm of rainfall per year whilst the western areas receive between 300 mm and 800 mm annually (Chimanimani Rural District Council, 2017). The eastern plateau of Chimanimani is a watershed of transboundary rivers flowing from Zimbabwe to Mozambique.
Subsistence farming is the major source of food and family incomes in the district (Chimanimani Rural District Council, 2017). Farmers grow cereals, small grains, vegetables, fruits, tea, coffee and macadamia nuts. Due to insufficient rains, most people rely on springs, rivers, wetlands and pools for watering animals, domestic water needs and supplementary irrigation. Low-cost piped micro-irrigation schemes along reliable natural repositories have been adopted to extend the farming season and improve productivity after the main rain season which spans from November to March (Chimanimani Rural District Council, 2017).
Data collection
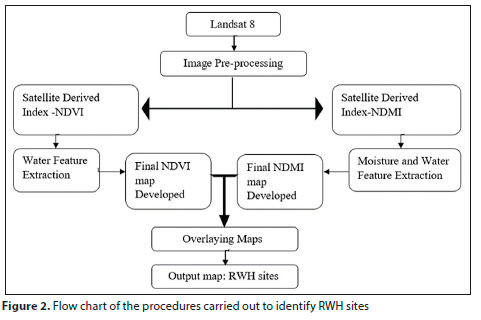
Cloud-free Landsat 8 Operational Land Imager (OLI) and Thermal Infrared Sensor (TIRS) images for the years 2013 to 2019 were acquired from the Remote Pixel website (https://remotepixel.ca). The images were used in calculating the normalised difference vegetation index (NDV1) and the normalised difference moisture index (NDMI) and the resultant RWH site map of Chimanimani district. Figure 2 shows the method used used in determing suitable RWH sites.
Two cloud-free images were retrieved in each year, one for the rainy season and the other for the dry season, to capture seasonal variations in identifying RWH sites. For the rainy season, images were retrieved for the months of March and April whilst images for August and September represented the dry season. The images were downloaded and pre-processed in ArcMap CIS to remove noise and enhance precision and interpretability of an image (Beebe et al., 1998). Changes in land cover and land surface conditions were monitored by mapping NDVI and NDMI for the same dates in the rainy season and in the dry season from the year 2013 up to 2019. This approach increased the accuracy in determining dependable RWH sites. Effects of cloud cover on NDMI and NDVI calculations were eliminated through collection of cloud-free imagery from the month of March and April in the rainy season with August and September for the dry season.
After pre-processing the images, NDVI and NDMI were then computed to extract for water and moisture stress features, respectively. NDVI is estimated as the difference between reflectance in near-infrared (NIR) and red (R) wavelengths using the formula (Haboudane et al., 2004):
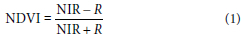
The raster calculator in ArcGIS was used to compute NDVI from Landsat 8 images, with Band 5 and Band 4 representing reflectance in the NIR and red regions, respectively. According to Haboudane et al. (2004), NDVI values range from +1.0 to -1.0 with areas of barren rock, sand having very low NDVI values of 0.1 or less; sparse vegetation (shrubs and grasslands) have moderate NDVI values (approximately 0.2 to 0.5). High NDVI values (approximately 0.6 to 0.9) correspond to dense vegetation (Zarco-Tejada et al., 2005; Boegh et al., 2002; Elvidge and Chen, 1995; Gao et al., 2000). For this study, the calculated NDVI maps were classified according to the USGS classification scheme adapted from Berhanu and Bisat (2018). From the classification (shown in Table 1), wetlands and water bodies were identified as ideal sites for RWH.
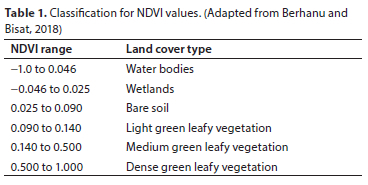
Water bodies and wetlands or swampy areas were identified as ideal sites for RWH. Dense green vegetation and bare soils were considered not to be ideal sites for RWH. Wetlands are shallow waterlogged areas or seasonally flooded marshes that act as land surface sponges by retaining a significant amount of water for long periods (Bullock and Acreman, 2003). NDMI was also used to extract water features from Band 5 (near infrared) and Band 6 (short-wave infrared) of the Landsat 8 imagery using Eq. 2:
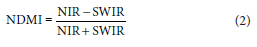
where SWIR represents the short-wave infrared and NIR represents the near infrared wavelength.
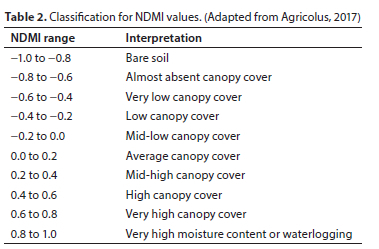
The SWIR is essential in differentiating wet conditions from dry conditions on land surfaces (Boschetti et al., 2014). NDMI values range from -1 to 1 depending on levels of moisture stress on land surfaces and vegetation. NDMI values ranging from 0.50 to 0.95 represents deep and extended water masses. Table 2 highlights the guidelines used in classifying the NDMI map as adapted from Agricolus (2017).
For the final classification to obtain areas suitable for RWH, values of NDVI representing wetlands and water bodies, as well as values of NDMI representing very high canopy cover and very high moisture content or waterlogging conditions, were selected as suitable sites for locating RWH sites. Thus, the suitable RWH sites were waterlogged areas, moisture-saturated areas and high canopy cover areas without water stress. Moisture stressed and canopy-covered areas were deemed undesirable RWH (Acharya et al., 2018). Therefore, streams, water bodies, land-based zones, wetlands and natural springs were regarded as the most suitable RWH sites.
Accuracy assessment of the classified RWH map
A confusion matrix was used lor assessing the accuracy of the classified maps using the accuracy assessment plugin in QGIS. Ground reference data were selected randomly for each land cover class. The following accuracy assessment metrics were obtained: user's accuracy, producers accuracy, overall accuracy and the Kappa statistic. The overall accuracy gives the proportion of area that is correctly classified. The user's accuracy specifies the odds of other classes in the map representing the same class. The producer's accuracy specifics the chances of a land cover class j in the reference data being classified as j in the map (Morisette and Khorram, 2000). The Kappa coefficient was used to determine levels of agreement between classified and referenced data for the different land cover classes (Tang et al., 2015). Table 3 shows the interpretation of Kappa coefficient values.
RESULTS AND DISCUSSION
Spatio-temporal variations of NDVI and NDMI
Figure 3 shows the spatial and temporal variations of NDVI and NDMI during the rainy and dry seasons in Ohimanimani District from 2013 to 2019. There was an east-west variation in NDVI with the eastern areas having higher NDVI values than the western areas. On the other hand, for NDMI, the western areas had higher values as compared to the eastern areas. Ihcse noted patterns were prevalent for both the wet and dry seasons in all the years.
Spatial variations of the classified NDVI and NDMI
Amongst the NDVI, of the 6 land cover classes, areas occupied by light green vegetation, swampy areas or wetlands and water bodies were considered suitable for RWH, whereas areas comprising bare soils, medium green and dense green land cover were considered unsuitable sites for RWH. For the six NDMI feature classes, the most suitable sites for RWH were water, waterlogged areas and low-water-strcsscd areas. The other three classes were considered not suitable for RWHS. These were areas with very high water stress (Fig. 4).
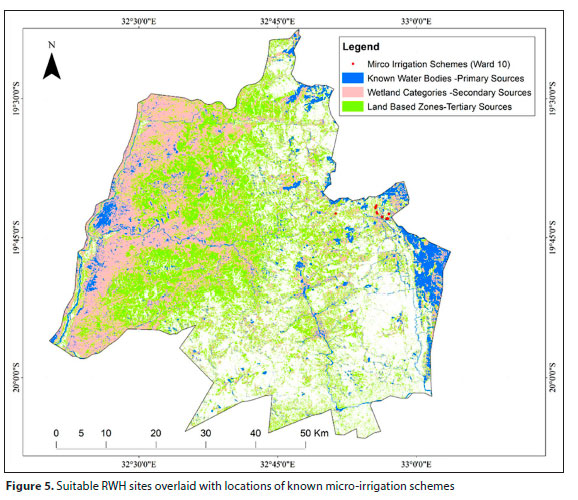
Figure 5 shows the potential RWH map that was obtained after overlaying NDVI and NDMI thematic maps. Three RWH sites which were identified included the primary sources comprising known water bodies, secondary sources occupied by wetlands and the tertiary sources or land-based zones. Water bodies occupy 6.11% (220.9761 km2), wetlands occupy 24.65% (896.3847 km2) while land-based RWH sites occupy 27.53% (995.823 km2) of the district.
The accuracy of the classified RWH map was assessed using the confusion matrix (Table 4). The overall accuracy of 78% explained a good agreement between the classified data and groundtruthed land cover reference data. Also, the Kappa coefficient was 0.63 which shows significant agreement between the classified data and the referenced data. Therefore, the classification was deemed accurate.
DISCUSSION
This research was aimed at identifying RWH sites using remote sensing-derived NDMI and NDVI in Chimanimani District in Zimbabwe. Results indicated that 58.29% of Chimanimani District is suitable for RWH. Suitable RWH sites comprised water bodies (6.11%), wetlands (24.65%) and land-based zones (27.53%) consisting of light green vegetation. Areas comprising bare soils, medium green and dense green vegetation are unsuitable for RWH. Such areas occupied 41.71% of the district. These findings concur with observations by Archarya et al. (2018) which showed that light green vegetation, swampy areas and water bodies are ideal for RWH as opposed to dense vegetation and bare soils.
In addition, the findings in this study are in agreement with those of Berhanu and Bisat (2018) and Alwanet al. (2020), who observed that NDVI was an essential multi-spectral index in identifying water-harvesting sites in Ethiopia and Iraq, respectively. Studies in the city of Tianjin in China also show good performance of NDVI and NDMI calculated from Landsat 8 and Landsat TM in detecting surface water bodies which are potential RWH sites. There was high precision in identifying sites which could retain water throughout the year (Zhai et al., 2015).
CONCLUSION
This study presents an objective approach of identifying suitable RWH sites in Chimanimani District in eastern Zimbabwe using satellite products. The results provide important evidence that NDVI and NDMI are valuable in extracting potential RWH sites. Thus, integrating GIS and remotely sensed spectral indices is a relatively simple, cheap and quick way of identifying suitable RWH sites for micro-irrigation projects, not only in Chimanimani District but in other geographically similar regions.
The approach adopted in this study enables water managers to assess the suitability of RWH for any given area in a similar environmental setting. This can empower farmers to apply low-cost irrigation technologies for micro-irrigation as they need to explore reliable water sources that support long-term farming projects. Nevertheless, there is still lack of information on the suitability of sites in harvesting rain-water for irrigation farming. Against this backdrop, this study successfully employed GIS and remote sensing-based technologies to determine RWH sites to supply water for small-scale irrigation projects.
AUTHOR CONTRIBUTIONS
Samuel Kusangaya conceived and designed the study. Mike Mushayi collected remote-sensing data and analysed the data. Never Mujere revised and submitted the manuscript. All authors wrote the manuscript.
REFERENCES
ACHARYA TD, SUBEDI A and LEE DH (2018) Evaluation of water indices for surface water extraction in a Landsat 8 scene of Nepal. Sensors 18 (8) 1-23. https://doi.org/10.3390/sl8082580 [ Links ]
ADHAM A, RIKSEN M, QUESSAR M and RITSEMA C (2016) Identification of suitable sites for rainwater harvesting structures in arid and semi-arid regions: A review. Int. Soil Water Conserv. Res. 4 (2) 108-120. https://doi.Org/10.1016/j.iswcr.2016.03.001 [ Links ]
AGRICOLUS (2017) NDVI and NDMI vegetation indices instructions for use in agriculture. URL: https://www.agricolus.com/en/how-to-use-vegetation-indices-from-remote-sensing-beyond-ndvi/ (Accessed 5 July 2021). [ Links ]
ALWAN IA, AZIZ NA and HAMOODI MN (2020) Potential water harvesting sites identification using spatial multi-criteria evaluation in Maysan Province, Iraq. ISPRS Int. J. Geo-Inf. 9 (4) 235. https://doi.org/10.3390/ijgi9040235 [ Links ]
BERHANU B and BISAT E (2018) Identification of surface water storing sites using topographic wetness index (TWI) and normalized difference vegetation index (NDVI). J. Nat. Resour. Dev. 8 91-100. https://doi.org/10.5027/jnrd.v8i0.09 [ Links ]
BOEGH E, BROGE HSN, HASAGER CB, JENSEN NO, SCHELDE K and THOMSEN A (2002) Airborne multispectral data for quantifying leaf area index, nitrogen concentration, and photosynthetic efficiency in agriculture. Remote Sens. Environ. 81 179-193. https://doi.org/10.1016/S0034-4257(01)00342-X [ Links ]
BOSCHETTI M, NUTINI F, BRIVIO PA and NELSON A (2014) Comparative analysis of normalised difference spectral indices derived from MODIS for detecting surface water in flooded rice cropping systems. PloS One 9 (2) e88741. https://doi.org/10.1371/journal.pone.0088741 [ Links ]
BULLOCK A and ACREMAN MC (2003) The role of wetlands in the hydrological cycle. Hydrol. Earth Syst. Set. 7 358-389. https://doi.org/10.5194/hess-7-358-2003 [ Links ]
CHIMANIMANI RURAL DISTRICT COUNCIL (2017) Chimanimani District climate change response & watershed management strategy. Chimanimani Rural District Council, Zimbabwe. [ Links ]
ELVIDGE CD and PORTIGAL FP (1990) Detection of trace quantities of green vegetation in 1989 AVIRIS data. Proceedings of the Second Airborne Visible/Infrared Imaging Spectrometer (AVIRIS) Workshop. 4-5 June 1990, Pasedena, California. [ Links ]
GAO B-C (1996) NDWI - A normalized difference water index for remote sensing of vegetation liquid water from space. Remote Sens. Environ. 58 257-266. https://doi.org/10.1016/S0034-4257(96)00067-3 [ Links ]
GRABS T, SIEBERT J, BISHOP K and LAUDON H (2009) Modeling spatial patterns of saturated areas: A comparison of the topographic wetness index and a dynamic distributed model, J. Hydrol. 373 (1-2) 15-23. https://doi.Org/10.1016/j.jhydrol.2009.03.031 [ Links ]
HABOUDANE D, MILLER JR, PATTEY E, ZARCO-TEJADA PJ and STRACHAN, IB (2004) Hyperspectral vegetation indices and novel algorithms for predicting green LAI of crop canopies: Modeling and validation in the context of precision agriculture. Remote Sens. Environ. 90 (3) 337-352. https://doi.Org/10.1016/j.rse.2003.12.013 [ Links ]
KAHINDA JM, LILLIE ESB, TAIGBENU AE, TAUTE M and BOROTO RJ (2008) Developing suitability maps for rainwater harvesting in South Africa. Phys. Chem. Earth A/B/C 33 (8) 788-799. https://doi.org/10.1016/j.pce.2008.06.047 [ Links ]
MORISETTE JT and KHORRAM S (2000) Accuracy assessment curves for satellite-based change detection. Photogramm. Eng. Remote Sens. 66 (7) 875-880. [ Links ]
NYIRENDA F, MHIZHA A, GUMINDOGA W and SHUMBA A (2021) A GIS-based approach for identifying suitable sites for rainwater harvesting technologies in Kasungu District, Malawi. Water SA 47 (3) 347-355. https://doi.org/10.17159/wsa/2021.v47.i3.11863 [ Links ]
SAHU A (2014) Identification and mapping of the water-logged areas in Purba Medinipur part of Keleghai river basin, India: RS and GIS methods. Int. J. Adv. Geosci. 2 (2) 59-65. https://doi.org/10.14419/ijag.v2i2.2452 [ Links ]
TANG W, HU J, ZHANG H, WU P and HE H (2015) Kappa coefficient: a popular measure of rater agreement. Shanghai Arch. Psychiat. 27 (1) 62-67. https://doi.Org/10.11919/j.issn.1002-0829.215010 [ Links ]
TIMBERLAKE JR, DARBYSHIRE I, WURSTEN B, HADJ-HAMMOU I, BALLINGS P, MAPAURA A, MATIMELE H, BANZE A, CHIPANGA H, MUASSINAR D, MASSUNDE M, CHELENE I, OSBORNE J and SHAH T (2016) Chimanimani Mountains: Botany and Conservation. Royal Botanic Gardens, London. [ Links ]
ZARCO-TEJADA PJ, WHITING M and USTIN SL (2005) Temporal and spatial relationships between within-field yield variability in cotton and high spatial hyperspectral remote sensing imagery. Agron. J. 97 (3) 641-653. https://doi.org/10.2134/agronj2003.0257 [ Links ]
ZHAI K, WU X, QIN Y and DU P (2015) Comparison of surface water extraction performances of different classic water indices using OLI and TM imageries in different situations. Geo-Spatial Inf Sci. 18 (1) 32-42. https://doi.org/10.1080/10095020.2015.1017911 [ Links ]
ZIMBABWE NATIONAL STATISTICS AGENCY (ZimStat) (2022) Population and housing census: Preliminary results dissemination. ZimStat, Harare. [ Links ]
 Correspondence:
Never Mujere
Email: emuj@yahoo.co.uk
Received: 9 September 2021
Accepted: 14 November 2022

