


Servicios Personalizados
Articulo
 Inglés (pdf)
 Articulo en XML
 Referencias del artículo
Indicadores

Links relacionados
-
 Citado por Google
 -
 Similares en Google
Compartir

 Permalink
Water SA
versión On-line ISSN 1816-7950
versión impresa ISSN 0378-4738
Water SA vol.49 no.1 Pretoria ene. 2023
http://dx.doi.org/10.17159/wsa/2023.v49.i1.3950
RESEARCH PAPER
Using Landsat satellite imagery to monitor the spatial and temporal dynamics of aquatic weed extent in Lakes Chivero and Manyame, located in an urban catchment of Zimbabwe
Munyaradzi Davis ShekedeI, II; Takudzwa GondoI; Melisa Matavire MavhengeIII; Aldridge Nyasha MazhinduI
IDepartment of Geography Geospatial Sciences and Earth Observation, Faculty of Science, University of Zimbabwe, Harare, Zimbabwe
IIZimbabwe National Geospatial and Space Agency, Department of Geospatial Science and Earth Observation, 630 Churchill Mount Pleasant, Harare, Zimbabwe
IIIIUCN, Block A Hatfield Gardens, 333 Grosvenor Street, Hatfield, Pretoria, South Africa
ABSTRACT
This study quantified the spatial and temporal variation of aquatic weeds in two lakes in an urban catchment of Zimbabwe using the automatic water extraction index (AWEI) and normalised difference vegetation index (NDVI) derived from Landsat satellite data from 1986 to 2020. Extent of aquatic weeds estimated using AWEI in Lake Chivero increased from less than 1 km2 (4%) in 1986 to 7 km2 (27%) in 2020. NDVI-based aquatic weed estimation gave the least spatial extent in the first few years. Similarly, in Lake Manyame aquatic weeds occupied ~62 ha (<1% in 1986) before reaching a peak extent of 60 km2 (~70%) in 1995, based on AWEI estimates. NDVI-derived aquatic weed extent ranged from less than 2 km2 in 1997 to a maximum of 56.12 km2 in 1994. Although AWEI and NDVI estimated similar extents, NDVI had higher estimates than AWEI. A non-significant positive trend in aquatic weed extent was detected for Lake Manyame based on AWEI (Mann-Kendal tau = 0.139, s = 69, p = 0.27) and NDVI (Mann-Kendal tau = 0.129, s = 64, p = 0.307). In Lake Chivero, a non-significant negative trend was observed in aquatic weed extent based on NDVI (Mann-Kendal tau = -0.06, s = -30, p = 0.6382), while a positive trend was detected using AWEI (tau = 0.0036, s = 18, p = 0.7827). Results of the regression analysis indicate that phosphorus (R2 = 0.7957, p = 0.00122) and nitrogen (R2 = 0.8992, p = 0.0011) significantly explained variations in aquatic weed infestation in Lake Chivero. These results suggest that phosphorus and nitrogen enrichment are key drivers of aquatic weed proliferation in the two lakes. Thus, sustainable management of water resources in the catchment hinges on reducing the amount of nutrients released into the lakes from sewage treatment plants and croplands.
Keywords: aquatic weeds, proliferation, remote sensing, water quality, urban catchment
INTRODUCTION
The invasion of water bodies by aquatic plants and their subsequent effect on aquatic environments is of global concern to ecologists and water resource managers. Globally, floating invasive aquatic plants such as water hyacinth (Eichhornia crassipes) have been a management challenge to inland water bodies such as rivers and lakes. These inland water bodies are prone to native species loss and to some extent extinction of invaluable species (Havel et al., 2015). In fact, the loss of aquatic plant species and associated faunal species composition results in the decline of goods and services that are derived from inland water bodies (Villamagna et al., 2010, Nhapi et al., 2004a; Havel et al., 2015). Moreover, the surface layer of aquatic plants prevents sunlight penetration in water bodies and causes hypoxia (Mallin et al., 2006), which negatively influences water quality and abundance of aquatic life (Ruiz Téllez et al., 2008; Gallardo et al., 2015; Utete et al., 2018; Nyamekye et al., 2021).
The rapid increase in aquatic weeds has mainly been driven by eutrophication (Shekede et al., 2008, Chawira et al., 2013). For instance, Nhapi et al. (2004a) identified urban agriculture and poor sewage treatment as the main causes of eutrophication in Lakes Chivero and Manyame, resulting in the extensive proliferation of aquatic weeds in the two water bodies. According to Kamusoko et al. (2013), urban sprawl, population growth and an economic meltdown have contributed to pressures that have ultimately led to a failing sewer system within the Harare Metropolitan Province and this has largely contributed to increased sewage contamination and overflows into the Lakes. Mbiba et al. (1993) attributes accelerated nutrient loads into the tributaries that feed into Lake Chivero to the increased use of artificial fertilisers in urban agriculture practices (Nyamekye et al., 2021). These artificial fertilisers and sewage are rich in nitrogen and phosphorus. An estimated 48.9 g/m-2 of total nitrogen and 25.39 g/m-2 of total phosphorus are being transported into Lake Chivero per year through its main tributaries, namely, Marimba, Mukuvisi and Manyame (Nyarumbu et al., 2016). Although these studies have identified the major drivers of nutrient enrichment in these two water bodies, they neither quantified the dynamics in aquatic weeds nor objectively established the relationship between aquatic weed proliferation and their potential drivers. Yet such information is critical for integrated water resource management in urban catchments, where pressures on water resources are increasing from rapidly growing demands and climate change.
Remote sensing and GIS techniques are increasingly becoming invaluable in mapping pollution and weed proliferation in water bodies (Jensen, 1996; Shekede et al., 2008; Kamusoko et al., 2013). Such geospatial technologies are important for monitoring variations in the quantity of aquatic weeds in such water bodies, thus providing platforms for interventions. For example, Muchini et al. (2018), using remotely sensed imagery, showed that water pollution from both point and non-point sources has increased eutrophication and reduced the water quality of Lake Chivero and Manyame. Shekede et al. (2018) concluded that there was a decreasing trend in areas covered by aquatic weeds in Lake Chivero between 1972 and 2000, owing to a combination of chemical, biological and physical controls. Nhapi et al. (2004a) used the mass balance equation in the analysis of water quality and concluded that Lake Chivero is hypertrophic. Kibena et al. (2014) assessed the impacts of population growth on water pollution in the Upper Manyame catchment using image classification and the results indicated that rapid urbanisation and agriculture are the main causes of declining water quality. In another study, Dube et al. (2018) showed an expansion in agricultural land coupled with an increase in water hyacinth in Lake Chivero. In addition, Masocha et al. (2018) integrated satellite data and in-situ measurements to estimate water quality in Lakes Chivero and Manyame and the results demonstrated that Lake Chivero was more polluted than Lake Manyame.
Although these studies have applied remote sensing in monitoring aquatic weeds, none have quantified aquatic weed proliferation at relatively fine temporal scales and for a long period of time (> 3 decades). Furthermore, previous studies analysed the eutro-phication in Lakes Chivero and Manyame separately, thereby making it difficult to compare eutrophication and aquatic weed infestation in both lakes (Kibena et al., 2014, Shekede et al., 2013, Dube et al., 2018). This study, therefore, builds and extends on previous studies by not only quantifying aquatic weed proliferation using two multispectral indices but by further analysing the drivers of aquatic weed proliferation in Lakes Chivero and Manyame, the two main water sources of Harare, the capital city of Zimbabwe. Understanding the spatial and temporal variations in the aquatic weeds is critical for sustainable water resource management, especially in the context of rapid fluctuations in water resources induced by rainfall variability and climate change.
MATERIALS AND METHODS
Study area
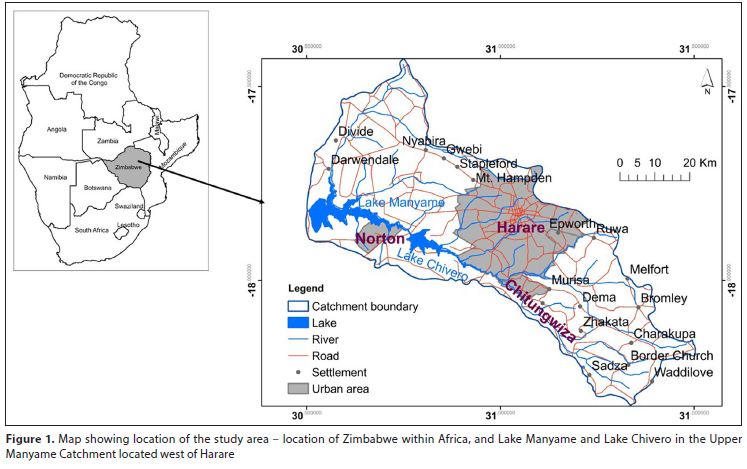
For this study, Lakes Chivero (formerly Lake McIlwaine) and Manyame (formerly Darwendale Dam), located 76 km and 35 km west of Harare, respectively, were selected as study sites (Fig. 1). The two reservoirs are man-made lakes, with Chivero having been established in 1956 and Manyame in 1976. The surface area of Lake Chivero is 26.32 km2, with an estimated width of ~2km, while Lake Manyame covers an area of 292.60 km2. Lake Manyame has a storage capacity of 480 200 ML and an average depth of 9.4 m. On the other hand, Lake Chivero has a capacity of 250 400 ML and also has a mean depth of 9.4 m. The two lakes are the main water sources for Harare and Norton as well as surrounding farms. However, the two lakes suffer from water pollution owing to their downstream location relative to the City of Harare. The disposal of raw sewage, and runoff from urban agriculture in Harare and Chitungwiza, increases nutrient concentration in the lakes, thereby facilitating the growth of aquatic weeds (Nhamo and Tirivarombo, 2004).
Data sources
Satellite data
Thirty-five Landsat images covering the study area (Worldwide Reference System-2 =17072) were downloaded free of charge, from the USGS Earth Explorer website hosted at: https://earthexplorer.usgs.gov. The Landsat Mission (from Landsat 5 through to Landsat 8) was selected due to its long-term archival record (~40 years) and relatively high spatial resolution (~30 m). Yearly images from 1986 to 2020 were used to capture fine-scale spatial and temporal variation in aquatic weeds. To do this, the 35 cloudless Landsat images acquired during the months of April and May were downloaded and analysed to estimate aquatic weed extent in the two lakes. Ideally, the study should have applied anniversary images for estimating aquatic coverage in the two lakes. However, images for some months were not available or were heavily affected by clouds thereby rendering them unusable for the focal application. Nonetheless, the images used were close to each other in time and therefore the spatial extent of aquatic weeds was not likely to be significantly affected. The selected months coincide with the start of the dry season in the country and have less cloud cover.
Water quality data
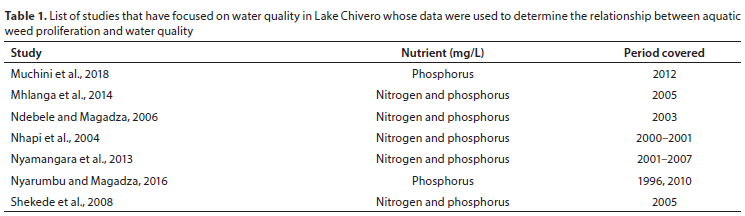
As nutrient enrichment is a major driver of primary productivity in water bodies, the study related variations in aquatic weed extent to two macro-nutrients, namely, total nitrogen and total phosphorus. To do this, water quality data were collated from previous studies carried out on Lake Chivero and Lake Manyame. However, comprehensive data were only available for Lake Chivero and as such the relationship between water quality and aquatic weed proliferation was only established for Lake Chivero (Table 1).
Data analysis
Image pre-processing
Prior to image analysis, all satellite images were corrected for atmospheric attenuation using the dark object subtraction method available in the Semi-Automatic Classification Plug-in available in Quantum GIS (Chander et al, 2009; Congedo 2016). The process of atmospheric correction converts top-of-atmosphere (TOA) reflectance to surface reflectance (Hadjimitsis et al., 2004). An image-based atmospheric correction called dark object subtraction (DOS) technique of atmospheric corrections was employed in this study (Ding et al., 2015; Gilmore et al., 2015). These radiometric corrections were performed to convert the digital number (DN) values to at-sensor reflectance (Hill and Sturm, 1991). Coefficients for atmospheric correction were obtained from metadata files which contain sensor-specific information used for the calibration process from DN values to TOA reflectance.
Aquatic weed estimation
Previous studies carried out on the estimation of aquatic weeds in lakes mostly used vegetation indices to estimate the spatial extent (Dube et al., 2017). However, water extraction indices offer an alternative way to estimate surface water resources, including the aquatic weeds. After image pre-processing the automatic water extraction index (AWEI) and normalised difference vegetation index (NDVI) were computed to extract areas under aquatic weeds. AWEI is a new water extraction index that has an ability to separate water pixels from non-water pixels on water surfaces, as compared to NDWI and MNDWI (Feyisa et al., 2014). The two spectral indices were calculated as follows:
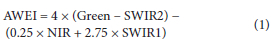

where NIR is the reflectance in the near-infrared band, R is the reflectance in the red band, SWIR1 and SWIR2 are the two shortwave infrared bands.
After computing the AWEI, the threshold of 0 was used to differentiate water-holding pixels from pixels with aquatic weeds (Feyisa et al., 2014). Binary maps were then created; (1) values represented water and (0) values represented aquatic weeds. On the other hand, we used a threshold of >0.2 and <0 to represent aquatic weeds and water/non-aquatic weed surfaces, respectively. Aquatic weed pixels for every year were extracted to determine area occupied by aquatic weeds before performing a Mann-Kendall trend test. The accuracy of the classification was assessed using the Kappa statistic, which was >98% across all years. A student t-test was used to test whether there were significant differences in areal extent of aquatic weeds estimated using AWEI versus NDVI.
Determination of trends in aquatic weed extent
The Mann-Kendall trend test (M-K test) was used to test whether and in what way the area covered by aquatic weeds in each of the two lakes exhibited any significant trends over time. The M-K test assesses if there are consistently increasing or decreasing trends (monotonic) in observed phenomena over time (Pohlert, 2020; Duhan and Pandey, 2013; Shadmani et al, 2012). The Mann-Kendall trend test takes the following form:
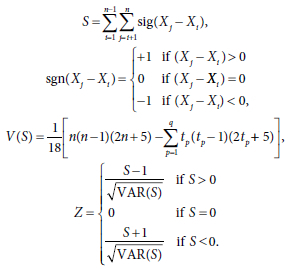
where Xi and Xj are the time-series observations in chronological order, n is the length of the time series, tp is the number of ties for pth value, q is the number of tied values.
The Mann-Kendall trend test has been widely used in trend detection for a number of phenomena including precipitation (Duhan and Pandey, 2013) and evapotranspiration (Shadmani et al, 2012).
Relationship between aquatic weed extent and nutrient concentration
An ordinary least squares regression was used to assess whether and to what extent water quality (i.e., nitrogen and phosphorus) is related to aquatic weed proliferation. As previously mentioned, the analysis was only performed for Lake Chivero as the available data were too limited to allow for meaningful statistical analysis for Lake Manyame. The two nutrients were selected for analysis as they are responsible for aquatic weed proliferation and algal blooms across many aquatic systems. These two nutrients can be used as an indicator of eutrophication (Nyarumbu and Magadza, 2016; Nhapi et al, 2004b).
Validation of aquatic weeds
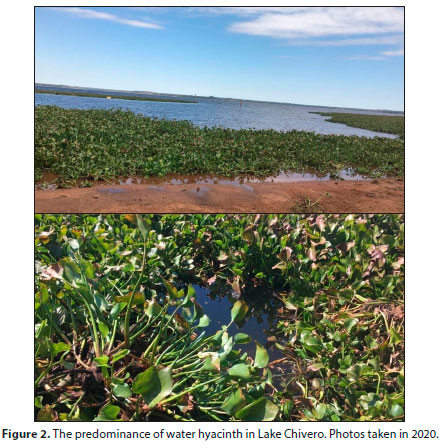
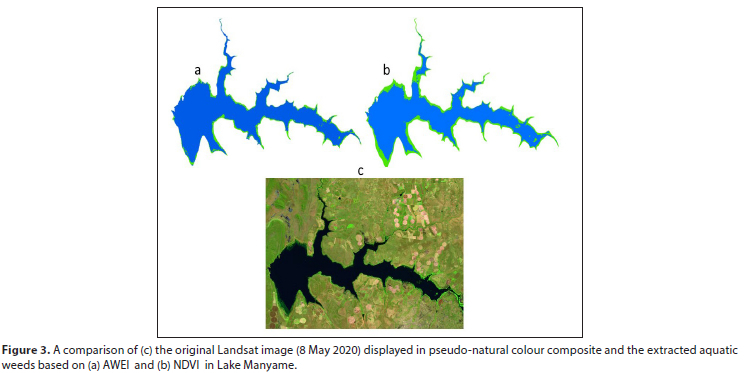
The data from classified images were validated based on fieldwork that was carried out over the years in the two lakes as well as based on results from previous studies. For instance, photographs taken during fieldwork in 2020 indicated that water hyacinth was the predominant aquatic weed in Lake Chivero (Fig. 2). Similarly, previous studies (Shekede et al., 2008; Dube et al., 2014, 2017, 2018; Chawira, et al., 2013) confirm that water hyacinth is the main plant in Lake Chivero, with other plants and aquatic weeds only comprising a small proportion. A visual comparison of the estimated spatial extent of the aquatic weeds based on (a) AWEI and (b) NDVI versus the original Landsat 8 image shows the general performance of the spectral indices in measuring aquatic weed abundance (Fig. 3).
RESULTS
Spatial and temporal variation in aquatic weeds in Lake Manyame
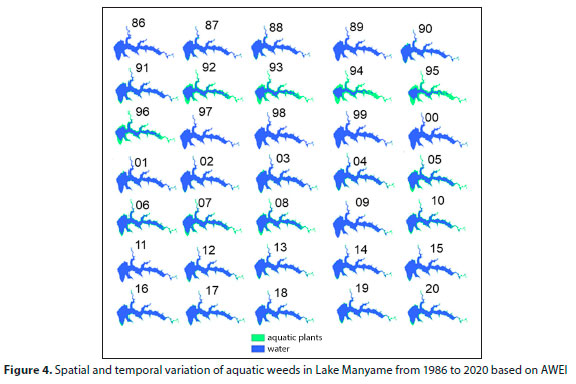
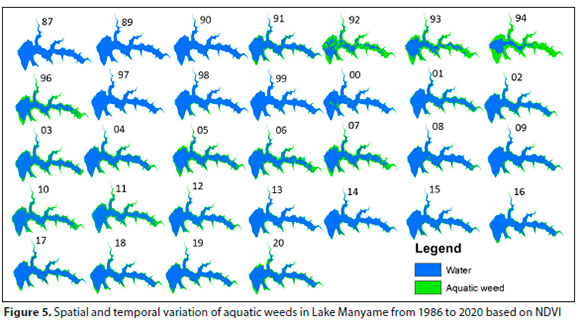
Figures 4 and 5 illustrate the spatial variations in aquatic weed extent as derived from remotely sensed data based on AWEI and NDVI over a 35-year period for Lake Manyame. Although the AWEI-derived spatial extent of aquatic weeds fluctuated over the years, there was a general increase over the 35-year period in Lake Manyame. For instance, in 1986 aquatic weeds occupied less than a square kilometre (<1%), but this increased to 4.6 km2 (6%) in 1988. Thereafter, aquatic weed extent decreased to <1 km2 (<1%) in 1989 before increasing drastically from 1990, reaching a peak of ~60 km2 (74%) in the year 1995. In fact, a large spatial extent of aquatic weeds was maintained from 1992 when the country experienced one of the most extreme droughts up until the year 1996. A significant decline thereafter resulted in aquatic weeds occupying 0.6 km2 (~1%) in 1997 followed by a gradual increase up to the year 2005 when a total area of 21 km2 (26%) was covered by aquatic weeds. The aquatic weed area decreased in 2012 after fluctuations from the year 2008 to 2011.The subsequent years were characterised by a relatively gradual increase in area under aquatic weeds from approximately 5 km2 (6%) to 12 km2 (15%) during the period 2014 to 2020.
NDVI-derived aquatic weed spatial extent shows that the area occupied by aquatic weeds ranged from a minimum of less than 2 km2 in 1997 to a maximum of 56.12 km2 in 1994. It can be observed that the first few years had the least spatial extent of aquatic weeds, which then increased substantially from 1991 (15.41 km2) when the country experienced one of its worst droughts in history, lasting up to the year 1996 (31.22 km2). Thereafter, aquatic weeds decreased in spatial extent and the weeds were mostly confined to the edges of the lake. The pattern is similar to the aquatic weed dynamics derived from AWEI.
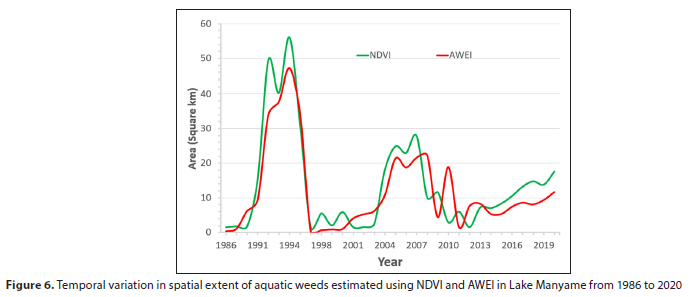
Although AWEI and NDVI estimated similar spatial patterns of aquatic weeds over the study period, NDVI tended to give a significantly higher areal extent of aquatic weeds than that estimated using AWEI (t = -4.452, df = 73.496, p-value = 0.000: Fig. 6). For instance, the maximum areal extent in 1994 was 15% higher when derived from NDVI than AWEI. However, they differ on the minimum spatial extent of aquatic weeds in the lake with NDVI estimates being 80% greater than AWEI-derived estimates.
Spatial and temporal variation in aquatic weeds in Lake Chivero
An analysis of the spatial dynamics of aquatic weeds in Lake Chivero based on AWEI illustrates similar patterns to that of Lake Manyame (Fig. 7). Fewer aquatic weeds were observed in Lake Chivero from 1986 to early the 1990s. During this period, aquatic weeds rarely exceeded an area of 5 km2, i.e., less than 19% of the lake's surface area. The year 1986 had the smallest area under aquatic weeds (~1 km2 i.e., 4%) whilst 2020 recorded the highest (~7 km2, i.e., 27%). Overall, there was a general increase in the area under aquatic weeds over the 35-year period.
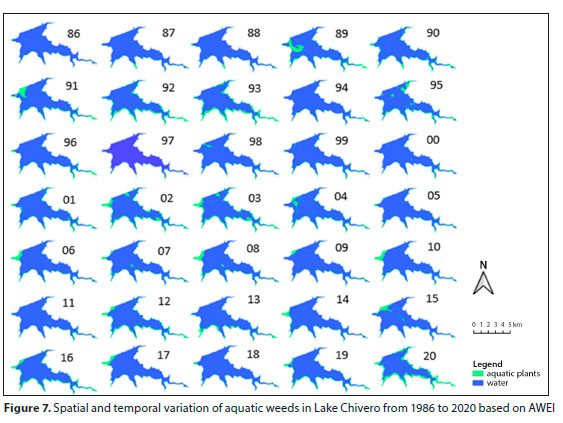
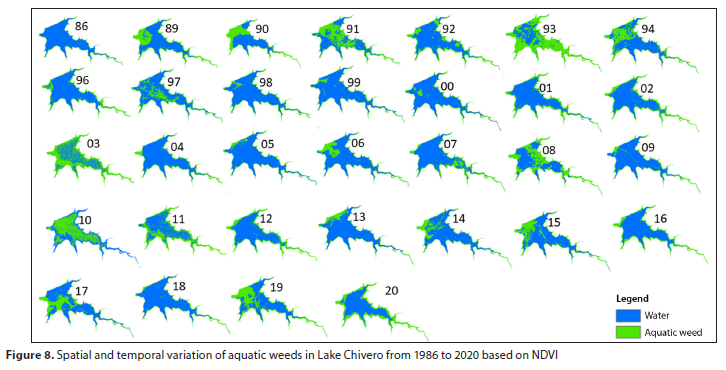
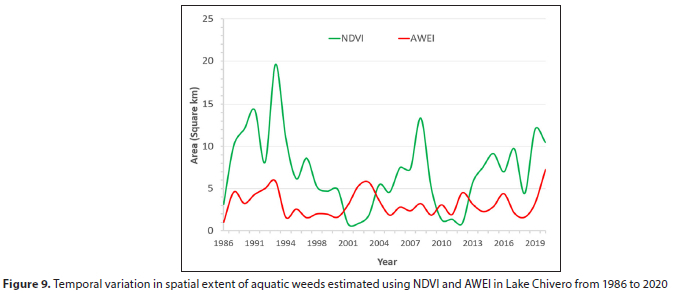
The spatial extent of aquatic weeds based on NDVI shows that Lake Chivero was characterised by more year-to-year fluctuations in areas under aquatic weeds during the period from 1986 to 2020 (Figs 8 and 9). Although the first few years had the smallest spatial extent of aquatic weeds, the subsequent years were characterised by relatively high aquatic weed infestation. The years 1993, 2003 and 2010 had the largest area under aquatic weeds. For the two lakes, aquatic weeds were mostly concentrated at the shores and areas close to the spillway (Plate 1). It is also observed that Lake Manyame had more gradual changes in aquatic weed extent than Lake Chivero. Proportionally, Lake Chivero has a greater aquatic weed infestation than Lake Manyame, suggesting more nutrient enrichment in Lake Chivero than Manyame.
Trends in extent of aquatic weeds
Results of the trend analysis illustrate a positive but nonsignificant trend in the area under aquatic weeds for Lake Manyame based on AWEI (Mann-Kendal tau = 0.139, s = 69, p = 0.27) and NDVI (Mann-Kendal tau = 0.129, s = 64, p = 0.307). This suggests an increasing trend in areal extent of aquatic weeds in Lake Manyame. On the other hand, statistically non-significant but contrasting results were obtained regarding trends in extent of aquatic weeds in Lake Chivero based on the two spectral indices. For instance, while a negative trend was observed in area covered by aquatic weeds in Lake Chivero based on NDVI (Mann-Kendal tau = -0.06, s = -30, p = 0.6382), a positive trend was observed based on AWEI (tau = 0.0036, s = 18, p = 0.7827).
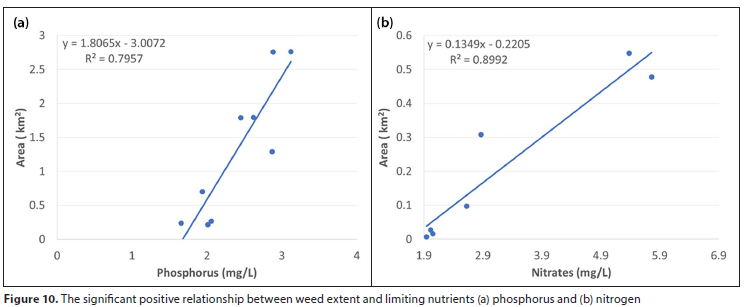
Relationship between aquatic weed extent and phosphorus concentration
Figure 10 shows the relationship between aquatic weed extent and: (a) phosphorus and (b) nitrogen concentration in Lake Chivero. It can be observed that there is strong and significant positive relationship between aquatic weed extent and phosphorus (R2 = 79.57, p = 0.00122) and weed extent and nitrates (R2 = 0.8992, p = 0.0011) in Lake Chivero.
DISCUSSION
The objective of this study was to analyse the spatial and temporal variations in the extent of aquatic weeds in two major lakes of the Upper Manyame catchment, i.e., Chivero and Manyame, for the period 1986 to 2020, based on satellite data. Furthermore, the study related aquatic weed extent with nutrient concentration levels in Lake Chivero. Results indicate that aquatic weeds generally increased over time despite the fluctuations experienced in the two lakes, with more variability observed in Chivero than Manyame. In addition, the study observed a positive relationship between these fluctuations and nutrient loading in the lakes and concluded that eutrophication could be driving aquatic weed abundance. These results have important implications for water resource management, which is key to attaining several sustainable development goals, especially SDG 6 which seeks to ensure universal access to safe water and adequate sanitation by focusing attention on the quality, accessibility, and management of the freshwater supply.
Although the spatial extent of aquatic weeds fluctuated over time, there is a general increase in the area occupied by aquatic weeds in both lakes. These results are in agreement with general observations across the country and across Africa, where several water bodies, especially those in urban catchments, are experiencing an increase in aquatic weeds (Nyamekye et al., 2021). For instance, Dersseh et al. (2020) observed similar trends in Lake Tana in Ethiopia while Nyenje et al. (2010) reported an increasing trend in eutrophication and aquatic plants in urban areas of sub-Saharan Africa. In Zimbabwe, Dube et al. (2014) observed a severe decline in water quality in most inland water bodies of Zimbabwe owing to point and non-point pollution resulting in eutrophication and attendant proliferation of aquatic weeds such as water hyacinth. Raw sewage, industrial and domestic waste, as well as infrequent garbage collection by city councils are the major point sources while agriculture and mining activities constitute non-point sources (Magadza, 1997; Chawira et al., 2013; Gufe et al., 2022). The general economic meltdown coupled with rapid expansion of the city with no commensurate increase in sewer infrastructure have been cited as the main reasons for eutrophication, owing to poor waste and sewage management practices (Nhapi, 2009). The two lakes receive their water from Marimba and Mukuvisi Rivers, which are the major recipients of polluted water from the two cities (Nhapi et al., 2006). Therefore, proper sewage treatment by urban councils could be key to reducing eutrophication in tributaries of the two lakes and ultimately the lakes themselves.
The study revealed a significant positive relationship between aquatic weed proliferation and nutrient concentration, implying a positive influence of nutrient enrichment on aquatic weed proliferation. The observation of a positive relationship between the two macronutrients (phosphorus and nitrogen) and increase in aquatic weed infestation is not surprising as these two nutrients directly influence aquatic weed growth and abundance (Nyarumbu and Magadza, 2016). However, our study is among the few that have empirically tested the relationship between nutrient enrichment and aquatic weed proliferation. Previous studies have attributed the increase in aquatic weeds in the two lakes to urban agriculture and sewage disposal which enriches the water bodies with nitrogen and phosphorus (Nhapi and Tirivarombo, 2004; Shekede et al, 2008). However, of the two nutrients, nitrogen has a greater influence on aquatic weed growth than phosphorus, hence sewage disposal in water bodies has more influence on eutrophication than urban agriculture (Kobayashi et al, 2008). This in part could explain why Lake Manyame, located downstream of Lake Chivero, had relatively stable water quality, attributed to nitrogen being the main limiting nutrient instead of phosphorus. However, results of this study have demonstrated an increase in aquatic weeds in both lakes, suggesting that the two lakes are suffering from eutrophication.
Both lakes suffer from aquatic weed proliferation as they lie downstream of Harare and Chitungwiza, two major cities responsible for discharging partially treated and even raw sewage into the Marimba, Manyame and Nyatsime Rivers. These rivers play a significant role in the addition of limiting nutrients to Lakes Chivero and Manyame (Nhapi and Tirivarombo, 2004). Lake Chivero has abundant aquatic weeds relative to its size, as it is upstream of Lake Manyame making it the primary receiver of the nutrients. Nutrient concentration tends to be less variable than water flow but tends to vary downstream (Vogel et al., 2003), therefore explaining the difference in nutrient concentration in the two lakes. Fluctuations in aquatic weeds can also be explained by the rainy season. Shekede et al. (2008) suggest that flooding may displace weeds in water bodies and dilute nutrient concentration, hence decreasing weed abundance in water bodies.
Where our study differs from previous studies is in testing the utility of AWEI and NDVI in mapping the spatial extent of aquatic weeds. Although previous studies have demonstrated the potential of spectral indices such as NDVI, our study is among the first to test the potential of AWEI, a water extraction index, in estimating aquatic weed infestations. Unlike image classification, spectral indices provide a rapid and more reliable way of quantifying aquatic weeds in water bodies. Thus, water extraction indices such as AWEI and NDVI provide alternative approaches to detecting and assessing dynamics in aquatic weeds, which is critical in sustainable water resource management (Thamaga and Dube, 2018). However, differences in aquatic weed estimates based on the two indices implies the need for caution. In this regard, there may be a need to test the influence of different thresholds of spectral indices, water body size and depth on the estimated spatial extent of aquatic weeds.
A potential weakness in this study is the limited number of observations on phosphorus and nitrogen concentration in the two lakes that is likely to influence the relationship between nitrogen and phosphorus and the aquatic weed coverage. Generally, it is expected that the larger the sample size the more likely we are to detect the true nature of the relationship between variables. Nonetheless, the results presented here are corroborated by previous studies that have detected a positive relationship between nutrient enrichment, especially of limiting nutrients such as nitrogen and phosphorus, and primary productivity in water bodies.
CONCLUSION
The objective of this study was to test the utility of AWEI to quantify the spatial and temporal dynamics of aquatic weed extent in eutrophic Lakes Manyame and Chivero located in the highly urbanised Upper Manyame catchment, Zimbabwe. Results from this study revealed that AWEI and NDVI can successfully be used to quantify spatial and temporal changes in aquatic weeds in highly eutrophic inland water bodies. Moreover, the significant positive relationship between aquatic weed extent and nutrient concentration implies the need for proper sewage management for improving water quality in the two water bodies. It can thus be concluded that remote sensing coupled with in-situ measurements provide a viable way of monitoring water resources towards achiving sustainable integrated management in rapidly urbanising environments.
AUTHOR CONTRIBUTIONS
MDS conceptualised, wrote and supervised the study, TG analysed and wrote the initial manuscript, AM processed satellite data, MMM interpreted results and wrote initial draft.
ORCID
Munyaradzi Davis Shekede: https://orcid.org/0000-0002-6540-3316
REFERENCES
CHANDER G, MARKHAM BL and HELDER DL (2009) Summary of current radiometric calibration coefficients for Landsat MSS, TM, ETM+, and EO-1 ALI sensors. Remote Sens. Environ. 113 (5) 893-903. https://doi.org/10.10167j.rse.2009.01.007 [ Links ]
CHAWIRA M, DUBE T and GUMINDOGA W (2013) Remote sensing based water quality monitoring in Chivero and Manyame lakes of Zimbabwe. Phys. Chem. Earth 66 38-44. https://doi.org/10.1016/j.pce.2013.09.003 [ Links ]
CONGEDO L (2016) Semi-Automatic Classification Plugin Documentation 5.0.0.1. URL: https://semiautomaticclassificationmanual-v5.readthedocs.io/_/downloads/fa/latest/pdf/ (Accessed 31 May 2022). [ Links ]
DERSSEH MG, TILAHUN SA, WORQLUL AW, MOGES MA, ABEBE WB, MHIRET DA and MELESSE AM (2020) Spatial and temporal dynamics of water hyacinth and its linkage with lake-level fluctuation: Lake Tana, a sub-humid region of the Ethiopian highlands. Water 12 (5) 1435. https://doi.org/10.3390/w12051435 [ Links ]
DING H, SHI J, WANG Y and WEI L (2015) An improved dark-object subtraction technique for atmospheric correction of Landsat 8. In: MIPPR 2015: Remote Sensing Image Processing, Geographic Information Systems, and other Applications 9815 128-135. [ Links ]
DUBE T, GUMINDOGA W and CHAWIRA M (2014) Detection of land cover changes around Lake Mutirikwi, Zimbabwe, based on traditional remote sensing image classification techniques. Afr. J. Aquat. Sci. 39 (1) 89-95. https://doi.org/10.2989/16085914.2013.870068 [ Links ]
DUBE T, MUTANGA O, SIBANDA M, BANGAMWABO V and SHOKO C (2017) Testing the detection and discrimination potential of the new Landsat 8 satellite data on the challenging water hyacinth (Eichhornia crassipes) in freshwater ecosystems. Appl. Geogr. 84 11-22. https://doi.org/10.1016/j.apgeog.2017.04.005 [ Links ]
DUBE T, SIBANDA M, BANGAMWABO V and SHOKO C (2018) Establishing the link between urban land cover change and the proliferation of aquatic hyacinth (Eichhornia crassipes) in Harare Metropolitan, Zimbabwe. Phys. Chem. Earth A/B/C 108 19-27. https://doi.org/10.1016/j.pce.2018.09.010 [ Links ]
DUHAN D and PANDEY A (2013) Statistical analysis of long term spatial and temporal trends of precipitation during 1901-2002 at Madhya Pradesh, India. Atmos. Res. 122 136-149. https://doi.org/10.1016/j.atmosres.2012.10.010 [ Links ]
FEYISA GL, MEILBY H, FENSHOLT R and PROUD SR (2014) Automated Water Extraction Index: A new technique for surface water mapping using Landsat imagery. Remote Sens. Environ. 140 23-35. https://doi.org/10.1016/j.rse.2013.08.029 [ Links ]
GALLARDO B, CLAVERO M, SANCHEZ MI and VILÀ M (2015) Global ecological impacts of invasive species in aquatic ecosystems. Glob. Change Biol. 22 (1) 151-163. https://doi.org/10.1111/gcb.13004 [ Links ]
GILMORE S, SALEEM A and DEWAN A (2015) Effectiveness of DOS (Dark-Object Subtraction) method and water index techniques to map wetlands in a rapidly urbanising megacity with Landsat 8 data. In: Veenendaal B and Kealy A (ed.) Proceedings of Research@Locate in conjunction with the annual conference on spatial information in Australia and New Zealand, Vol-1323, Mar 10-12 2015. CEUR-WS, Brisbane. 100-108. [ Links ]
GUFE C, KAREMBERA B, MARUMURE J and MAKUVARA Z (2022) Lead, silver nitrate and antibiotic resistance in bacteria isolated from Nile tilapia (Oreochromis niloticus) in anthropogenically polluted Lake Chivero, Zimbabwe. Cogent Food Agric. 8 (1) 2082040. https://doi.org/10.1080/23311932.2022.2082040 [ Links ]
HADJIMITSIS DG, CLAYTON CRI and HOPE VS (2004) An assessment of the effectiveness of atmospheric correction algorithms through the remote sensing of some reservoirs. Int. J. Remote Sens. 25 (18) 3651-3674. https://doi.org/10.1080/01431160310001647993 [ Links ]
HAVEL JE, KOVALENKO KE, THOMAZ SM, AMALFITANO S and KATS LB (2015) Aquatic invasive species: challenges for the future. Hydrobiologia 750 147-170. https://doi.org/10.1007/s10750-014-2166-0 [ Links ]
HILL J and STURM B (1991) Radiometric correction of multitemporal thematic mapper data for use in agricultural land-cover classification and vegetation monitoring. Int. J. Remote Sens. 12 (7) 1471-1491. https://doi.org/10.1080/01431169108955184 [ Links ]
JENSEN JR (1996) Introductory Digital Image Processing: A Remote Sensing Perspective (2nd edn). Prentice-Hall Inc., New Jersey. https://doi.org/10.1080/01431168608948975 [ Links ]
KAMUSOKO C, GAMBA J and MURAKAMI H (2013) Monitoring Urban Spatial Growth in Harare Metropolitan Province, Zimbabwe. Adv. Remote Sens. 2 (4) 322-331. https://doi.org/10.4236/ars.2013.24035 [ Links ]
KIBENA J, NHAPI I and GUMINDOGA W (2014) Assessing the relationship between water quality parameters and changes in landuse patterns in the Upper Manyame River, Zimbabwe. Phys. Chem. Earth 67-69 153-163. https://doi.org/10.1016/j.pce.2013.09.017 [ Links ]
KOBAYASHI JT, THOMAZ SM and PELICICE FM (2008) Phosphorus as a limiting factor for Eichhornia crassipes growth in the upper Parana River floodplain. Wetlands 28 (4) 905-913. https://doi.org/10.1672/07-89.1 [ Links ]
MAGADZA CHD (1997) Water pollution and catchment management in Lake Chivero. Lake Chivero: A Polluted Lake. University of Zimbabwe Publications, Harare. 13-26. https://doi.org/10.1016/j.enmm.2018.09.006 [ Links ]
MALLIN MA, JOHNSON VL, ENSIGN SH and MACPHERSON TA (2006) Factors contributing to hypoxia in rivers, lakes, and streams. Limnol. Oceanogr. 51 (1) 690-701. https://doi.org/10.4319/lo.2006.51.1_part_2.0690 [ Links ]
MASOCHA M, DUBE T, NHIWATIWA T and CHORUMA D (2018) Testing utility of Landsat 8 for remote assessment of water quality in two subtropical African reservoirs with contrasting trophic states, Geocarto Int. 33 (7) 667-680. https://doi.org/10.1080/10106049.2017.1289561 [ Links ]
MBIBA B (2000) Urban agriculture in Harare: between suspicion and repression. In: Bakker N, Dubbeling M, Gündel S, Sabel-Koschella U and De Zeeuw H (eds.) Growing Cities, Growing Food: Urban Agriculture on the Policy Agenda. A Reader on Urban Agriculture. Resource Centre on Urban Agriculture and Forestry, Leusden. [ Links ]
MHLANGA L, MHLANGA W and TENDAUPENYU P (2014) Response of phytoplankton assemblages isolated for short periods of time in a hyper-eutrophic reservoir (Lake Chivero, Zimbabwe). Water SA 40 (1) 157-164. https://doi.org/10.4314/wsa.v40i1.19 [ Links ]
MUCHINI R, GUMINDOGA W, TOGAREPI S, MASARIRA TP and DUBE T (2018) Near real time water quality monitoring of Chivero and Manyame lakes of Zimbabwe. Proc. Int. Assoc. Hydrol. Sci. 378 85-92. https://doi.org/10.5194/piahs-378-85-2018 [ Links ]
NDEBELE MR and MAGADZA CHD (2006) The occurrence of microcystin-LR in Lake Chivero, Zimbabwe. Lakes Reservoirs Res. Manage. 11 (1) 57-62. https://doi.org/10.1111/j.1440-1770.2006.00287.x [ Links ]
NHAPI I, SIEBEL MA and GIJZEN HJ (2004a) The impact of urbanisation on the water quality of Lake Chivero, Zimbabwe. Water Environ. J. 18 (1) 44-49. https://doi.org/10.1111/j.1747-6593.2004.tb00492.x [ Links ]
NHAPI I and TIRIVAROMBO S (2004) Sewage discharges and nutrient levels in Marimba River, Zimbabwe. Water SA 30 (1) 107-113. https://doi.org/10.4314/wsa.v30i1.5033 [ Links ]
NHAPI I, SIEBEL MA and GIJZEN HJ (2006) A proposal for managing wastewater in Harare, Zimbabwe. Water Environ. J. 20 (2) 101-108. https://doi.org/10.1111/j.1747-6593.2006.00018.x [ Links ]
NHAPI I (2009) The water situation in Harare, Zimbabwe: a policy and management problem. Water Polic. 11 (2) 221-235. https://doi.org/10.2166/wp.2009.018 [ Links ]
NYAMANGARA J, JEKE N and RURINDA J (2013) Long-term nitrate and phosphate loading of river water in the Upper Manyame Catchment, Zimbabwe. Water SA 39 (5) 637-642. https://doi.org/10.4314/wsa.v39i5.7 [ Links ]
NYAMEKYE C, OFOSU SA, ARTHUR R, OSEI G, APPIAH LB, KWOFIE S, GHANSAH B and BRYNIOK D (2021) Evaluating the spatial and temporal variations of aquatic weeds (biomass) on Lower Volta River using multi-sensor Landsat Images and machine learning. Heliyon 7 (5) e07080. https://doi.org/10.1016/j.heliyon.2021.e07080 [ Links ]
NYARUMBU TO and MAGADZA CHD (2016) Using the Planning and Management Model of Lakes and Reservoirs (PAMOLARE) as a tool for planning the rehabilitation of Lake Chivero, Zimbabwe. Environ. Nanotechnol. Monit. Manage. 5 1-12. https://doi.org/10.1016/j.enmm.2015.10.002 [ Links ]
NYENJE PM, FOPPEN JW, UHLENBROOK S, KULABAKO R and MUWANGA A (2010) Eutrophication and nutrient release in urban areas of sub-Saharan Africa - a review. Sci. Total Environ. 408 (3) 447-455. https://doi.org/10.1016/j.scitotenv.2009.10.020 [ Links ]
POHLERT T (2016) Non-parametric trend tests and change-point detection. R Package URL: http://creativecommons.org/licenses/by-nd/4.0/ (Accessed 10 October 2022) [ Links ]
TÉLLEZ TR, LÓPEZ EMDR, GRANADO GL, PÉREZ EA, LÓPEZ RM and GUZMÁN JMS (2008) The water hyacinth, Eichhornia crassipes: an invasive plant in the Guadiana River Basin (Spain). Aquat. Invasions 3 (1) 42-53. https://doi.org/10.3391/ai.20083.L8 [ Links ]
SHADMANI M, MAROFI S and ROKNIAN M (2012) Trend analysis in reference evapotranspiration using Mann-Kendall and Spearman's Rho tests in arid regions of Iran. Water Resour. Manage. 26 (1) 211-224. https://doi.org/10.1007/s11269-011-9913-z [ Links ]
SHEKEDE MD, KUSANGAYA S and SCHMIDT K (2008) Spatio-temporal variations of aquatic weeds abundance and coverage in Lake Chivero, Zimbabwe. Phys. Chem. Earth 33 (8-13) 714-721. https://doi.org/10.1016/j.pce.2008.06.052 [ Links ]
SUSILOWATI Y (1995) Digital image processing, remote sensing and GIS applications :the relationship and the advantages. The Programme Seminar on the Integration of Remote Sensing and GIS for Applications in South East Asia. Universiti Teknologi Malaysia. https://doi.org/10.1016/0924-2716(95)90013-6 [ Links ]
TOUTIN T (2003) Geometric correction of remotely sensed images. In: Wulder MA and Franklin SE (eds) Remote Sensing of Forest Environments. Springer, Boston, MA. https://doi.org/10.1007/978-1-4615-0306-4_6 [ Links ]
THAMAGA KH and DUBE T (2018) Remote sensing of invasive water hyacinth (Eichhornia crassipes): A review on applications and challenges. Remote Sens. Appl. Soc. Environ. 10 36-46. https://doi.org/10.1016/j.rsase.2018.02.005 [ Links ]
UTETE B, PHIRI C, MLAMBO SS, MUBOKO N and FREGENE BT (2018) Fish catches, and the influence of climatic and non-climatic factors in Lakes Chivero and Manyame, Zimbabwe. Cogent Food Agric. 4 (1) 1435018. https://doi.org/10.1080/23311932.2018.1435018 [ Links ]
VILLAMAGNA AM and MURPHY BR (2010) Ecological and socioeconomic impacts of invasive water hyacinth (Eichhornia crassipes): A review. Freshwater Biol. 55 (2) 282-298. https://doi.org/10.1111/j.1365-2427.2009.02294.x [ Links ]
YANG XE, WU X, HAO HL and HE ZL (2008) Mechanisms and assessment of water eutrophication. J. Zhejiang Univ. Sci. B 9 (3) 197-209. [ Links ]
 Correspondence:
Munyaradzi Davis Shekede
Email: shekede@gmail.com
Received: 9 September 2021
Accepted: 21 November 2022

