


Services on Demand
Article
 English (pdf)
 Article in xml format
 Article references
Indicators

Related links
-
 Cited by Google
 -
 Similars in Google
Share

 Permalink
Water SA
On-line version ISSN 1816-7950
Print version ISSN 0378-4738
Water SA vol.49 n.1 Pretoria Jan. 2023
http://dx.doi.org/10.17159/wsa/2023.v49.i1.3985
RESEARCH PAPER
The potential of decentralised wastewater treatment in urban and rural sanitation in South Africa: lessons learnt from a demonstration-scale DEWATS within the eThekwini Municipality
Preyan ArumugamI; Lungiswa ZumaII; Susan MercerI; Lloyd GovenderIII; Jonathan PocockI; Christopher J BrouckaertI; Teddy GoundenI
IWater, Sanitation & Hygiene Research & Development Centre, School of Engineering, University of KwaZulu-Natal, Durban 4041, South Africa
IIeThekwini Water and Sanitation, Durban 4000, South Africa
IIIBremen Overseas Research and Development Association, Durban 4001, South Africa
ABSTRACT
The design principles of decentralised wastewater treatment systems (DEWATS) make them a practical sanitation option for municipalities to adopt in fast-growing cities in South Africa. Since 2014, a demonstration-scale DEWATS with a modular design consisting of a settler, anaerobic baffled reactor (ABR), anaerobic filter (AF), vertical down-flow constructed wetland (VFCW) and horizontal flow constructed wetland (HFCW) has been in operation in eThekwini. A performance evaluation after the long-term operation was undertaken in 2019 by comparing the final effluent with national regulatory requirements. Despite limitations in characterising the raw wastewater, a comparison of the settler and final effluent quality indicated high (> 85%) removal efficiencies of total chemical oxygen demand (CODt), ammonium-N (NH4-N) and orthophosphate-P (PO4-P), 75% removal of total suspended solids (TSS) and 83.3% log10 removal of Escherichia coli. Lack of exogenous and endogenous carbon and high dissolved oxygen (DO) concentrations (> 0.5 mg-L-1) inhibited denitrification in the HFCW, resulting in 12.5% of the effluent samples achieving compliance for nitrate-N (NO3-N). Moreover, mixed aggregate media and low residence times in the HFCW may have also contributed to poor NO3-N removal. During the COVID-19 lockdown, an unexpected shutdown and subsequent resumption of flow to the DEWATS indicated a 16-week recovery time based on achieving full nitrification in the HFCW. Although design modifications are necessary for the HFCW, the installation of urine diversion flushing toilets at the household level will reduce the nutrient loading to the DEWATS and potentially achieve fully compliant effluent. Alternatively, the application of two-stage vertical flow constructed wetlands to improve denitrification should also be explored in the South African context. With an improved design, DEWATS has the potential to fill the gap in both urban and rural sanitation in South Africa, where waterborne sanitation is still desired but connections to conventional wastewater treatment works (WWTWs) are not possible.
Keywords: constructed wetlands, DEWATS, decentralised sanitation, rural sanitation, urban sanitation
INTRODUCTION
Service delivery inequality remains evident in South Africa, spawned by the legacies of apartheid (Sutherland et al., 2014). Compounded by rapid, uncontrolled urbanisation, population growth and circular migratory patterns in fast-growing metropolitan cities like eThekwini (Durban), the increasing prevalence of informal settlements within the urban periphery has left municipalities with limited resources to meet the demand of servicing these communities (eThekwini Municipality, 2021). This leads to backlogs in basic service delivery such as water and sanitation.
Sanitation statistics in South Africa indicate that 84.1% of the population have access to improved sanitation, defined as either a flush toilet connected to either a sewer, septic tank, or conservancy tank or a ventilated improved pit latrine (Stats SA, 2022). Reaching the remaining 16% appears to be the most problematic, largely due to informal settlements becoming more numerous and increasingly dense within urban and peri-urban edges (eThekwini Municipality, 2021). There is a strong aspiration for waterborne sanitation and, although not sustainable in a water-challenged country like South Africa, municipalities are pressurised to provide flushing toilets which are historically associated with wealth and dignity (Gounden et al., 2006). This is exacerbated by the fact that dry sanitation is not always acceptable to the user, with complaints of clogging and odour issues (Roma et al., 2013). As a provisional measure, approximately half of the informal settlements within the eThekwini Municipality are provided with flushing toilets, showers and washing basins in the form of community ablution blocks that are connected to the central sewer network or an alternative system (eThekwini Municipality, 2021).
Mirroring sanitation delays are housing backlogs. A new directive within the eThekwini Municipality favours in-situ formal housing upgrades of informal settlements over identifying new plots and relocating communities (eThekwini Municipality, 2021). However, even if these developments are serviced with water-efficient toilets, ageing infrastructure at conventional centralised wastewater treatment works (WWTWs) means that they cannot cope with the increased hydraulic loading. Even if WWTWs are upgraded, challenges such as cable theft render these systems inoperable for unexpected periods (DWS, 2022). Moreover, according to the latest Green Drop Report, only 23 out of 995 WWTWs evaluated achieved Green Drop certification (cumulative score of > 90%, for which effluent quality forms 30% of the evaluation score) (DWS, 2022). Even the Joint Monitoring Programme, which provides the indicators for achieving the United Nation's Sustainable Development Goals (SDGs), has no data regarding the proportion of the South African population who have access to safely managed sanitation services, i.e. full treatment and safe disposal or reuse of generated domestic wastewater (WHO and UNICEF, 2021). Thus, there is an urgent need to look at alternative, affordable, practical, and sustainable sanitation solutions.
The benefits of decentralised wastewater treatment systems (DEWATS) are well known (Singh et al., 2009; Kerstens et al., 2012; Reynaud, 2014). To date, DEWATS have been designed and implemented in many developing countries by nongovernmental organisations such as the Bremen Overseas Research and Development Association (BORDA) (Sasse, 1998; Gutterer et al., 2009). Unlike central WWTWs that require high energy for operation and chemicals for treatment, DEWATS use biological and physical processes via simple technologies in a modular design. The gravitational flow to these systems allows them to operate without pump stations, making them a lower-cost option where waterborne sanitation is needed (Singh et al., 2009; Singh et al., 2019). Moreover, after the primary (settler) and secondary treatment (anaerobic baffled reactor and anaerobic filter), the nutrient-rich anaerobically treated effluent can be suitable for agriculture provided that there is significant removal of pathogens (Gutterer et al., 2009). This is appropriate for social housing developments where the treated effluent can be reused for irrigating gardens (for aesthetic purposes/ornamental crops) or rerouted back to households for reuse in flushing. It can also be incorporated into school sanitation planning where waterborne sanitation is provided but connections to the centralised sewer network are not practical.
The National Sanitation Policy encourages the use of decentralised sanitation systems in South Africa (DWS, 2016) but, as of 2022, implementation of DEWATS on a community scale is limited to only a single demonstration-scale system. The purpose of this system was to test the feasibility of decentralised sanitation for communities within the eThekwini Municipality. Commissioned in 2010 and fully operational in 2014, the demonstration-scale DEWATS, based on BORDA design principles (Sasse, 1998; Gutterer et al., 2009), treats raw wastewater generated from 84 households.
Originally, the eThekwini Municipality purposed this DEWATS for integration with agricultural reuse of the effluent from the anaerobic filter (herein referred to as the AF effluent). The results of several field trials have been documented for a variety of crops (Musazura et al., 2015; Odindo et al., 2016). However, a recent study by Musazura and Odindo (2021) highlighted that the high nutrient loading in the AF effluent can result in delayed flowering and uneven ripening for maize crops, while pathogen (Escherichia coli) contamination was possible with overhead irrigation of leafy vegetables such as cabbage and lettuce. The authors recommended dilution of the AF effluent or further treatment to deactivate the pathogens which may be present (Musazura and Odindo, 2021).
Tertiary treatment in constructed wetlands can provide effluent that is safe for discharge to a water source. Constructed wetlands (CWs) are a common treatment option in DEWATS due to their buffering capacity to filter suspended solids and biologically reduce the nutrient content (especially nitrogen) through microbial degradation (nitrification/denitrification) and plant assimilation (Kadlec and Wallace, 2009; Vymazal, 2010; Stefanakis et al., 2014). Nitrification requires aerobic conditions since it is an oxidative process, while denitrification occurs in anoxic conditions (i.e., in the presence of nitrate but in the absence of oxygen) (Lee et al., 2009; Saeed and Sun, 2012). The application of DEWATS with CWs is beneficial for informal settlement upgrades where space limitation precludes the reuse of the treated effluent for agriculture. Although using similar technologies with a modular design, it must be noted that DEWATS, in the South African context, are not classified as package plants, which require electrical energy and chemicals to augment biological treatment (Van Niekerk et al., 2009).
Performance evaluations of the primary and secondary treatment modules of the demonstration-scale DEWATS have been conducted (Pillay et al., 2018) and, more recently, an investigation into the treatment efficiency of the CWs after design upgrades to improve performance (Arumugam and Buckley, 2020). However, an assessment of the DEWATS in its entirety after the long-term operation is necessary if this design is to be integrated into scenarios where compliance with the Department of Water Affairs' (now the Department of Water and Sanitation) Revised General Authorisation (GA) limits (DWA, 2013) is needed for safe discharge of the final effluent into a water source. Therefore, this study aimed to evaluate the demonstration-scale system after continuous operation without any long-term disturbances in flow, by comparing the final effluent quality to the GA limits. In addition, during the 2020 national COVID-19 lockdown Levels 4 and 5, access to the site was restricted halting all maintenance activities. Consequently, the DEWATS received no flow for 162 days due to a blockage upstream. This unplanned shutdown of the system provided an opportunity to assess the recovery time ofthe DEWATS (referred to as operability following long-term shutdown).
METHODS
Description of the eThekwini demonstration-scale DEWATS
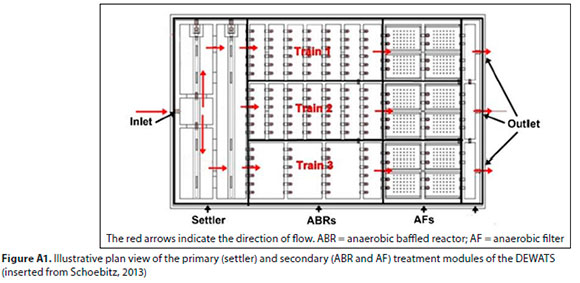
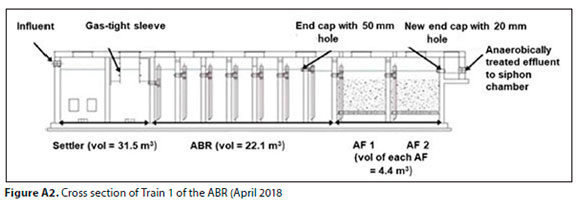
The DEWATS is located in a community in Newlands East, north of central Durban (KwaZulu-Natal, South Africa). The design daily flow is 41.6 m3-d-1 based on an estimated 5 persons per household (HH) and 10% reserve (Pillay et al., 2018). As the DEWATS uses a modular design, raw domestic wastewater initially flows into a two-chamber settler with a volume of 31.5 m3 for primary treatment via sedimentation and flotation. The organic material from the settler effluent is then degraded through three parallel anaerobic baffled reactor (ABR) trains (Figs 1 and A1, Appendix), with each train having a volume of 22.05 m3. Considering that this DEWATS was constructed for research purposes, the only reason for three parallel trains was to test the performance of the ABR under different hydraulic loading rates. Trains 1 and 2 are identical, consisting of 7 equal-sized chambers. Train 3 was constructed with 4 chambers; the first three being twice the size of a single chamber in Trains 1 and 2 (Foxon et al., 2006). The baffles within the ABR chambers force the wastewater to travel up and down, further settling the biomass and allowing the suspended and soluble solids to be degraded. A two-chamber anaerobic filter (AF) with gravel media allows for the attachment of microbial biomass responsible for the further anaerobic treatment of the ABR effluent. The AF of each train has a total volume of 26.66 m3 (Fig. A2, Appendix). Successive treatment in the ABR and AF forms the secondary treatment modules which can remove up to 90% of the biodegradable chemical oxygen demand (bCOD) resulting in nutrient-rich AF effluent (high in ammonium-N concentration and low in total COD (CODt) compared to the influent) (BORDA, 2017; Truyens et al., 2018).
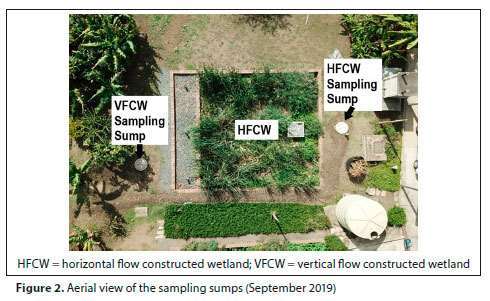
The AF effluent from Train 1 is further treated in a hybrid subsurface flow constructed wetland (CW) system consisting of a single vertical down-flow CW (VFCW) and a single horizontal flow CW (HFCW) (Fig. 1). The purpose of the serial CW design was to promote the conditions necessary for nitrification in the VFCW and subsequent denitrification in the HFCW
The remaining AF effluent from Trains 2 and 3 are used for irrigation trials conducted on-site or directed back to the main sewer line. The CW system was designed for a flow of 13.9 m3,d-1 on the assumption that each train would receive a third of the daily flow.
A low-capacity siphon doses the VFCW to allow for intermittent feeding as per the design of this type of CWs with an average volume of 1.87 m3Mose-1. The area of the VFCW is 96 m2 (9.8 m x 9.8 m; l x b) and 0.75 m in depth with a design hydraulic loading rate (HLR) of 0.14 m-d-1. The original design depth of the VFCW was 1.5 m; however, this was limited to 0.75 m to maintain the hydraulic gradient for gravitational flow to the next treatment module. The 0.55 m filter layer includes well-graded (Cu = 4.64) unwashed river sand (D10, = 0.4 mm) over a 0.15 m drainage layer consisting of 4-25 mm coarse gravel (D10 = 4.4 mm). A thin layer (~ 0.05 m) of coarse sand to fine gravel (0.5-2 mm) was added to the surface of the VFCW and compacted to cause temporal surface water accumulation (flooding), thus improving the hydraulic retention time within the CW. The distribution system consists of eight 75 mm (dia.) pipes with alternate perforations on the sides of the pipe (i.e., not in pairs). The VFCW is planted with Cyperus sexangularis and Typha capensis (5-6 plants-m-2) (Arumugam and Buckley, 2020). A double layer of impermeable lining acts as a liner at the bottom of the bed to prevent groundwater contamination.
The treated VFCW effluent flows continuously to the HFCW which has a surface area of 66 m2 (8.1 m x 8.15 m; l x b) and a depth of 0.9 m. The media consists of 50-80 mm gravel stones at the inlet. The filter media in the middle of the HFCW consists of irregular-shaped mixed gravel of 8-20 mm and 25-80 mm aggregates/broken stones in a ratio of 5:1. The HFCW is permanently impounded to maintain the saturation level at 0.15 m below the surface of the bed (Arumugam and Buckley, 2020). The discharge from the HFCW is piped by gravitated flow to the trunk sewer so that none of the treated effluent is released into the immediate environment (field or river). The HFCW is also planted with C. sexangularis and T. capensis (5-6 plants-m-2).
Both CWs have sampling sumps with a working volume of 440 L at the outflow line for composite sampling as represented in Fig. 2.
Other installations
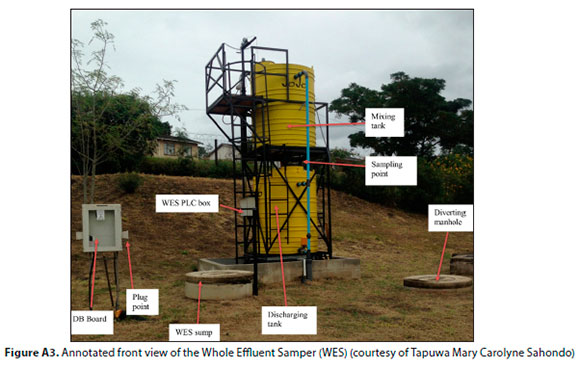
For raw wastewater (influent) characterisation, a whole effluent sampler (WES) was installed upstream of the DEWATS in early 2019 (Fig. A3, Appendix). The function of the WES is to collect flow-proportional composite samples from a known volume of well-mixed influent, and then discharge this sampled volume back into the DEWATS. The volume of wastewater sampled is from households only, with no additional streams (like stormwater or industrial wastewater) that could potentially have different characteristics to the volume sampled, and is thus representative of the incoming raw wastewater at a specific time. Raw wastewater characterisation aids in the design and planning activities of wastewater treatment plants, particularly DEWATS.
Operation and maintenance - descumming
Scum removal is an operational requirement for DEWATS to prevent accumulation that may lead to blockages in the primary and secondary treatment modules. For this study, descumming was increased from once to twice a week to reduce the time for scum accumulation in the settling chambers, thus making removal easier and requiring only one trained personnel. The liquid and solid fractions of the scum were removed manually using a bucket and spade during continuous operation (i.e., with no long-term disturbances in flow) from the settler and the first ABR chamber of each train and quantified at the WASH R&D Centre laboratory at the University of KwaZulu-Natal (UKZN).
Sampling
Flow measurements
An electromagnetic flow meter (SAFMAG) installed in the sump following the AF of each train records the flow rate to produce the cumulative daily flow. This data is logged in 10-min intervals using an Omniflex Teleterm M3e Data logger. A pressure transducer (dipperLog Nano b, Heron Instruments Inc.) was installed inside the siphon chamber to record the discharge rate per dose.
Scum characterisation
Since the scum characterisation was not a focus of this study, the scum from a single descumming event was collected during normal operation, physically sorted and evaluated to determine the chemical and physical constituents for information purposes with no influence on the performance evaluation of the DEWATS.
Wastewater and effluent
Sampling under continuous operation was carried out over 16 weeks starting in February 2019. Based on the cumulative daily flow averaging 14.9 m3-d-1 and the volume of each component of the DEWATS, a sampling interval timeline was generated based on the calculated residence time in each module. Three 1 L grab samples (30 s intervals between each) were taken from the settler at the start of each week. Three grab samples of the ABR and AF effluent were taken from the 7th chamber of the ABR and the siphon chamber at 1.5 and 3.5 days after the settler samples, respectively, also in 30 s intervals. As individual samples were taken, these are not referred to as replicates.
On the 5th day of each week, composite samples were taken from the CW sampling sumps. Based on the average dose volume of the siphon at 1.87 m3, and the working volume of the sump at 398 L, it was predicted that the entire drainage volume from a single dose will fill up the CW sampling sump 4.7 times. For each fill of the sump, three 1 L samples were taken (with 30 s intervals between each sample). Each of these samples was referred to as a 'sub-composite sample. The first sub-composite sample from Fill 1 was mixed with the first sub-composite sample from Fill 2, and so on. Likewise, the second and third composite samples from Fill 1 were mixed with the second and third sub-composite samples from Fill 2, respectively, and this continued until all fills were sampled. Thus, there were three final composite samples for analysis. Considering the diurnal flow rate of the DEWATS, these final composite samples were not regarded as true replicates and were analysed as individual samples. Both CWs could not be sampled consecutively (i.e., on the same day), due to the fill and drain mechanism of the sump that caused a pulsing feed to the HFCW which differed from its operational design for continuous flow (Kadlec and Wallace, 2009). As a result, there were 8 sampling events per CW over the 16 weeks with all other grab samples taken weekly.
The recovery performance evaluation was carried out in September and December 2020 when maintenance activities resumed after the COVID-19 lockdown, and the upstream blockage could be cleared. The recovery time was based on the time taken for the DEWATS to achieve full nitrification (i.e. nearly all of the NH4-N concentration oxidised to NO3-N). Only the final effluent quality (HFCW effluent) was analysed with a single composite sample taken per sampling event (i.e., not in 30 s intervals as per the sampling during continuous operation). Sampling began in Week 3, following the resumption of flow. However, heavier lockdown restrictions disrupted sampling and samples were taken only on Weeks 3, 6, 7, 8, 10 and 16, totalling 6 sampling events.
Chemical and microbial analyses
A Jenway 3540 pH & conductivity meter was used to measure pH and electrical conductivity (EC). Dissolved oxygen (DO) was measured using a BOECO - DO-580 handheld meter. Total COD (CODt) ammonium-N (NH4-N), nitrate-N (NO3-N) and total nitrogen (TN) and orthophosphate-P (PO4-P) were measured with a Merck NOVA 60 Spectroquant. To estimate the biodegradable COD (bCOD) concentration (both soluble and particulate fractions), the oxygen uptake rate (OUR) was measured using a BM-Evo Respirometer.
All determinants measured with the Spectroquant were prepared and analysed according to the standard operating procedure (SOP) supplied with the test kit supplied by Merck. Total suspended solids (TSS) were measured according to Standard Methods (2540 D) (APHA, 2017). All samples, except for CODt and TN, were filtered (using a Whatman 1.2 μm pore size filter paper) and the filtrate was prepared for analysis to avoid interference by the TSS concentration in the measurement by the spectrophotometer. Indicator bacteria, E. coli colony counts only, were measured using the Merck Petrifilm 3M plate and recorded as colony-forming units (CFU)-mL-1 converted to CFU-100 mL-1. All analyses, except for the bCOD, were carried out in the on-site laboratory where the DEWATS is situated. The bCOD fraction was measured at the WASH R&D Centre laboratory, University of KwaZulu-Natal.
Data analysis
Loading rate
The organic, nutrient and pathogen loading to each module was calculated using Eq. 1:
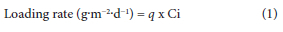
where q is the hydraulic loading rate (m-d-1); Ci is the concentration of the settler effluent (mg-L-1).
Performance of each module
The performance of each module of the DEWATS was measured by the removal efficiency and mass removal rate of the suspended solids, organic and nutrient content in the settler effluent.
Removal efficiency
The percentage removal (removal efficiency) of each pollutant was measured by Eq. 2.
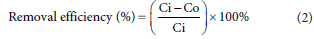
where Ci is the concentration of the settler effluent (mg-L-1) and Co is the concentration of the effluent from each respective module (mg-L-1).
Mass removal rate
The mass removal rate of organic and nutrient content was calculated by Eq. 3:

where q is the hydraulic loading rate (m- d-1); Ci is the concentration of the settler (mg-L-1) and Co is the concentration of the effluent from each respective module (mg-L-1).
Comparison of the final effluent quality in relation to the General Authorisations
The % of samples achieving compliance was measured using Eq. 4.

where n is the number of CW effluent samples that were equal to or below the General Authorisations (discharge) limit for that parameter and n (tot) is the total number of samples analysed.
RESULTS AND DISCUSSION
Performance under continuous operation
Influent characterisation
Unfortunately, accumulated grit seized the macerating pump inside the WES, thus delaying its commissioning and field use at the beginning of the 2019 (continuous operation) sampling campaign. Thus, influent characterisation was not possible.
Hydraulic loading
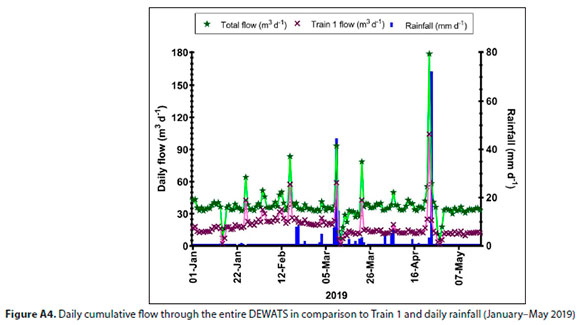
The flow through Train 1, feeding the CW system, ranged from 1.7-104.4 m3-d-1 with an average flow of 17.7 m3-d-1 during January-May 2019. Low flows were experienced during blockages upstream of the DEWATS, while high flows occurred during holidays and heavy rainfall periods (Fig. A4, Appendix).
Based on the data from the pressure transducer inside the siphon chamber, the average siphon dose was discharged over 208 s. The dosing rate to the VFCW per dose was 0.53 m3-min-1, while the cumulative daily flow to the VFCW was 15.6 m3-d-1. This equated to an HLR of 0.16 m-d-1, higher than the design HLR of 0.14 m-d-1. The slight difference in the cumulative daily flow in Train 1 and flow entering the hybrid CW system was due to the pressure transducer measurements being read between 00:00 and 23:59 and based only on the volume discharged during each dose over 24 h whereas the SAFMAG flow meter installed after the AF records the flow rate every 10 min.
Scum
The density of scum removed ranged from 1 305-1 616.8 kg-m-3 across the three ABR trains with the highest density removed from Train 1 (Table A1). The higher scum density in Train 1 is assumed to be because Train 1 received the majority of the flow over the monitoring period in relation to the total flow into the DEWATS (Fig. A4, Appendix). The depth of the scum layer was approximately 0.05 m, covering most of the outlet pipes of the settling chambers.
The solid material was composed of menstrual material, nappies, plastics, and occasionally asphalt. Despite increasing the descumming frequency to twice a week during the sampling campaigns, it is recommended that descumming occurs once a week to limit the effect of scum accumulation on operation and the risk of downtime. However, for future DEWATS applications, grit chambers or screens need to be installed upstream of DEWATS as a preventative measure.
Settler effluent characterisation
The effluent quality of each module over the monitoring period is given in Table 1. For the calculation of loading and mass removal rates, the HLR of 0.16 m-d-1 was used. The average CODt concentration in the settler was 927 ± 345.2 mg-L-1, equating to a loading rate of 148.3 gCODt-m-2-d-1. The bCOD (soluble and particulate fractions) was estimated to be 760 mg-L-1 from the OUR analysis (Table A2). Nutrient loading, measured only by total nitrogen, was 11.8 gN-m-2-d-1. The average E. coli colony count was 1.1 x 10⁶ (± 8.9 x 10⁵) CFU-100 mL-1. Since it is expected that primary treatment via sedimentation and flotation would have already occurred in the settler before sampling, this is not a true representation of the raw wastewater characterisation.
Organic removal
The cumulative removal efficiencies of CODt from the settler effluent were 22.1%, 61.4%, 94.2% and 95.9% after the ABR, AF, VFCW and HFCW, respectively (Table 1). Removal of the bCOD fraction was 15.3% after the ABR and 63.9% after the combination of the primary and secondary treatment modules. The overall mass removal rate of CODt was 142.2 gCODt-m-2-d-1 based on the final effluent quality. The absence of bCOD from the VFCW effluent and HFCW effluent implies that all of the available bCOD in the AF effluent was oxidised in the VFCW. Moreover, it would imply no bCOD as a carbon source for denitrification in the HFCW (Table A2).
Nutrient removal
The major nitrogen fraction after primary and secondary treatment is ammonium-N (85.2% of the total nitrogen concentration) with an average concentration of 52 (± 12) mg-L-1 in the AF effluent. The cumulative removal efficiencies of NH4-N were 91.7% and 98.1% after the VFCW and HFCW, respectively. Like CODt degradation, the majority of NH4-N transformation occurs in the VFCW, which was expected since both processes are oxygen dependent. However, the impact of the absence of bCOD in the VFCW effluent on denitrification is evident by the poor nitrate-N (NO3-N) removal in the HFCW, where only 9.5% of NO3-N concentration was reduced. Moreover, the DO concentration in the VFCW effluent ranged from 1.7-2.9 mg-L-1 and 1.3-2.5 mg-L-1 in the HFCW effluent. Bertino (2010) found that denitrification occurs in low DO concentrations, but not above 0.3-0.5 mg-L-1. Above this DO concentration, denitrifying bacteria utilise oxygen instead of NO3-N as the terminal electron acceptor in their respiration (Bertino, 2010). The cumulative total nitrogen removal efficiency from the settler was 6.5%, 17.1%, 33.4% and 48.5% after the ABR, AF, VFCW and HFCW, respectively. Overall, the mass removal rate of total nitrogen was 5.7 gN-m-2-d-1.
The average orthophosphate (PO4-P) concentration was 8.3 (± 3.4) mg-L-1 in the AF effluent and 3.1 (± 1.3) mg-L-1 after the HFCW, equating to an overall removal efficiency of 62.7% (Table 1).
Pathogen removal
The level of indicator faecal coliforms, E. coli, in the settler effluent was 1.1 x 10⁶ (± 8.9 x 10⁵) CFU-100 mL-1, with an overall log10 removal of 3.34 after final treatment in the HFCW. Despite the VFCW being responsible for the majority of the organic and nutrient removal, pathogen removal was greater after the HFCW with die-off suspected to be the main removal process. The final effluent contained 508 (± 854) CFU-100 mL-1 of E. coli (Table 1).
Compliance with the General Authorisations
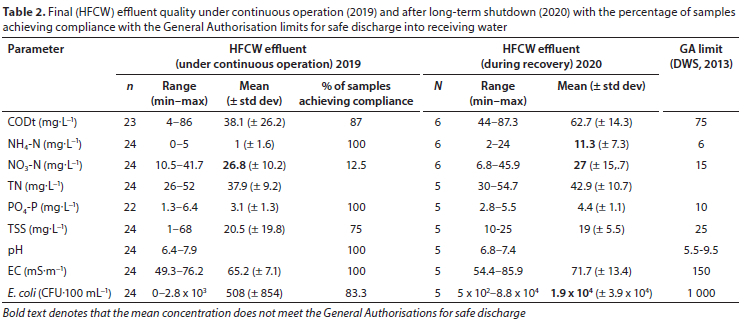
For the duration of the 16-week sampling campaign, > 85% of the final effluent samples (n = 8) were compliant with the GA limits for discharge for organics (CODt), ammonium-N (NH4-N), orthophosphate-P (PO4-P), pH and electrical conductivity (EC). The number of samples compliant with faecal coliforms (E. coli) and TSS was 83.3 and 75%, respectively. Only 12.5% of samples were compliant with nitrate-N (NO3-N) (Table 2). The action of the pump in the sampling sumps resulted in suspended matter from the walls of the sump interfering with actual TSS concentration in the drainage from each CW. Therefore, the actual TSS in the CW effluent is suspected to be much lower than indicated and perhaps ranging below the GA limit of 25 mg-L-1 in both CW effluents (Table 2).
Performance after the resumption of operation
Flow monitoring
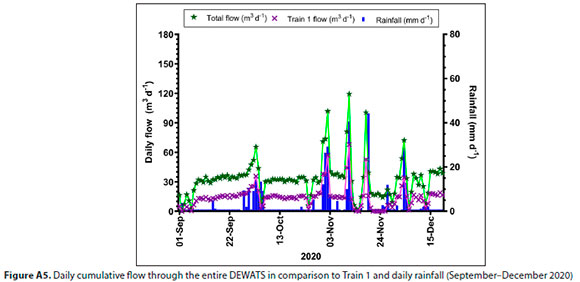
After the removal of the blockage (when site access returned), flow to the DEWATS resumed in September 2020, after a period of 162 days. Flow through Train 1 ranged from 0-67.92 m3-d-1 with an average flow of 14.4 m3-d-1 from September to December 2020. As with continuous operating conditions, low flows were attributed to blockages upstream of the DEWATS while high flows correlated with high rainfall events. Overall, the CWs operated above the design HLR for 60% of the recovery period (Fig. A5, Appendix).
Recovery
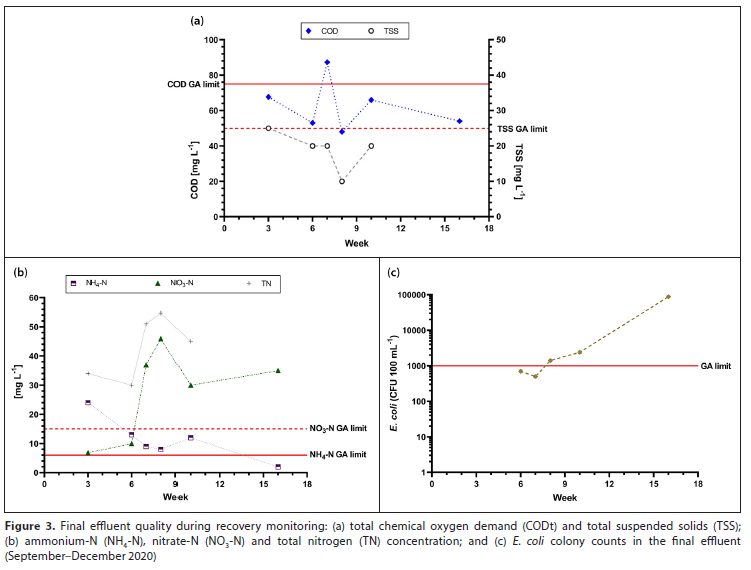
After the resumption of flow to the DEWATS, CODt concentration was predominantly below the GA limit of 75 mg-L-1 ranging from 44-87.3 mg-L-1 (Fig. 3a). The time taken for the NH4-N concentration to reach below the GA limit of 6 mg-L-1 was 16 weeks. The average NH4-N concentration was 11.3 (± 7.3) mg-L-1 (Table 2).
Figure 3b shows a steady decrease in NH4-N concentration from Weeks 1 to 9, fluctuating above the limit in Week 10, but below the GA limit by Week 16. This is due to the start-up of the VFCW, indicating a gradual increase in nitrification over time. Nitrifying bacteria are generally slow-growing bacteria with long generation times (Wang et al., 2012). Nitrate-N concentration ranged from 6.8-45.9 mg-L-1. As with continuous operation, a grab sample of the VFCW effluent indicated no bCOD. Therefore, it was assumed that denitrification was again limited by the lack of available exogenous carbon.
Figure 3c demonstrates colony counts of E. coli which ranged from 5 x 10² to 8.8 x 10⁴ CFU-100 mL-1, the peak seen during the last sampling event (Week 16). All other samples were near the GA limit. It is possible that during the shutdown the bacterial cells were able to accumulate within the CWs and were washed out during the heavier rainfall events toward the latter part of the sampling period.
Based on the comparison of the final effluent quality during continuous operation and operation following the long-term shutdown (162 days), it can be assumed that the recovery time for the system to reach continuous operating conditions is of the order of 16 weeks.
Overall assessment
Under continuous operation, the current design of the eThekwini decentralised wastewater treatment system (DEWATS) does not produce safe discharge quality effluent based on its NO3-N removal capacity (Tables 1 and 2). Denitrification rates are highly dependent on available carbon which provides the electrons required to convert NO3-N to N2 (Saeed and Sun, 2012; Robertson and Groffman, 2015). The lack of bCOD in the VFCW and HFCW effluents implies that complete bCOD oxidation occurred in the VFCW and there was no endogenous carbon in the HFCW. Moreover, it is suspected that the loosely packed, irregular-shaped, mixed gravel in the HFCW contributed to low residence times even after permanently impounding the outlet. Maintaining the saturated level of the wastewater at 0.15 m below the surface of the gravel media resulted in surface water accumulation during peak flows which may have resulted in passive aeration by diffusion of atmospheric oxygen. In this case, since denitrifying bacteria are facultative heterotrophs, oxygen, instead of nitrate, will be used as the preferred electron acceptor when DO concentration is high (Kadlec and Wallace, 2009) contributing to poor NO3-N removal overall (Saeed and Sun, 2012).
Moreover, the reuse of the final effluent will be more suitable for agriculture due to the lower nutrient concentrations and E. coli counts. In fact, with reference to the GA limits, the final effluent quality meets the South African regulatory requirements for reuse agriculture with volumes up to 500 m3-d-1 (DWS, 2013).
Although the estimated recovery time is 16 weeks, it could be potentially shorter as sampling during this time was inhibited by further COVID-19 lockdown restrictions.
RECOMMENDATIONS
To maintain the simple and practical design of DEWATS with its low operating and maintenance principles, it is recommended that the media of the hybrid CW system be amended to improve effluent quality. Two-stage VFCWs have been successfully implemented in Austria for improved total nitrogen removal (Langergraber et al., 2008; Langergraber et al., 2009; Langergraber et al., 2014). In the first stage, a 0.5 m filter layer with 2-3.2 mm sand was used which was found to restrict full nitrification of the influent (approximately 80% nitrification was observed) and the complete mineralization of the organic matter (OM). Based on this observation, the filter media of the VFCW in the hybrid CW system can be amended to 2-3 mm to limit the full oxidation of the bCOD from the AF effluent. Moreover, the inclusion of an organic layer (such as dried plant matter or biochar) may provide available endogenous carbon for denitrification towards the bottom of the VFCW and exogenous carbon in the HFCW. Concerning the filter media of the HFCW, Sasse (1998) recommends round gravel of uniform size, preferably between 6-12 mm or 8-16 mm medium gravel, the latter supported by the design recommendations of Langergraber et al. (2019). Lastly, the outlet pipe should be permanently impounded to maintain the saturation level at 0.2 m below the surface of the gravel to prevent diffusion of oxygen into the HFCW and contribute to improved residence times for NO3-N and E. coli removal. However, despite these media amendments, the two-stage VFCW must also be investigated in the South African context.
Other potential technology integrations to improve overall effluent quality
In addition to design modifications to the DEWATS, removing nitrogen at the source provides an opportunity to reduce the nutrient loading, particularly nitrogen, to the DEWATS. European household wastewater characterisation indicates that approximately 75% of the total N load in wastewater streams is derived from urine (Henze, 1997). If urine could be separated from the blackwater and solid fraction, then this will potentially reduce the nitrogen loading to the DEWATS and essentially improve the total nitrogen removal capacity of the CWs in whatever configuration is chosen (hybrid CW system or two-stage VFCW). For example, urine diversion flushing toilets can separate the urine from the faecal matter and flushing water while also allowing for nutrient recovery from the separated urine similar to the Valorisation of Urine Nutrients in Africa (VUNA) project, although the latter was in combination with dry sanitation (urine-diverting dry toilets), within the eThekwini Municipality (Udert et al., 2015).
CONCLUSION
This study evaluated the performance and sustainability of a decentralised approach for community sanitation in South Africa using BORDA design principles. While a comparison of the final effluent quality from the demonstration-scale DEWATS in eThekwini indicates that continuous discharge is not possible, simple design modifications are recommended for the tertiary treatment modules (in this case, a hybrid CW system) to achieve fully compliant effluent for safe discharge. Moreover, the application of the two-stage vertical flow constructed wetland (VFCW) design for improved total nitrogen removal also needs to be explored in the South African context.
However, in line with the reduction of potable water for flushing and the potential of resource recovery from urine on larger scales, a combination of low-flush technologies such as urine diversion flushing toilets can be combined with DEWATS to fast-track sanitation delivery at the community level. The knock-on effect is the reduction in the nutrient loading to the DEWATS so that fully compliant effluent for safe discharge is possible. The combination of these two technological approaches will unblock the service delivery pipeline, attain user aspirations, reduce environmental pollution by recharging receiving waters with compliant effluent, as well as decrease water consumption for flushing and irrigation (if agriculture is desired by the community served). This will contribute to better management of this scarce resource in a drought-prone country like South Africa. Lastly, to ensure the operational reliability and sustainability of the system, social assessments need to be conducted to determine migratory patterns of the community (such as when persons return to their rural homesteads in the case of urban dwellers) and other activities that impact the influent to and hence the operation of the DEWATS.
ACKNOWLEDGEMENTS
This research expands on the project funded by the South African Water Research Commission (WRC Project No. K5/2579: Performance evaluation of constructed wetlands in a BORDA-designed decentralised wastewater treatment system). Field workers Musa Fanifani Mtshali, Hensford Mzimela and Jimson Tanyanyiwa are acknowledged for their assistance during the sampling campaigns while gratitude is given to Travis Kunnen for conducting all chemical analyses.
This paper is dedicated to the memory of the late Prof Chris Buckley who was instrumental in championing the innovative approach to sanitation in South Africa.
AUTHOR CONTRIBUTIONS
PA conceptualised the work, interpreted the data and wrote the first draft of the manuscript. All other authors reviewed and edited the manuscript before submission.
REFERENCES
APHA (2017) 2540 SOLIDS. In: Standard Methods for the Examination of Water and Wastewater. American Public Health Association, Washington, D.C. [ Links ]
ARUMUGAM P and BUCKLEY C (2020) Performance evaluation of constructed wetlands in a BORDA-designed decentralised wastewater treatment system. WRC Report No. TT 812/20. Water Research Commission, Pretoria. [ Links ]
BERTINO A (2010) Study on one-stage partial nitritation-anammox process in moving bed biofilm reactors: a sustainable nitrogen removal. TRITA LWR Degree Project. Masters dissertation, Royal Institute of Technology (KTH) Stockholm. [ Links ]
BORDA (2017) DEWATS implementation by BORDA. Bremen Overseas Research and Development Association, Bremen, Germany. [ Links ]
DWA (Department of Water Affairs, South Africa) (2013) Revision of General Authorisations in Terms of section 39 of the National Water Act (Act No. 36 of 1998) (The Act). Government Notice No. 665, Department of Water Affairs, Pretoria. [ Links ]
DWS (Department of Water and Sanitation, South Africa) (2016) National Sanitation Policy. Department of Water and Sanitation, Pretoria. [ Links ]
DWS (Department of Water and Sanitation, South Africa) (2022) Green Drop National Report 2022. Department of Water and Sanitation, Pretoria. 558 pp. [ Links ]
ETHEKWINI MUNICIPALITY (2021) Integrated Development Plan, 5 Year Plan: 2017/2018 to 2021/2022. 2020/2021 Review. eThekwini Municipality, Durban. 1 008 pp. [ Links ]
FOXON KM, BUCKLEY CA, BROUCKAERT CJ, DAMA P, MTEMBU Z, RODDA N, SMITH M, PILLAY S, ARJUN N, LALBAHADUR T and BUX F (2006) The evaluation of the anaerobic baffled reactor for sanitation in dense periurban settlements. WRC Report No. 1248/01/06. Water Research Commission, Pretoria. [ Links ]
GOUNDEN T, PFAFF B, MACLEOD N and BUCKLEY C (2006) Provision of free sustainable basic sanitation: the Durban experience. In: 32nd WEDC International Conference: Sustainable Development of Water Resources, Water Supply and Environmental Sanitation, 13-17 September 2006, Colombo, Sri Lanka. [ Links ]
GUTTERER B, SASSE L, PANZERBIETER T and RECKERZÜGEL T (2009) Decentralised wastewater treatment systems (DEWATS) and sanitation in developing countries. BORDA, Bremen. [ Links ]
HENZE M (1997) Waste design for households with respect to water, organics and nutrients. Water Sci. Technol. 35 (9) 113-120. https://doi.org/10.2166/wst.1997.0335 [ Links ]
KADLEC RH and WALLACE S (2009) Treatment Wetlands (2nd edn). CRC Press, Boca Raton. https://doi.org/10.1201/9781420012514 [ Links ]
KERSTENS S, LEGOWO H and HENDRA GUPTA I (2012) Evaluation of DEWATS in Java, Indonesia. J. Water Sanit. Hyg. Dev. 2 (4) 254-265. https://doi.org/10.2166/washdev.2012.065 [ Links ]
LANGERGRABER G, DOTRO G, NIVALA J, RIZZO A and STEIN OR (2019) Wetland Technology: Practical Information on the Design and Application of Treatment Wetlands. IWA Publishing, London. https://doi.org/10.2166/9781789060171 [ Links ]
LANGERGRABER G, LEROCH K, PRESSL A, ROHRHOFER R and HABERL R (2008) A two-stage subsurface vertical flow constructed wetland for high-rate nitrogen removal. Water Sci. Technol. 57 (12) 1881-1887. https://doi.org/10.2166/wst.2008.319 [ Links ]
LANGERGRABER G, LEROCH K, PRESSL A, SLEYTR K, ROHRHOFER R and HABERL R (2009) High-rate nitrogen removal in a two-stage subsurface vertical flow constructed wetland. Desalination 246 (1-3) 55-68. https://doi.org/10.1016/j.desal.2008.02.037 [ Links ]
LANGERGRABER G, PRESSL A and HABERL R (2014) Experiences from the full-scale implementation of a new two-stage vertical flow constructed wetland design. Water Sci. Technol. 69 (2) 335-342. https://doi.org/10.2166/wst.2013.708 [ Links ]
LEE CG, FLETCHER TD and SUN G (2009) Nitrogen removal in constructed wetland systems. Eng. Life Sci. 9 (1) 11-22. https://doi.org/10.1002/elsc.200800049 [ Links ]
MUSAZURA W and ODINDO AO (2021) Suitability of the decentralised wastewater treatment effluent for agricultural use: decision support system approach. Water 13 (18) 2454. https://doi.org/10.3390/w13182454 [ Links ]
MUSAZURA W, ODINDO AO, BAME IB and TESFAMARIAM EH (2015) Effect of irrigation with anaerobic baffled reactor effluent on Swiss chard (Beta vulgaris cicla.) yield, nutrient uptake and leaching. J. Water Reuse Desalin. 5 (4) 592-609. https://doi.org/10.2166/wrd.2015.011 [ Links ]
ODINDO A, BAME I, MUSAZURA W, HUGHES J and BUCKLEY C (2016) Integrating agriculture in designing on-site, low cost sanitation technologies in social housing schemes. WRC Report No. TT 700/16. Water Research Commission, Pretoria. [ Links ]
PILLAY S, REYNAUD N, SCHOEBITZ L, PIETRUSCHKA B, SCHMIDT A, FOXON K and BUCKLEY C (2018) Evaluation of the DEWATS process for decentralised wastewater treatment. Volume 2: DEWATS Performance. Deliverable for WRC Project No. K5 2002. Water Research Commission, Pretoria. [ Links ]
REYNAUD N (2014) Operation of Decentralised Wastewater Treatment Systems (DEWATS) under tropical field conditions. PhD thesis, Technical University, Dresden. [ Links ]
ROBERTSON GP and GROFFMAN PM (2015) Chapter 14 - Nitrogen transformations. In: Paul EA (ed.) Soil Microbiology, Ecology and Biochemistry (Fourth Edition). Academic Press, Boston. 421-446. https://doi.org/10.1016/B978-0-12-415955-6.00014-1 [ Links ]
ROMA E, PHILP K, BUCKLEY C, XULU S and SCOTT D (2013) User perceptions of urine diversion dehydration toilets: Experiences from a cross-sectional study in eThekwini Municipality. Water SA 39 302-312. https://doi.org/10.4314/wsa.v39i2.15 [ Links ]
SAEED T and SUN G (2011) A comparative study on the removal of nutrients and organic matter in wetland reactors employing organic media. Chem. Eng. J. 171 439-447. https://doi.org/10.1016/j.cej.2011.03.101 [ Links ]
SAEED T and SUN G (2012) A review on nitrogen and organics removal mechanisms in subsurface flow constructed wetlands: Dependency on environmental parameters, operating conditions and supporting media. J. Environ. Manage. 112 429-448. https://doi.org/10.1016/j.jenvman.2012.08.011 [ Links ]
SASSE L (1998) DEWATS Decentralised Wastewater Treatment in Developing Countries Handbook. Bremen Overseas Research and Development Association, Germany. [ Links ]
SINGH S, HABERL R, MOOG O, SHRESTHA RR, SHRESTHA P and SHRESTHA R (2009) Performance of an anaerobic baffled reactor and hybrid constructed wetland treating high-strength wastewater in Nepal - A model for DEWATS. Ecol. Eng. 35 (5) 654-660. https://doi.org/10.1016/j.ecoleng.2008.10.019 [ Links ]
SINGH A, SAWANT M, KAMBLE SJ, HERLEKAR M, STARKL M, AYMERICH E and KAZMI A (2019) Performance evaluation of a decentralized wastewater treatment system in India. Environ. Sci. Pollut. Res. 26 (21) 21172-21188. https://doi.org/10.1007/s11356-019-05444-z [ Links ]
STATS SA (Statistics South Africa) (2022) General household survey P0318. Statistics South Africa, Pretoria. 81 pp. [ Links ]
STEFANAKIS A, AKRATOS CS and TSIHRINTZIS VA (2014) Vertical Flow Constructed Wetlands: Eco-Engineering Systems for Wastewater and Sludge Treatment. Elsevier, Oxford. https://doi.org/10.1016/B978-0-12-404612-2.00008-8 [ Links ]
SUTHERLAND C, HORDIJK M, LEWIS B, MEYER C and BUTHELEZI S (2014) Water and sanitation provision in eThekwini Municipality: a spatially differentiated approach. Environ. Urbaniz. 26 (2) 469-488. https://doi.org/10.1177/0956247814544871 [ Links ]
TRUYENS C, WILSON D, SCHMIDT A and BUCKLEY C (2018) Paper 18. Bridging the gap between onsite and conventional sanitation: Decentralised Wastewater Treatment Solutions (DEWATS). In: 82nd IMESA (Institute of Municipal Engineering of Southern Africa) Conference, 31 October-2 November 2018, Port Elizabeth. 160-164. [ Links ]
UDERT KM, BUCKLEY CA, WACHTER M, MCARDELL CS, KOHN T, STRANDE L, ZÖLLIG H, FUMASOLI A, OBERSON A and ETTER B (2015) Technologies for the treatment of source-separated urine in the eThekwini Municipality. Water SA 41 212-221. https://doi.org/10.4314/wsa.v41i2.06 [ Links ]
VAN NIEKERK A, SEETAL A, DAMA-FAKIR P, BOYD L and GAYDON P (2009) Guideline report: package plants for the treatment of domestic wastewater. Department of Water Affairs, Pretoria. [ Links ]
VYMAZAL J (2010) Constructed wetlands for wastewater treatment. Water 2 (3) 530. https://doi.org/10.3390/w2030530 [ Links ]
WANG F, LIU Y, WANG J, ZHANG Y and YANG H (2012) Influence of growth manner on nitrifying bacterial communities and nitrification kinetics in three lab-scale bioreactors. J. Ind. Microbiol. Biotechnol. 39 (4) 595-604. https://doi.org/10.1007/s10295-011-1065-x [ Links ]
WHO and UNICEF (2021) Progress on household drinking water, sanitation and hygiene 2000-2020: Five years into the SDGs. WHO and UNICEF, Geneva. [ Links ]
 Correspondence:
Preyan Arumugam
Email: ArumugamNanoolalP@ukzn.ac.za
Received: 9 March 2022
Accepted: 4 January 2023
APPENDIX
During the commissioning phase of the DEWATS, Train 1 was noted to receive the bulk of the flow (50%) due to the outlet pipe of Train 1 of the ABR in the collection chamber being 0.05 m and 0.06 m lower than that of the outlet pipes of Trains 2 and 3, respectively (Fig. A2). An end cap drilled with a hole of 0.05 m was placed on the baffle pipe in the 6th chamber of the ABR to effectively act as a choke to reduce the flow through Train 1 thereby regulating the flow across all three trains. However, Train 1 still received the majority of the daily cumulative flow, and in April 2018 a second end cap with a drilled hole of 0.02 m (dia.) was installed in the outlet pipe of Train 1 leading to the siphon chamber. Subsequent flow measurements through Train 1 indicated a reduction in flow by almost 40% to 15.5 m3-d-1 compared to the pre-insertion of the second end cap.


