


Services on Demand
Article
 English (pdf)
 Article in xml format
 Article references
Indicators

Related links
-
 Cited by Google
 -
 Similars in Google
Share

 Permalink
Water SA
On-line version ISSN 1816-7950
Print version ISSN 0378-4738
Water SA vol.48 n.4 Pretoria Oct. 2022
http://dx.doi.org/10.17159/wsa/2022.v48.i4.3944
RESEARCH PAPER
A preliminary fish survey of the estuaries on the east coast of South Africa, Mpande to Mtentwana: a comparative study
NC JamesI, II; TD HarrisonIII, I
ISouth African Institute for Aquatic Biodiversity, Private Bag 1015, Makhanda, 6140, South Africa
IIInstitute for Coastal and Marine Research, Ocean Sciences Campus, Nelson Mandela University, Port Elizabeth, South Africa
IIIMarine and Fisheries Division, Department of Agriculture, Environment and Rural Affairs, 17 Antrim Rd, Lisburn, BT28 3AL, Northern Ireland
ABSTRACT
A preliminary ichthyofaunal and physico-chemical survey of estuaries on the east coast of South Africa from the Mpande Estuary to the Mtentwana Estuary was undertaken between November 1997 and January 1998. Sixteen estuaries were surveyed along this stretch of coastline and these were grouped into three estuary types: small (< 10 ha) predominantly closed estuaries, moderate to large (> 10 ha) predominantly closed estuaries and predominantly open estuaries. Multivariate analyses revealed significant differences between the three groups in terms of both their physico-chemical characteristics (small predominantly closed estuaries were different from predominantly open estuaries) and their fish communities (all three estuary types were significantly different). The estuaries in the study area fall within the subtropical/warm-temperate transition-zone and north of the subtropical/warm-temperate biogeographic break; tropical species dominated the fish communities of all the estuaries in terms of numbers of species and biomass. This survey represents one of the few fish surveys undertaken along this little-studied section of the coastline.
Keywords: ichthyofauna, estuarine survey, fish habitat, northern Transkei
INTRODUCTION
Research into fish communities in the Eastern Cape Province of South Africa has excluded to a large extent the former Transkei region (Great Kei to Mtamvuna) of the province (Mbande et al., 2005), such that information on most of the smaller systems along this coastline is classified as poor or nonexistent (Whitfield and Baliwe, 2013). This paper focuses on the northern Transkei, which is regarded as a transition zone between the warm-temperate and subtropical biogeographic regions, with the boundary between the warm-temperate and subtropical regions occurring at the Mdumbi Estuary in the southern Transkei (Harrison, 2002). The fish species diversity in South African estuaries decreases from east to west (Harrison, 2002) and, as such, the northern Transkei estuaries are expected to have more species than the estuaries further south (e.g. James and Harrison 2010a; 2010b; 2011; 2016; 2020). As the northern Transkei estuaries are situated north of the biogeographic boundary, estuaries in this region are likely dominated by tropical species with moderate numbers of temperate species.
The fish assemblages of the Mngazana and Mngazi estuaries have been studied seasonally in the 2000s (Mbande et al., 2005). Limited information has been published on the physico-chemical properties of the Msikaba Estuary (Blaber et al. 1973) and the fish fauna of the Msikaba, Mtentu (Blaber, 1977), Mntafufu (Plumstead, 1984; Plumstead et al., 1991) and Mzamba (Plumstead, 1984; Plumstead et al., 1991) estuaries. As part of a national assessment of South African estuaries, a fish survey was undertaken along the east coast between the Mpande and Mtentwana estuaries; basic physico-chemical variables, fish community data and a comparative analysis are provided. Although this survey was conducted more than 20 years ago, this data provides useful baseline information on the fish fauna of this poorly studied region, particularly in the light of climate change-related distribution shifts.
STUDY AREA
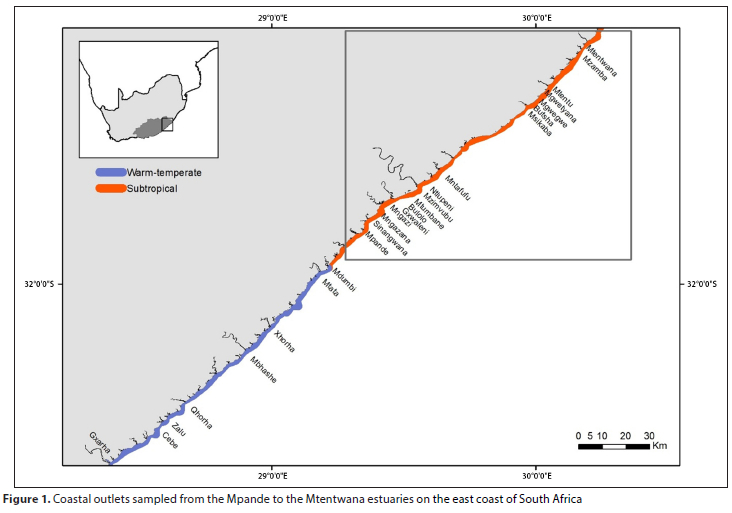
The section of coastline from the Mpande Estuary to the Mtentwana Estuary extends some 114 km and is intersected by 32 river outlets (Fig. 1). The coastline is situated within the subtropical region of the Eastern Cape, and is comprised of steep valleys and gorges (Colloty et al., 2002). Average summer temperatures are around 23°C (Hoppe-Speer et al., 2015) and most of the rainfall is recorded in summer (Landman et al., 2005). The coastline is influenced by the south-flowing Agulhas Current (Shannon, 1989; Heydorn, 1991). Being tropical in origin, the waters of this current are relatively warm; however, as it flows south it tends to cool, with inshore water temperatures along the Eastern Cape coast varying between 17 and 20°C (Smit et al., 2013).
MATERIALS AND METHODS
The estuaries from the Mpande to the Mtentwana were sampled between November 1997 and January 1998. Each system was sampled once and took 1-3 days to survey, depending on the size of the system. Eighteen of the 32 estuaries were accessible for sampling.
Physico-chemical
During each survey, selected physico-chemical parameters were measured at various sites within each system ranging from the mouth area (Site 1) upstream; the number of sites varied depending on the size of each system. Water depth and transparency were measured using a 20 cm diameter Secchi disc attached to a weighted shot line graduated at 10 cm intervals. Temperature (°C), salinity (psu), pH, dissolved oxygen (mg-L-1), and turbidity (NTU) were measured using a Horiba U-10 Water Quality Checker. Where water depth permitted (usually >0.5 m), both surface and bottom waters were measured. The mouth state of each system at the time of sampling was also noted.
Ichthyofauna
The ichthyofauna of each estuary was sampled using a 30 m long x 1.7 m deep x 15 mm bar mesh seine net fitted with a 5 mm bar mesh purse, and a fleet of multi-mesh gill nets. The gill nets were either 10 m or 20 m in length and 1.7 m in depth and consisted of three equal sections of 45 mm, 75 mm and 100 mm stretch meshes. Seine netting was carried out during daylight hours in shallow (< 1.5 m deep), unobstructed areas with gently sloping banks. Fish caught were identified and measured to the nearest millimetre standard length (SL) before being released. Where large catches of a species were made, a sub-sample was kept and returned to the laboratory where the fish were identified, measured and weighed to the nearest 1.0 g; specimens that could not be identified in the field were also kept and processed in the laboratory. All fishes were identified by reference to Smith and Heemstra (1991) and Skelton (1993); taxonomic identities of certain species were adjusted using information provided in Whitfield (2019). The total fish species composition, by number and mass, was calculated for each system. The relative biomass contribution of each species was calculated using actual recorded masses as well as masses derived from length-mass relationships provided in Harrison (2001). Fishes were also classified according to their biogeographic affinity (endemic/temperate, temperate, tropical, widespread) and the contribution of each group calculated for each estuary based on the number of species, abundance, and biomass.
Estuary classification
Estuaries were divided into two main groups on the basis of predominant mouth condition, according to the classification given in Harrison and Whitfield (2006a). The two main groups were predominantly open estuaries and predominantly closed estuaries. Predominantly closed estuaries were further sub-divided into two groups based on surface area: small closed estuaries with a surface area below 10 ha and moderate to large closed estuaries with a surface area above 10 ha.
Multivariate analyses
Data were analysed using the Plymouth Routines in Multivariate Ecological Research (PRIMER) package (version 6.0) (PRIMER-E, Plymouth Marine Laboratory, UK). A principal component analysis (PCA) was undertaken on the overall mean (surface and bottom) values of the physico-chemical variables recorded in each system. Each parameter was first examined for normality; turbidity required log-transformation (ln[1 + x]). The data were also examined for any inter-correlations (Pearson r); pH exhibited significant correlations with both dissolved oxygen and salinity and was omitted from the analysis. Temperature and depth also showed a significant correlation, however, these parameters were retained in the analysis. A PCA was performed based on the following normalised parameters: depth, temperature, salinity, dissolved oxygen, and turbidity. An analysis of similarities (ANOSIM) was also undertaken (using the normalised Euclidean distance similarity measure) to test for significant differences between estuarine types.
Specimens not identified to species level (e.g. Mugilidae) as well as exotic species (e.g. Micropterus spp.) were excluded from the analysis. Abundance and biomass data were first standardised and then square-root transformed before calculating a Bray-Curtis similarity matrix. Standardisation removed the effect of variable sampling while transformation scales down the importance of dominant species (Field et al., 1982; Clarke and Warwick, 2001). An analysis of similarities (ANOSIM) was undertaken (using the Bray-Curtis similarity measure) to test for significant differences between estuarine types. A similarity percentages analyses (SIMPER) was also undertaken to identify species that characterise estuary types as well as those that discriminate between estuary types.
RESULTS
A total of 18 systems were sampled from the Mpande to the Mtentwana estuaries. Two systems, (Gxwaleni and Nkodusweni) comprised small coastal streams and were not considered further. Of the remaining systems, eight were predominantly open estuaries and eight were predominantly closed estuaries. Of the predominantly closed estuaries, four (Mpande, Bulolo, Mtumbane and Mtentwana) were moderate to large (>10 ha) systems and four (Ntlupeni, Butsha, Mgwegwe and Mgwetyana) were small (<10 ha) systems.
Physico-chemical
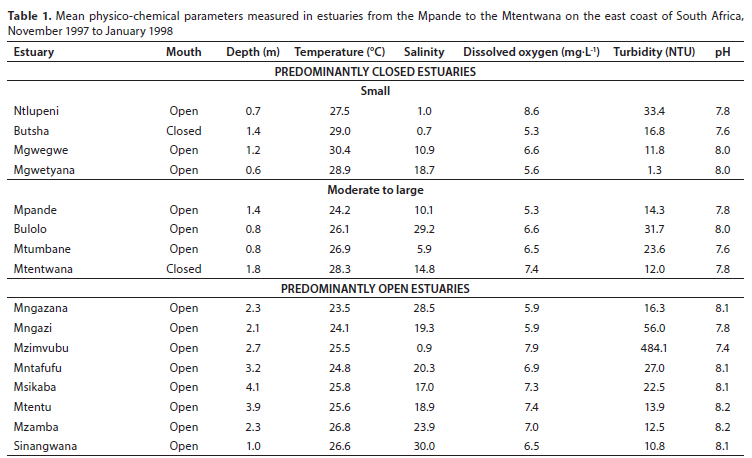
Small predominantly closed estuaries
The small predominantly closed systems were open at the time of sampling, with the exception of the Butsha estuary. All estuaries were relatively shallow, with average water depths not exceeding 1.4 m (Table 1). Mean water temperatures were high in the four small predominantly closed estuaries and ranged between 27.5°C (Ntlupeni) and 30.4°C (Mgwegwe). Mean salinities were almost fresh (0.7-1.0) in the small Butsha and Ntlupeni estuaries and 10.9 in the Mgwegwe and 18.7 in the Mgwetyana. Salinities were fairly uniform throughout most of the systems with no clear horizontal gradients. The Mgwetyana, however, exhibited a reverse salinity gradient, with surface salinity increasing from 11.0 in the lower reaches to 14.0 in the upper reaches. A vertical salinity gradient was evident in the Mgwegwe and Mgwetyana estuaries. Average dissolved oxygen values ranged between 5.3 mg-L-1 (Butsha) and 8.6 mg-L-1 (Ntlupeni). The small predominantly closed estuaries were fairly clear systems, with mean turbidity <34.0 NTU. Average pH values were between 7.6 and 8.0 (Table 1). Physico-chemical parameters by site are given in Table 2.
Moderate to large predominantly closed estuaries
The moderate to large predominantly closed systems were open at the time of sampling, with the exception of the Mtentwana estuary. All estuaries were relatively shallow, with average water depths not exceeding 1.8 m (Table 1). Mean water temperatures measured between 24.2°C (Mpande) and 26.9°C (Mtumbane). Mean salinities ranged from 6.0 (Mtumbane) to 29.2 (Bulolo). Clear horizontal and vertical salinity gradients were evident in all four estuaries, with surface and bottom salinities increasing upstream of the mouth. Average dissolved oxygen values ranged between 5.3 mg-L-1 (Mpande) and 7.4 mg-L-1 (Mtentwana). The estuaries were moderately clear systems, with a mean turbidity ofbetween 12.0 and 31.7 NTU. Average pH values were between 7.6 and 8.0 (Table 1). Physico-chemical parameters by site are given in Table 2.
Predominantly open estuaries
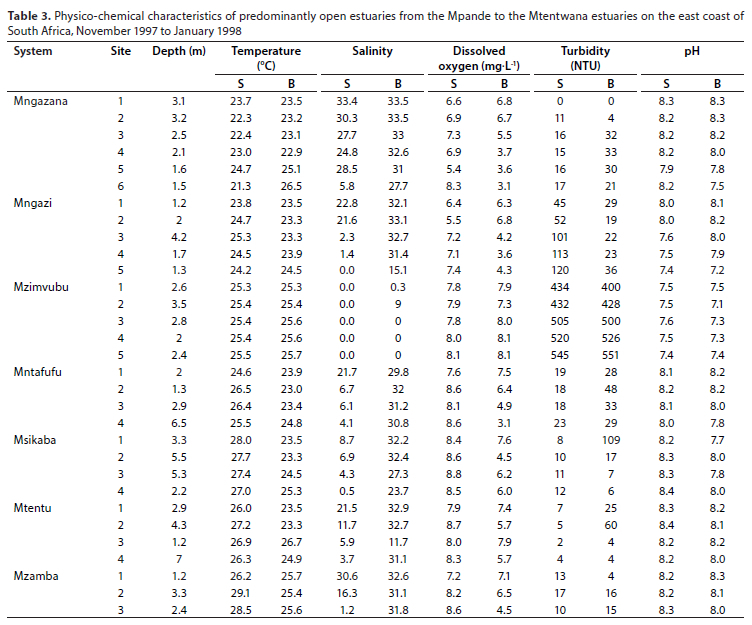
Mean water depths recorded in the eight predominantly open estuaries ranged from 1.0 m (Sinangwana) to 4.1 m (Msikaba) (Table 1). Water temperatures averaged between 23.5°C (Mngazana) and 26.8°C (Mzamba). Water temperatures in most estuaries were highest in the middle reaches (Table 3). The Msimvubu Estuary was sampled during a period of high rainfall and runoff and this is reflected in the salinities recorded; freshwater extended throughout the system with a mean salinity of 0.9 (Table 1). Mean salinities in the other systems ranged between 17.0 (Msikaba) and 30.3 (Sinangwana). Vertical and horizontal salinity stratification was also pronounced in these systems (Table 3). Mean dissolved oxygen values ranged between 5.9 (Mngazana and Mngazi) and 7.4 mg-L-1 (Mntentu). The Mzimvubu was very turbid (> 484.1 NTU), whereas the other estuaries were moderately turbid (10.8-56.0 NTU). The mean pH in all estuaries ranged between 7.4 and 8.2 (Table 1). Physico-chemical parameters by site are given in Table 3.
Multivariate analysis
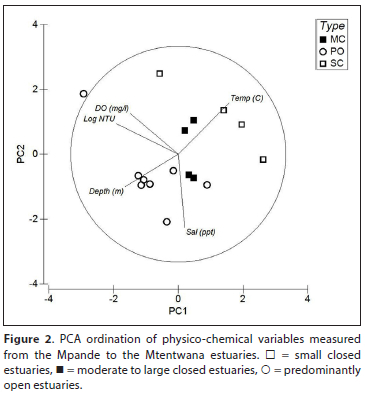
The PCA classification (Fig. 2) divided the estuaries based on turbidity and depth (Axis 1) and salinity and temperature (Axis 2). The first two axes accounted for approximately 68% of the variation between the samples. Most predominantly open estuaries were situated towards the bottom right of the plot associated with depth (deep) and high salinities, with the exception of the Mzimvubu, which was situated at the top right associated with high turbidity and low salinity. Most small predominantly closed estuaries were situated towards the left of the plot and were associated with high temperatures and depth (shallow), with the exception of the Ntlupeni situated towards the top and associated with low salinity. The moderate to large predominantly closed estuaries were situated towards the middle of the plot (and intermediate conditions) (Fig. 2). Although there was some overlap between estuary types, the ANOSIM test revealed a weak but significant difference between estuary types (Global R: 0.34; p < 0.05). Pairwise tests showed that there was no significant difference between small predominantly closed estuaries and moderate to large predominantly closed estuaries (R: 0.22; p > 0.05); however, significant differences were observed between predominantly open estuaries and small predominantly closed estuaries (R: 0.60; p > 0.05).
Fish communities
Small predominantly closed estuaries
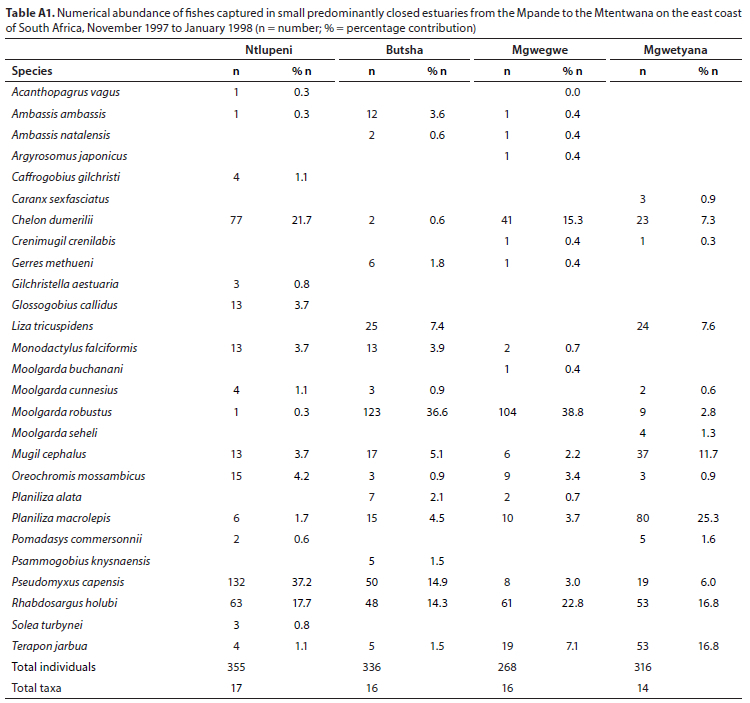
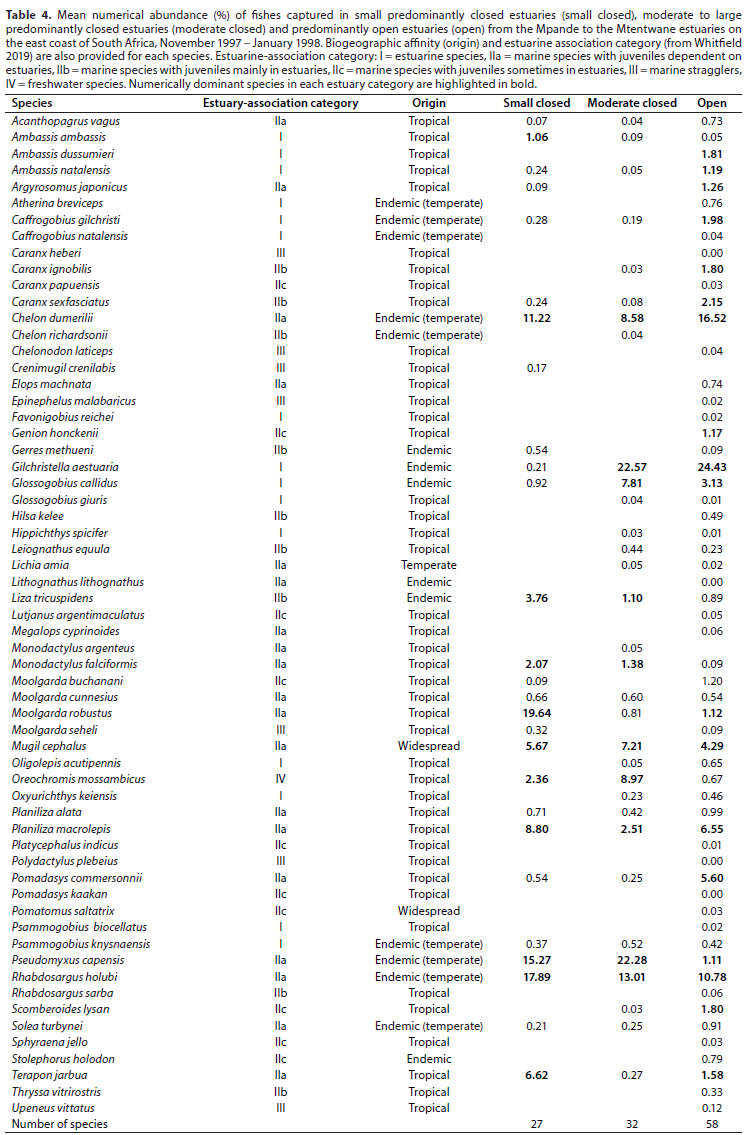
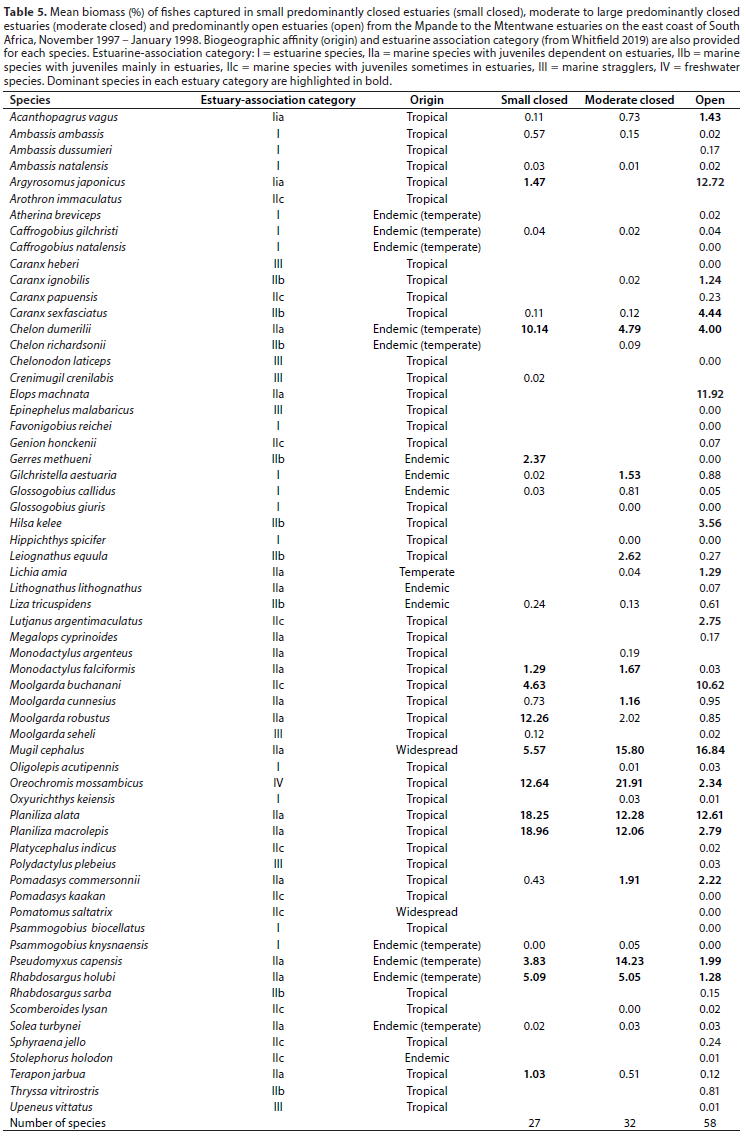
A total of 27 species were captured in small predominantly closed estuaries, with between 14 (Mgwetyana) and 17 (Ntlupeni) species captured per estuary. Numerically important species captured within this group of estuaries were Moolgarda robustus (mean = 19.6%), Rhabdosargus holubi (mean = 17.9%), Pseudomyxus capensis (mean = 15.3%), Chelon dumerilii (mean = 11.2%), Planiliza macrolepis (mean = 8.8%), Terapon jarbua (mean = 6.6%), Mugil cephalus (mean = 5.7%), Liza tricuspidens (mean = 3.8%), Oreochromis mossambicus (2.4%), Monodactylus falciformis (2.1%) and Ambassis ambassis (1.1%) (Table 4). Estuarine-associated marine species (Category II) dominated catches numerically comprising 94% of the catch, followed by estuarine species (Category I), comprising 3% of the catch and freshwater species (Category IV - 2.4%). Numerical abundance per estuary are given in Table A1 (Appendix).
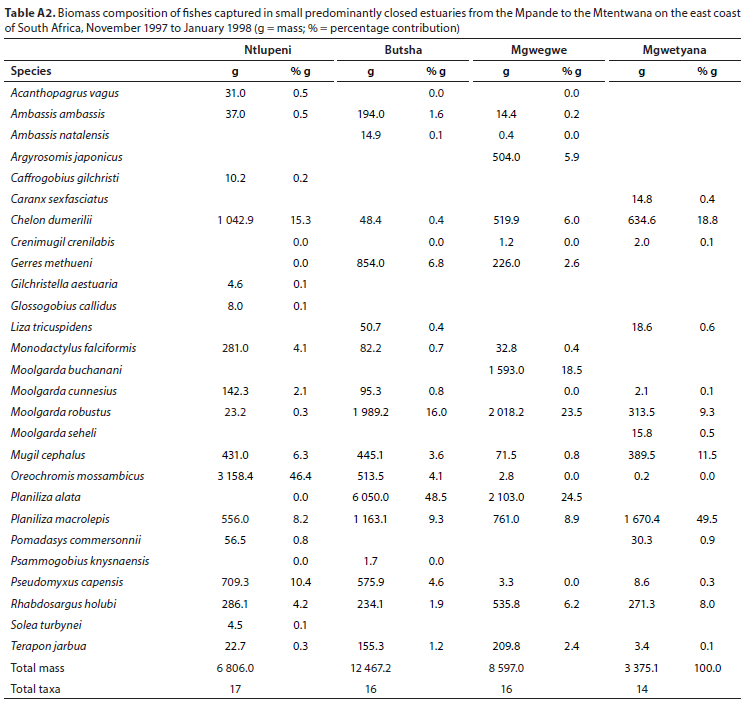
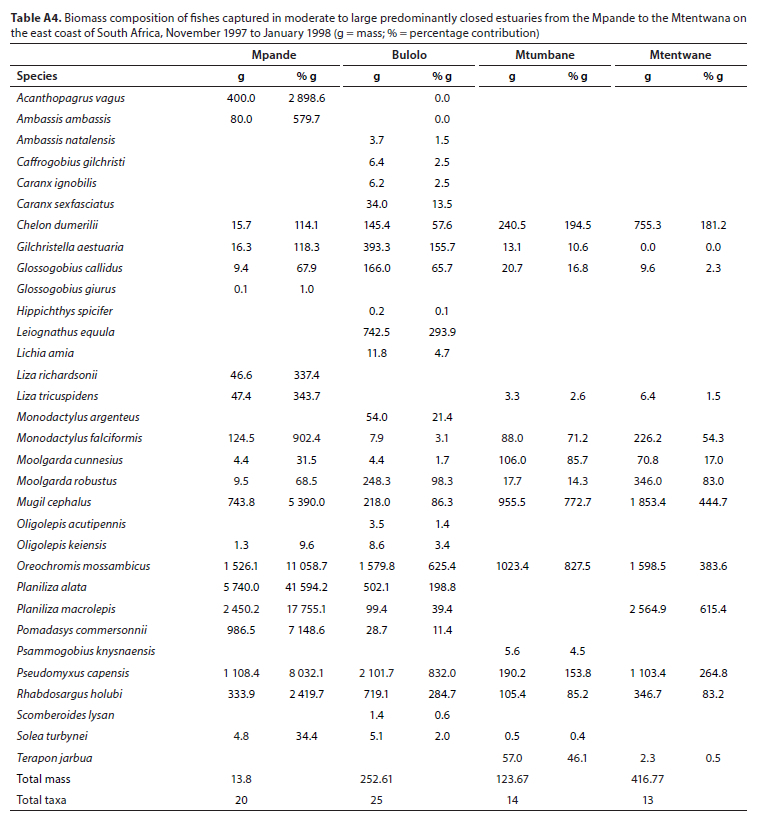
In terms of biomass, important species included P. macrolepis (mean = 19.0%) and Planiliza alata (mean = 18.2%), O. mossambicus (mean = 12.6%), M. robustus (mean = 12.3%), C. dumerili (mean = 10.1%), M. cephalus (mean = 5.6%), R. holubi (mean = 5.1%), Moolgarda buchanani (mean = 4.6%), P. capensis (mean = 3.8%), Gerres methueni (mean = 2.4%), Argyrosomus japonicus (mean = 1.5%), M. falciformis (mean = 1.3%) and T. jarbua (mean = 1.0%) (Table 5). In terms of biomass, estuary-associated marine species comprised 86.5% of the catch, followed by freshwater species (12.6%), estuarine (0.7%) and marine (0.4%) species. Biomass of fishes per estuary are given in Table A2 (Appendix). Tropical species accounted for 59% of the taxa, but temperate species accounted for 50.1% of the overall abundance. In terms of biomass, tropical species dominated and comprised 72% of the catch.
Moderate to large predominantly closed estuaries
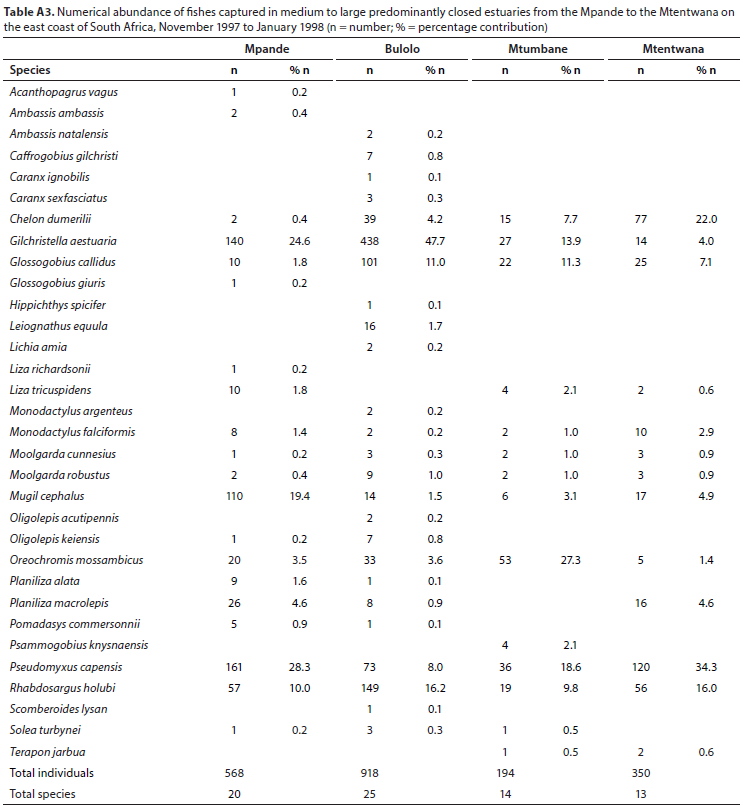
A total of 32 species were captured in moderate to large predominantly closed estuaries with between 14 (Mtentwana) and 26 (Bulolo) species captured per estuary. The most abundant species within this group of estuaries overall were Gilchristella aestuaria (mean = 22.6%), P. capensis (mean = 22.3%), R. holubi (mean = 13%), O. mossambicus (mean = 9.0%), C. dumerili (mean = 8.6%), Glossogobius callidus (mean = 7.8%), M. cephalus (mean = 7.2%), P. macrolepis (mean = 2.5%), M. falciformis (mean = 1.4%) and L. tricuspidens (mean = 1.1%) (Table 4). Estuarine-associated marine species comprised 59% of the catch, followed by estuarine species (32%) and freshwater species (9%). Numerical abundance per estuary is given in Table A3 (Appendix).
Dominant species overall in terms of biomass included O. mossambicus (mean = 21.9%), M. cephalus (mean = 15.8%), P. capensis (mean = 14.2%), P. alata (mean = 12.3%), P. macrolepis (mean = 12.1%), R. holubi (mean = 5.1%), C. dumerili (mean = 4.8%), Leiognathus equula (mean = 2.6%), M. robustus (mean = 2.0%), Pomadasys commersonnii (mean = 1.9%), M. falciformis (mean = 1.7%) and G. aestuaria (mean = 1.5%) (Table 5). In terms of biomass, estuary-associated marine species comprised 75% of the catch, followed by freshwater species (22%) and estuarine species (3%). Biomass of fishes per estuary are given in Table A4 (Appendix). In terms of taxa, tropical species comprised 62.5% of the overall catches. Endemic (temperate) and temperate species dominated the catches numerically (76.4%), while tropical species dominated the biomass (57%).
Predominantly open estuaries
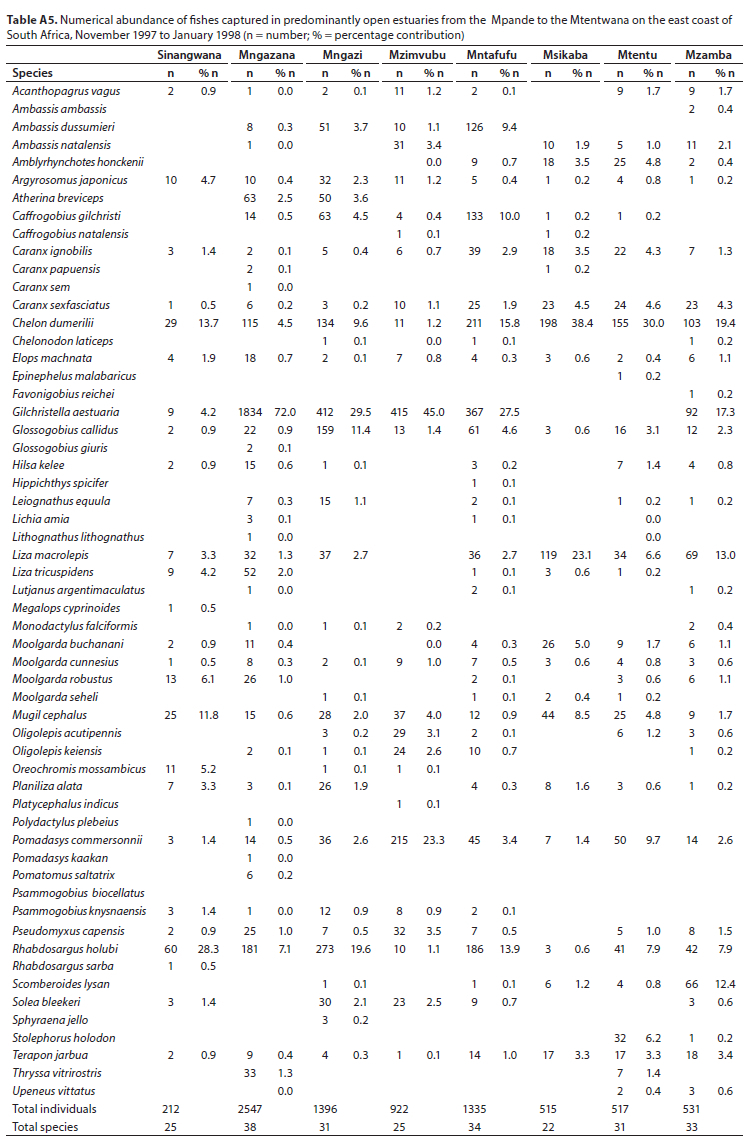
A total of 58 species were captured in the predominantly open estuaries with between 11 (Gxwaleni) and 38 (Mngazana) species captured per estuary. In terms of numbers, catches were dominated by G. aestuaria (mean = 24.4%), C. dumerili (mean = 16.5%), R. holubi (mean = 10.8%), P. macrolepis (mean = 6.6%), P. commersonnii (mean = 5.6%), M. cephalus (mean = 4.3%), G. callidus (mean = 3.1%), Caranx sexfasciatus (mean = 2.2%), and Caffrogobius gilchristi (mean = 1.9%) (Table 4). Estuarine-associated marine species numerically dominated and comprised 64% of the catch, followed by estuarine species (35%). Freshwater species and marine stragglers (category III) together comprised 1% of the catch. Numerical abundance per estuary is given in Table A5 (Appendix).
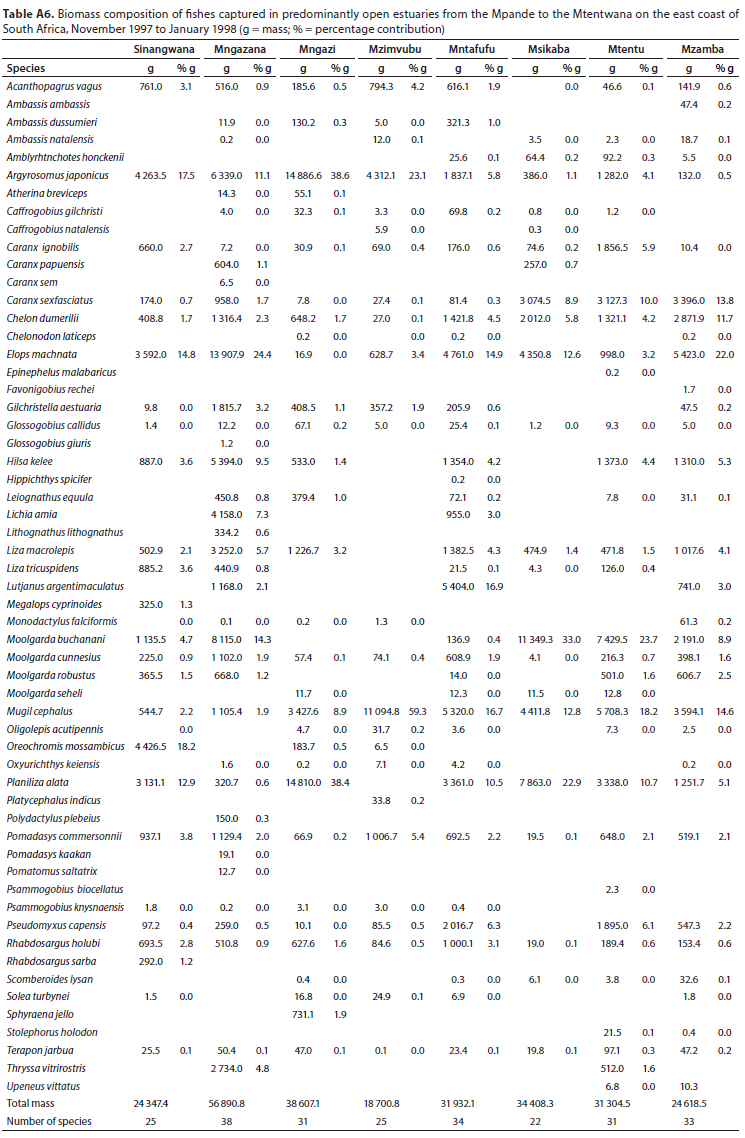
The biomass in predominantly open estuaries was dominated by M. cephalus (mean = 16.8%), Argyrosomus japonicus (mean = 12.7%), P. alata (mean = 12.6%), Elops machnata (mean = 11.9%), M. buchanani (mean = 10.6%), C. sexfasciatus (mean = 4.4%), C. dumerili (mean = 4.0%), Hilsa kelee (mean = 3.6%), P. macrolepis (mean = 2.8%), Lutjanus argentimaculatus (mean = 2.7%), O. mossambicus (mean = 2.3%), P. commersonnii (mean = 2.2%) and P. capensis (mean = 2.0%) (Table 5). In terms of biomass, estuary-associated marine species comprised 96% of the catch followed by freshwater (2%) and estuarine species (1%). Biomass of fishes per estuary are given in Table A6 (Appendix). Tropical species dominated the catches (71%) in terms of taxa, while endemic (temperate) and temperate species dominated the catches numerically (62%). Tropical species also dominated in terms of biomass (73%).
Multivariate analyses
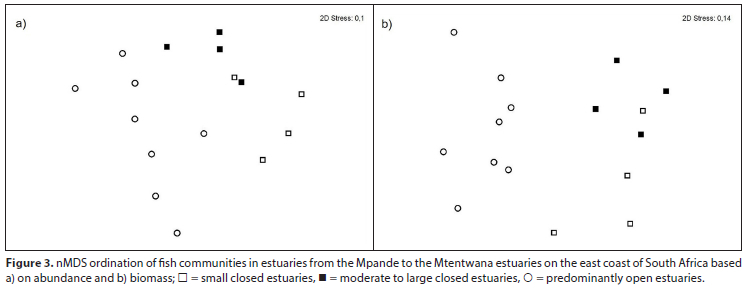
The nMDS plots based on abundance and biomass produced a pattern where predominantly open estuaries separated from predominantly closed estuaries, which were situated to the right of the plot. The small and moderate to large predominantly closed estuaries also separated, although one small predominantly closed estuary (Ntlupeni) clustered with the large to moderate predominantly closed estuaries (Fig. 3). The ANOSIM test based on abundance data revealed significant differences between estuaries based on type (R = 0.55). Biomass yielded similar results, with the three estuary types being significantly different (R = 0.69).
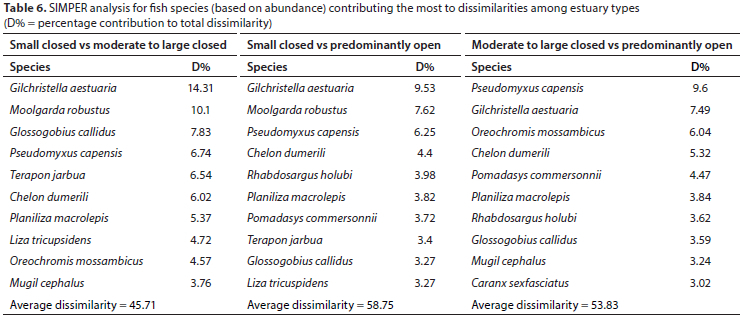
SIMPER analysis based on abundance showed that small predominantly closed and moderately to large predominantly closed estuaries had an average dissimilarity of 45.7%. Species such as M. robustus, C. dumerili and P. macrolepis, which collectively accounted for 21.5% of the overall dissimilarity, were more abundant in small predominantly closed estuaries. Species such as G. aestuaria, P. capensis, O. mossambicus and G. callidus (which collectively accounted for 33.4% of the overall dissimilarity) were more abundant in moderate to large predominantly closed systems. These species, along with R. holubi, also accounted for differences between small and moderate to large predominantly closed estuaries and predominantly open estuaries (Table 6), with catches in predominantly open estuaries dominated by G. aestuaria, C. dumerili and R. holubi (Table 4). There was a 58.8% dissimilarity between small closed estuaries and open estuaries and a 53.8% dissimilarity between moderate to large closed estuaries and open estuaries (Table 6).
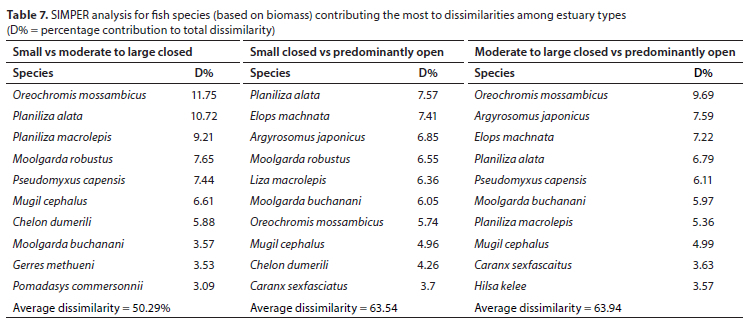
In terms of biomass, there was a 50.3% dissimilarity between small and moderate to large predominantly closed estuaries. Planaliza alata, P. macrolepis, M. robustus, C. dumerili, M. buchanani and G. methueni, which contributed 40.6% of the dissimilarity between small and moderate to large predominantly closed estuaries (Table 7), were more abundant in small predominantly closed estuaries (Table 5). Oreochromis mossambicus, P. capensis, M. cephalus and P. commersonnii, which contributed 28.9% to the dissimilarity (Table 7), were more abundant in terms of biomass in the moderate to large predominantly closed estuaries (Table 5). In terms of biomass, there was a 63.5% dissimilarity between small predominantly closed estuaries and predominantly open estuaries and a 63.9% dissimilarity between moderate to large predominantly closed estuaries and predominantly open estuaries. Species such as P.alata, M. robustus, P. capensis, C. dumerili and G. methueni, which collectively accounted for 30.5% ofthe overall dissimilarity between small predominantly closed and predominantly open estuaries (Table 7), contributed more to the biomass in small predominantly closed estuaries (Table 5). Elops machnata, A. japonicus, M. cephalus, M. buchanani and P. commersonnii (29.0% of overall dissimilarity) contributed more to the biomass of predominantly open estuaries (Table 5). Oreochromis mossambicus, P. capensis and P. macrolepis, which collectively accounted for 47.9% of the overall dissimilarity between moderate to large predominantly closed estuaries and predominantly open estuaries, were more important, in terms of biomass, in the moderate to large predominantly closed estuaries. Argyrosomus japonicus, E. machnata, M. buchanani, C. sexfasciatus and H. kelee (collectively accounted for 28.0% of the dissimilarity) were more important in the predominantly open estuaries (Table 5).
DISCUSSION
This survey provides important baseline information on the fish assemblages of estuaries found along a po orly studied section of the South African coastline. Of the sixteen estuaries included in this analysis, eight were classified as predominantly closed estuaries and eight as predominantly open estuaries. The predominantly closed estuaries were further divided into four small and four moderate to large predominantly closed estuaries. In terms of physico-chemical parameters, the predominantly open estuaries clustered separately from the predominantly closed estuaries and were all fairly deep systems (1-4 m average depth), mostly characterized by high salinities (19-30). The Mzimvuba was, however, sampled following heavy rainfall and was fresh at the time of sampling, with very high turbidities (average turbidity = 481 NTU). Sampling was conducted during October and November, with November normally representing the onset of the high-flow period (James et al., 2020). The small predominantly closed estuaries were mostly shallow systems characterized by high temperatures. The moderate to large predominantly closed estuaries were characterized by intermediate physico-chemical conditions.
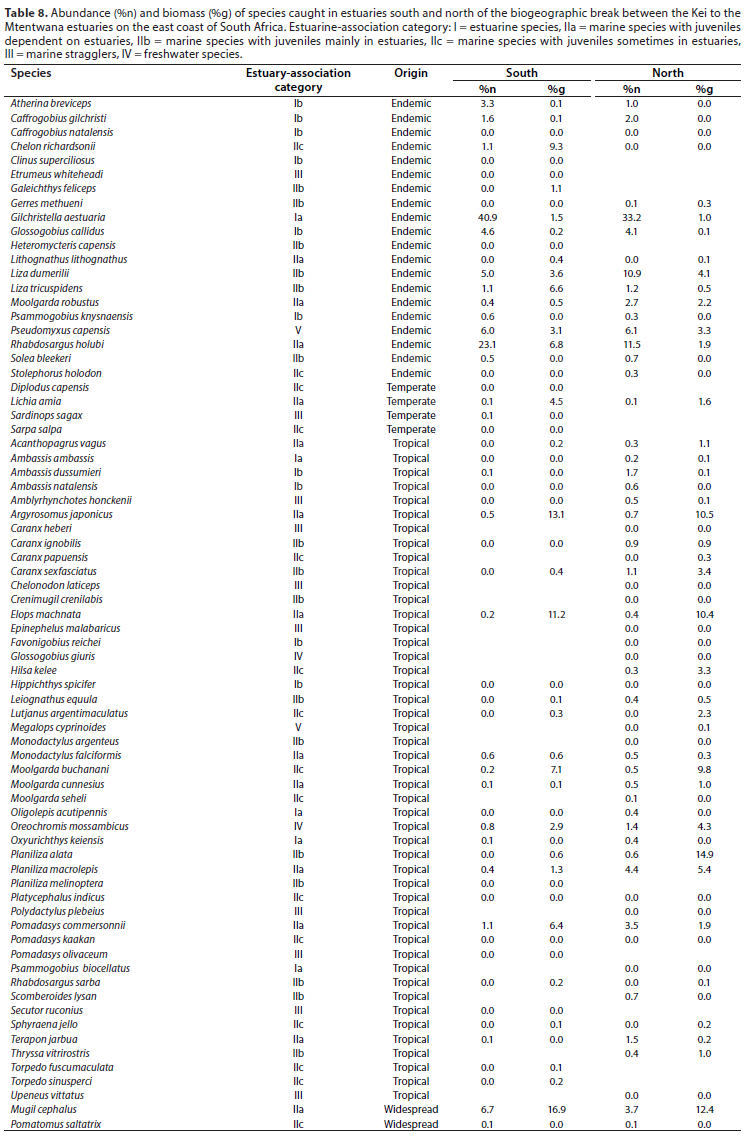
Estuaries in this region are within the warm-temperate/ subtropical biogeographic transition zone, with the warm-temperate region extending to just south of Port St Johns and the subtropical zone extending northwards of the Mdumbi Estuary near Port St Johns (Harrison, 2002). Transition zones are typically areas of high environmental variability (Attrill and Rundle, 2002) and species turnover, resulting in increased levels of species richness (Spector, 2002; Konar et al., 2010). Furthermore, many tropical and temperate species reach their southern and northern distributional limit, respectively, within South African estuaries in the subtropical/warm-temperate transition-zone (e.g. Maree et al., 2000; Harrison and Whitfield, 2006b). Indicative of the high species richness in this region was the fact that 61 species were recorded in estuaries in the region (Table 8), with 27 species recorded in the four small predominantly closed estuaries, 32 species in the moderate to large predominantly closed estuaries and 58 species in the predominantly open estuaries. A comparable survey along the southern Transkei coast, which lies to the south of the biogeographic break, documented 57 species in total (Table 8) with 28, 41 and 52 fish species from small predominately closed, moderate to large predominantly closed and predominantly open estuaries, respectively (James and Harrison, 2020).
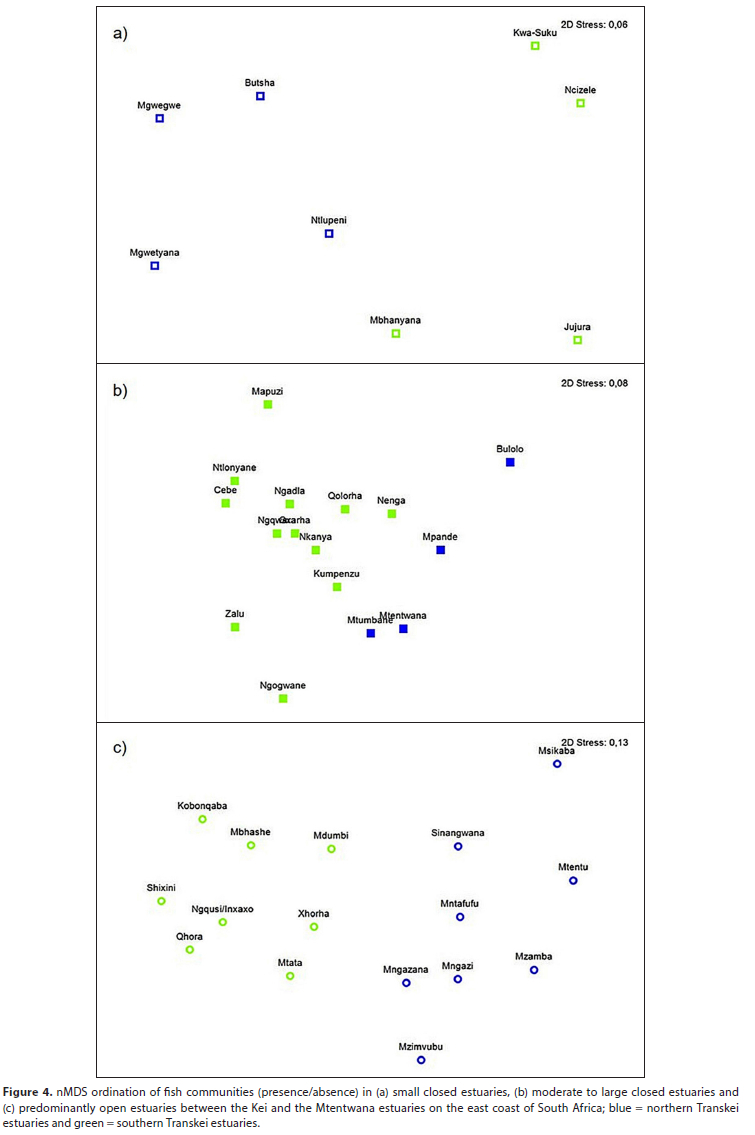
When combining data for the whole of the transition zone (James and Harrison, 2020 and this study) fish communities in small (Fig 4a) and moderate to large (Fig 4b) predominantly closed and predominantly open estuaries (Fig. 4c) clustered into two distinct groups based on whether they occurred in estuaries to the south of the break (southern Transkei) or to the north of the break (northern Transkei). This was most evident and significant (ANOSIM R = 0.807) in predominantly open estuaries. Endemic species such as Gilchristella aestuaria, Rhabdosargus holubi, Glossogobius callidus, Atherina breviceps, Caffrogobius gilchristi and Chelon richardsonii, which collectively accounted for 41.3% of the overall dissimilarity (SIMPER analysis) between southern and northern predominantly open estuaries, contributed more to the abundance in southern Transkei estuaries. Both warm-water and cool-water endemic species, although present in estuaries throughout South Africa, are most common in warm-temperate estuaries, where they dominate the fish community (Harrison and Whitfield, 2006b). Tropical species, including Planiliza macrolepis, Pomadasys commersonnii, Ambassis dussumieri and Terapon jarbua, which accounted for 10% of the dissimilarity between northern and southern predominantly open estuaries, contributed more to the abundance in northern Transkei estuaries. These species typically comprise a major component of the fish community in subtropical estuaries (Harrison and Whitfield, 2006b).
Many of the species recorded in northern Transkei estuaries (Table 8) and not in previous studies of south-east and east coast estuaries (James and Harrison, 2010a; 2010b; 2011; 2016; 2020) were tropical species that are mainly confined to subtropical estuaries and whose distribution is strongly linked to temperature (Harrison and Whitfield, 2006b). In estuaries north of the biogeographic break, tropical species comprised 69% of the number of species recorded, which was greater than in the southern Transkei estuaries where tropical species comprised 54% of the species (Table 8). Endemic and temperate species dominated all estuaries numerically (74%), while in terms of biomass, tropical species dominated catches and comprised 72% of the catch. In the southern Transkei, overall endemic and temperate species comprised 89% of the catch numerically and 38% of the biomass (with tropical species comprising 45% of the biomass). These findings are indicative of all estuaries in the Transkei occurring within a biogeographic transition zone and northern Transkei estuaries occurring north of the subtropical/ warm-temperate break.
The nMDS plots based on abundance and biomass showed that predominantly open estuaries clustered together and separated significantly from predominantly closed estuaries, which were situated to the right of the plots. Small and moderate to large predominantly closed estuaries also had significantly different fish assemblages. Overall, dominant species in the small predominantly closed estuaries included Pseudomyxus capensis, Planaliza alata, Planaliza macrolepis, Moolgarda robustus, Chelon dumerili, Moolgarda buchanani, Gerres methueni and Rhadosargus holubi. Dominant species in moderate to large predominantly closed estuaries included Gilchristella aestuaria, R. holubi, P. capensis, Oreochromis mossambiccus, Glossogobius callidus, Mugil cephalus and Pomadasys commersonnii. Predominantly open estuaries, in terms of abundance and biomass, were dominated by G. aestuaria, C. dumerillii, R. holubi, Argyrsomus japonicus, Elops machnata, Moolgarda buchanani, Caranx sexfasciatus and Hilsa kelee.
Only one of the 27 species, namely Crenimugil crenilabis, recorded in the small predominantly closed estuaries, was only found in this estuary type. Two (Chelon richardonii and Monodactylus argenteus) of the 32 species recorded in moderate to large predominantly closed estuaries were only recorded in this estuary type. As in other regions surveyed (e.g. James and Harrison, 2020), species richness was much higher in predominantly open estuaries, with 58 species recorded. Twenty-two species were only recorded in predominantly open estuaries and these were Ambassis dussumieri, Atherina breviceps, Caffrogobius natalensis, Caranx heberi, Chelonodon laticeps, Elops machnata, Epinepehlus malabaricus, Favanigobius reichei, Genion honckenii, Hilsa kelee, Lithognathus lithognathus, Lutjanus argentimaculatus, Megalops cyprinoides, Polydactylus plebius, Pomadasys kaakan, Pomatomus saltatrix, Psammogobius biocellatus, Rhabdosargus sarba, Sphyraena jello, Stolephorus holodon, Thryssa vitriostris and Upeneus vittatus. Six of these species are stenohaline marine stragglers not dependent on estuaries. An increase in the number of marine stragglers recorded in the lower reaches of predominantly open estuaries often accounts for the greater species richness in predominantly open estuaries compared to predominantly closed estuaries (e.g. Bennett, 1989; Whitfield and Kok, 1992; Vorwerk et al., 2003; James and Harrison, 2016; James and Harrison, 2020). Predominantly open estuaries have a near-permanent connection with the sea and are characterised by moderate to high salinities and high species richness. Predominantly closed systems have an intermittent connection with the sea and are characterised by shallow, warmer waters. Species richness in these systems is typically lower than predominantly open estuaries.
CONCLUSION
Maree et al. (2000) suggested that the subtropical and warm-temperate transition-zone for estuaries incorporates an area where the contribution of tropical and temperate species is roughly equal, i.e. 50%. This study, which represents a unique survey of multiple estuaries along a little-studied section of the South African coastline, shows that although all estuaries in both the southern and northern Transkei fall within a transition zone, predominantly open estuaries to the north of the Sinangwana Estuary are more subtropical in nature. This was evidenced by the increase in the number and abundance of tropical species recorded in these estuaries (and the clustering of fish communities in the northern Transkei into a significantly distinct group).
ACKNOWLEDGEMENTS
This project was undertaken by the CSIR (Durban) and funded by the then South African Department of Environmental Affairs and Tourism (now the Department of Forestry, Fisheries and the Environment). The authors would also like to thank the Walter Sisulu University for logistical and operational support during field sampling operations.
ORCID
NC James: https://orcid.org/0000-0002-9472-5314
REFERENCES
ATTRILL MJ and RUNDLE SD (2002) Ecotone or ecocline: Ecological boundaries in estuaries. Estuar. Coast. Shelf Sci. 55 929-936. https://doi.org/10.1006/ecss.2002.1036 [ Links ]
BENNETT BA (1989) A comparison of the fish communities in nearby permanently open, seasonally open and normally closed estuaries in the South-Western Cape, South Africa. S. Afr. J. Mar. Sci. 8 43-55. https://doi.org/10.2989/02577618909504550 [ Links ]
BLABER SJM, HILL BJ and FORBES AT (1974) Infratidal zonation in a deep South African estuary. Mar. Biol. 28 333-337. https://doi.org/10.1007/BF00388502 [ Links ]
BLABER SJM (1977) The feeding ecology and relative abundance of mullet (Mugilidae) in Natal and Pondoland estuaries. Biol. J. Linn. Soc. 9 259-275. https://doi.org/10.1111/j.1095-8312.1977.tb00269.x [ Links ]
CLARKE KR and WARWICK RM (2001) Change in Marine Communities: An Approach to Statistical Analysis and Interpretation. PRIMER-E, Plymouth. [ Links ]
COLLOTY BM, ADAMS JB and BATE GC (2002) Classification of estuaries in the Ciskei and Transkei regions based on physical and botanical characteristics. S. Afr. J. Bot. 68 312-321. https://doi.org/10.1016/S0254-6299(15)30392-6 [ Links ]
FIELD JG, CLARKE KR and WARWICK RM (1982) A practical strategy for analysing multispecies distribution patterns. Mar. Ecol. Prog. Ser. 8 37-52. https://doi.org/10.3354/meps008037 [ Links ]
HARRISON TD (2001) Length-weight relationships of fishes from South African estuaries. J. Appl. Ichthyol. 17 46-48. https://doi.org/10.1046/j.1439-0426.2001.00277.x [ Links ]
HARRISON TD (2002) Preliminary assessment of the biogeography of fishes in South African estuaries. Mar. Freshwater Res. 53 479-490. https://doi.org/10.1071/MF01121 [ Links ]
HARRISON TD and WHITFIELD AK (2006a) Estuarine typology and the structuring of fish communities in South Africa. Environ. Biol. Fishes. 75 269-293. https://doi.org/10.1007/s10641-006-0028-y [ Links ]
HARRISON TD and WHITFIELD AK (2006b) Temperature and salinity as primary determinants influencing the biogeography of fishes in South African estuaries. Estuar. Coast. Shelf Sci. 66 335-345. https://doi.org/10.1016/j.ecss.2005.09.010 [ Links ]
HEYDORN AEF (1991) The conservation status of southern African estuaries. In: Huntley BJ (ed.) Biotic Diversity in Southern Africa. Concepts and Conservation. Oxford University Press, Cape Town. [ Links ]
HOPPE-SPEER SCL, ADAMS JB and BAILEY D (2015) Present state of mangrove forests along the Eastern Cape coast, South Africa. Wetlands Ecol. Manage. 23 371-383. https://doi.org/10.1007/s11273-014-9387-x [ Links ]
JAMES NC and HARRISON TD (2010a) A preliminary survey of the estuaries on the southeast coast of South Africa, Cape St Francis - Cape Padrone, with particular reference to the fish fauna Trans. R. Soc. S. Afr. 65 69-84. http://dx.doi.org/10.1080/00359191003652116 [ Links ]
JAMES NC and HARRISON TD (2010b) A preliminary survey of the estuaries on the southeast coast of South Africa, Cape Padrone -Great Fish River, with particular reference to the fish fauna Trans. R. Soc. S. Afr. 65 149-164. http://dx.doi.org/10.1080/00359191003652165 [ Links ]
JAMES NC and HARRISON TD (2011) A preliminary survey of the estuaries on the southeast coast of South Africa, Old Woman's Tyolomnqa, with particular reference to the fish fauna Trans. R. Soc. S. Afr. 66 59-77. http://dx.doi.org/10.1080/0035919X.2011.580018 [ Links ]
JAMES NC and HARRISON TD (2016) A preliminary fish survey of the estuaries on the southeast coast of South Africa, Kayser's Beach - Kei Mouth: a comparative study. Water SA. 42 82-101. https://doi.org/10.4314/wsa.v42i1.10 [ Links ]
JAMES NC and HARRISON TD (2020) A preliminary fish survey of the estuaries on the south-east coast of South Africa, Kei Estuary to Mdumbi: A comparative study. Water SA. 46 (3) 366-382. https://doi.org/10.17159/wsa/2020.v46.i3.8647 [ Links ]
JAMES NC, ADAMS JB, CONNELL AD, LAMBERTH SJ, MACKAY CF, SNOW G, VAN NIEKERK L and WHITFIELD AK (2020) High flow variability and storm events shape the ecology of the Mbhashe Estuary, South Africa. Afr. J. Aquat. Sci. 45 (1-2) 131-151. https://doi.org/10.2989/16085914.2020.1733472 [ Links ]
KONAR B, IKEN K, POHLE G, MILOSLAVICH P, CRUZ-MOTTA JJ, BENEDETTI-CECCHI L, KIMANI E, KNOWLTON A, TROTT T, ISETO T and SHIRAYAMA (2010) Surveying nearshore bio-diversity. ln: Mcintyre AD (ed) Life in the World's Oceans Diversity, Distribution, and Abundance. Wiley-Blackwell: Blackwell Publishing Ltd, Chichester. 27-41. https://doi.org/10.1002/9781444325508.ch2 [ Links ]
LANDMAN WA, BOTES S, GODDARD L and SHONGWE M (2005) Assessing the predictability ofextreme rainfall seasons over southern Africa. Geophys. Res. Lett. 32.https://doi.org/10.1029/2005GL023965 [ Links ]
MAREE RC, WHITFIELD AK and BOOTH AJ (2000) Effect of water temperature on the biogeography of South African estuarine fishes associated with the subtropical/warm temperate subtraction zone. S. Afr. J. Sci. 96 184-188. [ Links ]
MBANDE S, WHITFIELD AK and COWLEY PD (2005) The ichthyofaunal composition of the Mngazi and Mngazana estuaries: a comparative study. Smithiana Bull. 4 1-20. [ Links ]
PLUMSTEAD EE (1984) The occurrence and distribution of fish in selected Transkei estuaries. MSc thesis, University of Transkei, Umtata. [ Links ]
PLUMSTEAD EE, PRINSLOO JF and SCHOONBEE HJ (1991) A survey of the fish fauna of Transkei estuaries. Part 4: The Mntafufu and Mzamba River estuaries. S. Afr. J. Zool. 26 153-163. https://doi.org/10.1080/02541858.1991.11448244 [ Links ]
SHANNON LV (1989) The physical environment. In: Payne AL and Crawford RJM (eds) Oceans of Life off Southern Africa. Vlaeberg Publishers, Johannesburg. [ Links ]
SKELTON PH (1993) A Complete Guide to the Freshwater Fishes of Southern Africa. Southern Book Publishers, Halfway House. 388 pp. [ Links ]
SMITH MM and HEEMSTRA PC (1991) Smiths' Sea Fishes. Southern Book Publishers, Johannesburg. 1 048 pp. [ Links ]
SMIT AJ, ROBERTS M, ANDERSON RJ, DUFOIS F, DUDLEY SFJ, BORNMAN TG, OBLERS J and BOLTON JJ (2013) A coastal seawater temperature dataset for biogeographical studies: larges biases between in situ and remotely-sensed data sets around the coast of South Africa. PLoS ONE. 8 e81944. https://doi.org/10.1371/journal.pone.0081944 [ Links ]
SPECTOR S (2002) Biogeographic crossroads as priority areas for biodiversity conservation. Conserv. Biol. 16 1480-1487. https://doi.org/10.1046/j.1523-1739.2002.00573.x [ Links ]
VORWERK PD, WHITFIELD AK, COWLEY PD and PATERSON AW (2003) The influence of selected environmental variables on fish assemblage structure in a range of southeast African estuaries. Environ. Biol. Fishes. 66 237-247. https://doi.org/10.1023/A:1023922521835 [ Links ]
WHITFIELD AK and BALIWE NG (2013) A century of science in South African estuaries: bibliography and review of research trends. SANCOR Occasional Report No. 7. Sancor, Grahamstown. 289 pp. [ Links ]
WHITFIELD AK and KOK HM (1992) Recruitment of juvenile marine fishes into permanently open and seasonally open estuarine systems on the southern coast of South Africa. Ichthyol. Bull. 57 1-39. [ Links ]
WHITFIELD AK (2019) Fishes of Southern African Estuaries: From Species to Systems. Smithiana Monograph No. 4. SAIAB, Grahamstown. 495 pp. [ Links ]
 Correspondence:
NC James
Email: nc.james@saiab.nrf.ac.za
Received: 20 September 2021
Accepted: 22 September 2022
APPENDIX

