


Services on Demand
Article
 English (pdf)
 Article in xml format
 Article references
Indicators

Related links
-
 Cited by Google
 -
 Similars in Google
Share

 Permalink
Water SA
On-line version ISSN 1816-7950
Print version ISSN 0378-4738
Water SA vol.48 n.4 Pretoria Oct. 2022
http://dx.doi.org/10.17159/wsa/2022.v48.i4.3960
RESEARCH PAPER
Flow patterns and chemical loads in the middle Olifants River, Limpopo River System, South Africa
SM MarrI; DCH RetiefII; JR SaraI; WJ Luus-PowellI
IDSI-NRF SARChl Chair (Ecosystem Health), Department of Biodiversity, University of Limpopo, Sovenga 0727, South Africa
IIAssociation for Water & Rural Development (AWARD), PO Box 1919, Hoedspruit 1380, South Africa
ABSTRACT
Historical data (July 1998 - June 2018) for the middle Olifants River, Limpopo River system, were compiled to evaluate the dynamics of selected water physico-chemical parameters with river discharge.The concentration of most water quality parameters increased over time. However, these concentrations are rapidly decreased, or reset, by the rapid filling, or spilling, of Loskop and/or Flag Boshielo Dams during a high-flow event. The flow-duration curves for stations below impoundments in the middle catchment on the Olifants River are typical of highly regulated rivers, although releases from Flag Boshielo Dam were more consistent through :he 20 years. No outflow from Loskop Dam was recorded for 5.4% of the 20 years. The load-duration curves for gauging weirs on the Olifants and Elands rivers immediately upstream of Flag Boshielo Dam showed that the 'tolerable' concentrations were exceeded for total dissolved solids at the 60th and 20th percentiles of the low, respectively. In addition, records for electrical conductivity, sodium, chloride, and alkalinity frequently exceeded the 'tolerable' concentrations at these sites. The results for Loskop and Flag Boshielo dams are generally lower than the tolerable concentrations for the parameters evaluated. Management of the flow regulation of the Olifants River should be aimed at meeting the water quality stipulations for all users in the agricultural, domestic, industrial, and recreational sectors.
Keywords: Rio Elefantes, Flag Boshielo Dam, high flow dilution, electrical conductivity, sulphate, flow-duration, curves, load-duration curves
INTRODUCTION
South Africa is a semi-arid country with limited fresh water resources, which are under increasing threat from climate change, population growth and an expanding economy (Ziervogel et al., 2014). Scarcity of fresh water is aggravated by a continued decline in water quality, a lack of water supply and waste treatment infrastructure in rural areas, poorly maintained infrastructure in urban areas, and poor management (Du Plessis, 2019). In addition, rainfall patterns are becoming more variable and have shifted seasonally (Knight and Fitchett, 2019). Water supply challenges are being exacerbated by population growth, rural-urban migration, and rapid socio-economic development, e.g., expansion of the power generation, mining, forestry, and irrigation sectors (Du Plessis, 2019). If the current and anticipated population and socio-economic growth trends persist, South Africa's water resources could be fully committed by 2030 (Oberholster and Ashton, 2008).
The Olifants River, Limpopo River system, supplies water to sustain the rapid socio-economic development of the Mpumalanga and Limpopo provinces in South Africa and Gaza Province in Mozambique. The Olifants River, Rio Elefantes in Mozambique, is also of major socio-ecological importance to the Limpopo River system, contributing nearly 40% of the flow of the lower Limpopo River (AWARD and USAID, 2020; Retief and Pollard, 2020). About 3.5 million people live in the South African portion of the catchment, of which about 2.3 million live in rural areas (-66%), while in Mozambique, nearly 80% of Gaza Province's 700 000 people live in the Olifants River catchment (AWARD and USAID, 2020). During recent decades, the Olifants River catchment has experienced a rapid increase in urban and agricultural development (Ashton, 2010, Heath et al., 2010). Irrigation schemes also supply water to commercially important intensive agricultural areas, e.g., between Loskop and Flag Boshielo dams, and alongside the lower Olifants from the Abel Erasmus Pass to Oxford Bridge. The Olifants River catchment also includes power generation facilities (e.g., at eMalahleni), mining and industrial activities (e.g., at eMalahleni, Middelburg, eastern Bushveld Igneous Complex, and Phalaborwa Industrial Complex), and more than 50% of South Africa's premier conservation area, the Kruger National Park (AWARD and USAID, 2020). However, acid mine drainage is acidifying ground and surface waters in the upper catchment, mobilising toxic metals (McCarthy, 2011, Netshitungulwana and Yibas, 2012). Further, uncontrolled releases of raw and poorly treated sewage frequently occur in the upper reaches (Oberholster et al., 2017). Consequently, the Olifants River has become one of the most polluted river systems in South Africa (Heath et al., 2010, Oberholster et al., 2017). Concerns were raised by De Villiers and Mkwelo (2009) regarding the rising sulphate concentrations in the Olifants River. Jooste et al. (2015) estimated that the median annual sulphate concentrations at Flag Boshielo Dam were increasing at a rate of 1.32 mg L-1 per annum, and appeared to be approaching the 100 mg-L-1 threshold value for aquatic ecosystem health; see DWAF (1996). The suitability of water from the Olifants River for domestic, industrial, and agricultural uses, and the impact on the health of rural communities are thus relevant concerns. The flow of the middle Olifants River is highly regulated and a deeper understanding of the relationship between flow and water quality could provide information for the optimal management of the quality and quantity of the water resources of the Olifants River and the conservation of the ecological integrity of this important river system. Since land-use activities in the upper reaches of the middle catchment between Loskop and Flag Boshielo dams are predominantly agricultural, in this paper, we evaluate the dynamics of selected water physico-chemical parameters with the flow regime of the Olifants River at Flag Boshielo Dam, Loskop Dam, and selected gauging stations on the Elands and middle Olifants rivers, based on historical data available from the Department of Water and Sanitations (DWS) Resource Quality Information Services website (DWS, 2017b); water quality (DWS, 2020b) and flow (DWS, 2020a).
MATERIALS AND METHODS
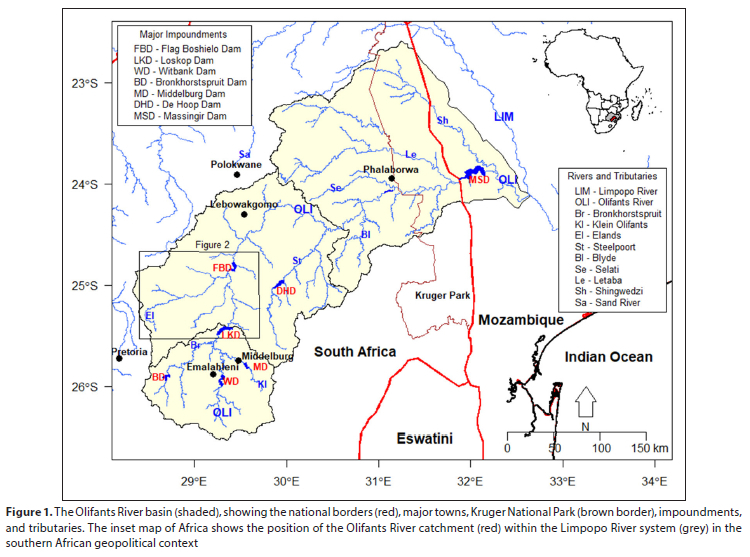
The Olifants River, a tributary of the Limpopo River, is about 770 km long and, with its tributaries, drains a land area of 80 509 km2 (Fig. 1). Shared between South Africa and Mozambique, 91.5% of the Olifants River catchment, and almost all surface and groundwater source areas, fall within South Africa.
Study sites
Flag Boshielo Dam (Fig. 2) was selected as the focal point for the study because of its potential as a site for the development of inland fisheries (Sarae tal., 2021a) and the elevated concentrations of toxic metals previously reported in fish muscle tissue from this locality (Sara et al., 2021b). Flag Boshielo Dam (24° 46' 51.46"S: 029° 25' 32.57"E), formerly Arabie Dam, is a mainstem reservoir within the middle Olifants River sub-catchment, situated approximately 35 km north of Marble Hall, Sekhukhune District, Limpopo Province, South Africa. The dam was constructed in 1987 to improve and ensure water supply to the municipalities of Polokwane, Lebowakgomo, and downstream platinum mines (Dabrowski et al., 2014). When full, the dam extends upstream to the confluence of the Elands and Olifants rivers, about 25 km from the dam wall. A continuous outflow via a pipeline provides water to the surrounding area for agricultural and human consumption, and downstream flow in the Olifants River is augmented as stipulated by water released for irrigation, mining and domestic use (Dabrowski et al., 2014). The dam height was raised from 31 to 36 m (2007-2008), thus increasing the storage capacity from 100 to 188 million m3 (Jooste et al., 2013). The current operating rule for the dam assumes a constant release for ecological purposes; the ecological reserve' (DWS, 2019). The average annual rainfall at Flag Boshielo Dam is 582 mm and the potential evapotranspiration (PET) is 1 709 mm.
Loskop Dam (Fig. 2) is a 361.5 million m3 combined gravity and arch type dam (43m high), located on the Olifants River near Groblersdal, Mpumalanga, South Africa (25° 25' 01 "S; 29° 21 '01 "E). The impoundment, situated within the Loskop Dam Nature Reserve, was established in 1939 and renovated in 1979. Water is released into canals on both sides of the Olifants River for the irrigated agriculture scheme along the Olifants River between Loskop and Flag Boshielo dams. Water is also supplied to the Weltevreden water treatment plant to supplement the water supply to domestic households in the region. Other smaller towns, such as Marble Hall and Groblersdal, are also supplied from Loskop Dam via the canal. While no releases have been made for the ecological reserve, there is scope within the available yield of the dam for such releases (DWA, 201 la, b; DWS, 2015). The average annual rainfall at Loskop Dam is 649 mm and the PET is 1 689 mm.
Rust de Winter and Mkhombo dams are located on the Elands River upstream of Flag Boshielo Dam (Fig. 2). Rust de Winter Dam (25° 14' 00"S; 28° 31' 05"E), a 28 million m3 rock-filled dam (31 m high), was established in 1920. The impoundment located within the Rust de Winter Nature Reserve, was constructed to supply water to the Rust De Winter Irrigation Scheme, which appears to have fallen into disuse and is currently only providing 10% of its design capacity. There are no releases from the dam into the river for ecological purposes (DWS, 2015). The average annual rainfall at Rust de Winter Dam is 610 mm and the PET is 1 633 mm.
Mkhombo Dam, formerly Renosterkop Dam (25° 05' 45"S; 028° 55' 00"E), a 206 million m3 combined gravity and arch type dam (36 m high), was established in 1984. The dam supplies water for regional domestic use via the Weltevreden water treatment plant. Water is released from the dam into the Elands River in pulses and is pumped to the treatment plant. Although there are irrigators downstream, no water is released specifically for irrigation or ecological purposes (DWA, 2011a, b; DWS, 2015). The average annual rainfall at Mkhombo Dam is 577 mm and the PET is 1 704 mm.
Historical flow and water quality data
For this study, a hydrological year was delineated from 1 July to 30 June, based on the winter low flow to ensure that the summer high flow was not partitioned between successive years. Historical water quality (DWS, 2020b) and river flow (DWS, 2020a) data were acquired from the DWS's Resource Quality Information Services website (DWS, 2017b) for the 20-year period from 1 July 1998 to 30 June 2018. Data were compiled for gauging stations on the Olifants River, B3R002 at Loskop Dam wall (hereafter LKD), B5R002 at Flag Boshielo Dam wall (hereafter FBD), B3H017 below Loskop Dam (hereafter OR1), B3H001 above (hereafter OR2) and B5H004 below Flag Boshielo Dam (hereafter OR3), and the Elands River, B3R001 at Rust de Winter Dam (hereafter RWD), B3R005 at Mkhombo Dam (hereafter MKD), and B3H021 below Marble Hall (hereafter ER1); see Fig. 2. Each daily flow datapoint has an associated data quality code to highlight whether the gauging station was operational or out of order, and when the flow exceeded the gauging station rating. All flow records were reviewed and all records with out-of-range or out-of-order codes were removed from the data for the statistical analyses. The data were analysed to elucidate patterns between various water quality parameters and the flow. All maps, graphs and statistical analyses were generated using the R 4.1.0 statistical software (R Development Core Team, 2022). Results were considered statistically significant at < 0.05.
Water quality
Box plots of selected water quality parameters (pH, electrical conductivity (EC), total dissolved solids (TDS), sodium (Na), potassium (K), calcium (Ca), magnesium (Mg), chloride (CI), fluoride (F), alkalinity (CaC03), sulphate (S04), and silicon (Si)) were prepared for three gauging stations along the Elands River (RWD, MKD, and ER1) and for the river gauging stations related to Flag Boshielo Dam; ER1 on the Elands River and OR1, OR2, and OR3 on the Olifants River. The generic 'ideal', 'acceptable' and 'tolerable' concentrations stipulated by the DWS (DWA, 2011c) were included in the box plots to show whether these guidelines are being exceeded. The Shapiro-Wilk test was used to determine whether the water quality parameters were normally distributed. In all cases, a significant result was returned (p < 0.001), indicating that the data were not normally distributed and, therefore, non-parametric statistics were required. The Kruskal-Wallis test was thus used to determine whether there were statistically significant differences between the respective water quality parameters at the three gauging stations on the Elands River, or between the four gauging stations related to Flag Boshielo Dam. Where the Kruskal-Wallis test returned a significant result, the Dunn test was performed post hoc to determine which results between pairs of gauging stations were statistically significant using the DunnTest function in the DescTools package (Signorell et al., 2019).
Time-series plots
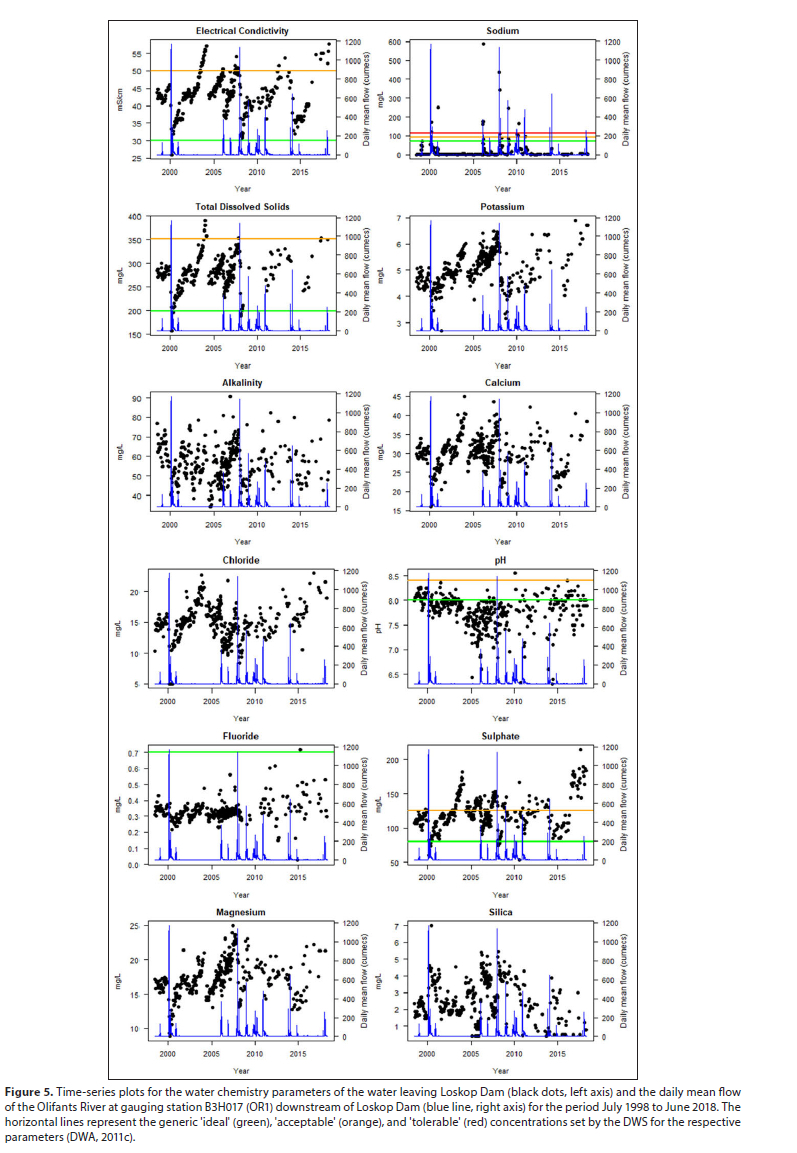
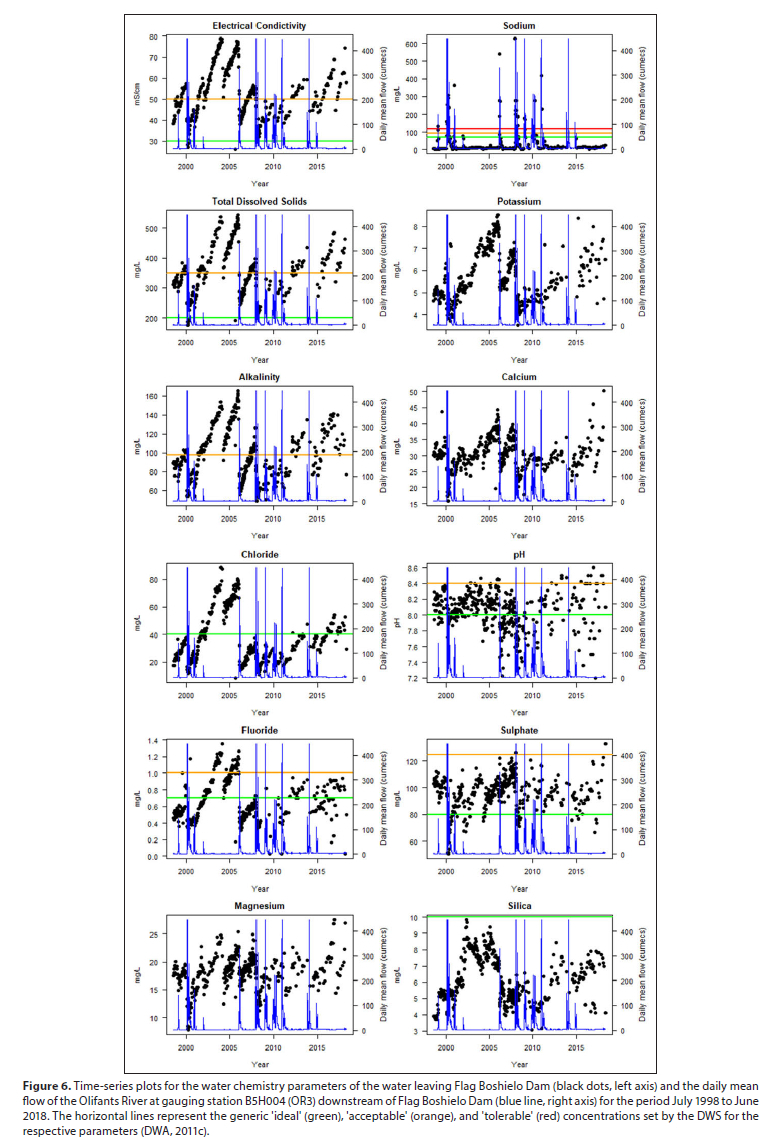
Time-series plots for selected water quality parameters (pH, EG TDS, Na, K, Ca, Mg, CI, F, CaC03, S04 and Si) were plotted with the daily mean flows for the Olifants River stations OR1 and OR3 to identify patterns in the water chemistry parameters. The generic ideal, acceptable and tolerable concentrations stipulated by the DWS (DWA, 201 lc) were included in the time-series plots to show whether these guidelines are being exceeded. Further, the monthly mean spillage over the impoundment wall, monthly mean water level, and change in the monthly mean water level were plotted for gauging stations LKD and FBD at Loskop and Flag Boshielo dam walls, respectively. Time-series plots were then prepared for the spillage, dam level, change in dam level, EC, and daily mean flow downstream of the dam to evaluate the influence of flow on the water chemistry
Flow-duration curves
Flow-duration curves relate the magnitudes of streamflow at a site and the frequency, or probability, that those flow magnitudes would be exceeded (Davie and Quinn, 2019). The flow is plotted on the y-axis (log-scale) against the exceedance probability (or exceedance frequency) on the x-axis. Forthe flow-duration curves, the daily mean flows were used. An R script was used to execute the following procedure: all NA values were removed from the flow data for the station; the flow data were ranked in descending order; the exceedance probability was calculated as the rank expressed as a fraction of the total number of observations; the exceedance probability and the associated discharge were linked in a data frame; and the flow distribution curve plotted. Flow-duration curves were calculated for the river gauging stations OR1, OR2, OR3, and ER1. Where the data were incomplete, e.g., OR2, the flow-duration curves were constructed for the period where data were available.
Load-duration curves
Load-duration curves (USEPA, 2007) were calculated by multiplying the flow-duration curves by the DWS's generic ideal, acceptable and tolerable concentrations (DWA, 2011c) for TDS and S04 (Table A1, Appendix). For each gauging station, the daily mean flow for the dates when water quality data were collected were extracted from the flow database for the gauging station. The exceedance probability for the flows associated with the water quality data was then extracted from the flow-duration curve. The load for the water quality parameters was then calculated as the product of the daily mean flow and the concentration of the water quality parameter and converted to tonnes per day; see Dlamini et al. (2019). For a daily average flow in cumecs (m3-s_1) and water parameter concentration in mg-L-1, the unit conversion factor to load in t-day-1 would be (60 s-min-1 x 60 min-h-1 x 24h-day-1 x 1000 L-m-3)/1000 000 000 mg-t-1. The load-duration curves were plotted with the loads from the water quality data included as point records. Load-duration curves were calculated for the river gauging stations OR1, OR2, OR3, and ER1. Where the data were incomplete, e.g., OR2, the load-duration curves were constructed for the period where data were available.
RESULTS
Flow data from some gauging stations were not complete for the entire period of the study, e.g., OR2. The data for Mkhombo Dam were only used for water quality as the flow data were not consistent with the other stations on the Elands River.
Water quality
All water quality parameters increased in concentration, or value for pH, along the Elands River from Rust de Winter Dam (RWD) to Marble Hall (ER1) (Fig. 3). The greatest increase in concentration was between Mkhombo Dam (MKD) and Marble Hall. The Kruskal-Wallis tests returned significant results for all parameters tested. The post hoc Dunn tests showed that, with the exceptions of S04, ammonia (NH4), nitrate and nitrite (NO2+NO3), and ortho-phosphate (P04), there were significant differences in the concentrations of the water quality parameters between all three Elands River stations. For S04, NH4, NO2+NO3, and P04, there were significant differences between the Marble Hall site and the two upstream dams, but no significant differences between the two dams.
For the gauging stations surrounding Flag Boshielo Dam, the water chemistry parameters were consistently highest in the Elands River below Marble Hall (ER1), followed by the Olifants River above Flag Boshielo Dam (OR2) (Fig. 4). For most of the parameters considered, the concentrations were higher in the water exiting Flag Boshielo Dam (OR3) than in the water exiting Loskop Dam (OR1), with the exceptions of SO4, Ca and Mg. The Kruskal-Wallis tests returned significant results for all parameters tested. The post-hoc Dunn tests showed that there were significant differences in the concentrations of the water quality parameters between all four stations, with the exceptions of: SO4 between the Olifants River stations downstream of Loskop Dam OR1 and upstream of Flag Boshielo Dam OR2; Ca between the releases Loskop Dam OR1 and Flag Boshielo Dam OR3; and NH4 between the Flag Boshielo Dam release OR3 and the two Olifants River stations upstream (OR1 and OR2) and the Marble Hall station (ER1).
Time-series plots
When the water chemistry data were presented as time-series plots for Olifants River gauging stations below Loskop Dam OR1 and Flag Boshielo Dam OR3 (Figs 5 and 6, respectively), a cyclic pattern of increasing concentrations terminated by step dilutions (resets) emerges for some of the water quality parameters. When the flow data were superimposed on the EC data, it became apparent that the majority of the 'resets' corresponded with spilling and/or filling events at the respective impoundments (Fig. 7).
Pearson's correlation revealed two groups of water quality parameters: parameters correlated with EC that exhibited frequent resets due to high-flow events and those not correlated with EC that did not appear to be affected by high-flow events (Tables A2 and A3, Appendix). Parameters correlated with EC include conservative solutes, e.g., Na, K, CI, F, alkalinity, Ca, Mg and S04. Parameters present at low concentrations and/or not correlated with EC include non-conservative, or reactive, solutes, e.g., pH, Si, NH4, N03+N02, and P04. The correlation with EC was stronger at the gauging station away from large impoundments: OR1 on the Olifants River and ER1 on the Elands River (Table A2). Further, the correlation with EC was more pronounced below Flag Boshielo Dam than below Loskop Dam (Table A3).
To explore instances where water quality resets occurred without an associated spillage event, the level of the water at the dam wall, and the monthly change in water level at the dam wall, were plotted as time series with the EC and the flow recorded at the gauging stations downstream of the two Olifants River impoundments, OR1 and OR3, respectively (Fig. 7). II is apparent that, for both Loskop and Flag Boshielo dams, resets in the EC occur in conjunction with filling events, such as in December 2001 and March-April 2004, and not just from spillage over the dam walls. Both the aforementioned events had an increase in the impoundment water level without a high-flow event at the gauging stations below the impoundments. In contrast, a high-flow event was recorded between March and July 2006 at the gauging station below Flag Boshielo Dam but not reflected in the spillage data for the dam.
An analysis of the duration of annual spilling from the impoundments showed that for 6 of the 20 years evaluated, there was no spillage from the impoundments, including 5 years when both impoundments did not spill (Table 1). On average, Loskop Dam spilled for 25.7% of the year while Flag Boshiclo Dam spilled for 28.2% of the year. For both impoundments, the number of days spilling per year was lower than the average in 9 years. Loskop Dam spilled for 6% of the year in below-average years and 50% of the year in above-average years. Similarly, Flag Boshielo Dam spilled for 8% of the year in below-average years and 53% of the year in above-average years. The longest period of above-average spilling was between July 2007 and June 2011 where both impoundments spilled for more than 50% of the year for 4 consecutive years (Table 1). The longest periods for below-average spilling were between July 2001 and June 2005 where there was no spilling from Loskop Dam for 4 consecutive years and from Flag Boshielo Dam for 3 consecutive years. Similarly, between July 2014 and June 2018 there was below-average spilling from Flag Boshielo Dam for 4 consecutive years and for 3 consecutive years for Loskop Dam. Loskop Dams spilling between July 2017 and June 2018 was above average while Flag Boshielo Dam did not spill until March 2017 due to the exceptionally low water levels in the impoundment in late 2016 and early 2017 (see Sara et al., 2021b).
Flow-duration curves
For the 20-year period reviewed, 7 305 daily mean flow records were expected for each gauging station. Gauging station OR2 was only operational for the first 4 664 days while the three other stations were operational for the entire 7 305 days. A daily mean flow of 0 m3s_1 was recorded at OR2 for 570 days of the stations 4 664 operational days; 12.2% of records. A daily mean flow of 0 m3s 1 was recorded for 393 days at OR1 (5.4% of records) and for 1 221 days at ER1 (16.7% of records).
The 20-year flow-duration curves for the gauging stations immediately upstream of Flag Boshielo Dam on the Olifants and Elands rivers, OR2 and ER1 respectively, exhibited relatively steep slopes indicating rivers with high variability in flow (Fig. 8). In contrast, the flow-duration curves for gauging stations below Loskop and Flag Boshielo dams, OR1 and OR3, respectively, exhibit flat slopes characteristic of regulated rivers with controlled flows making the bulk of the duration curve, indicating low flow variability and low frequencies of high flows (Fig. 8). The greater variability in flow shown at OR2, which lies between Loskop and Flag Boshielo dams, is likely due to free-flowing tributaries of the Olifants River between the impoundments, in particular the Moses River (Fig. 2).
Load-duration curves
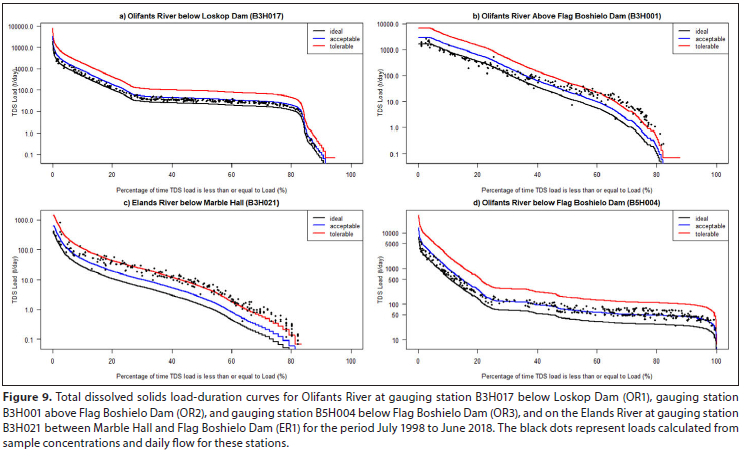
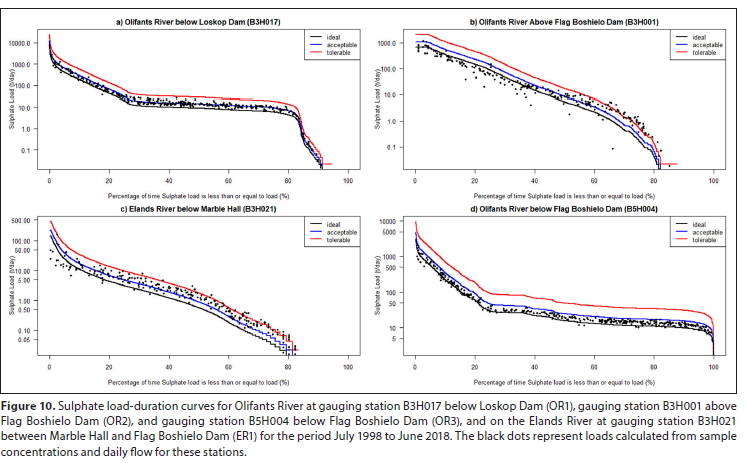
Load-duration curves for TDS (Fig. 9) and S04 (Fig. 10) were prepared for the river gauging stations on the Olifants and Elands rivers; ORl, OR2, OR3, and ER1. In all cases, the exceedance of the 'tolerable' and 'acceptable' loads increased with decreasing flow. For the gauging station below Loskop Dam ORl, the loads of TDS and S04 exceeded the 'tolerable' in 1% of the observations (Fig. 9a). For S04, the loads exceeded the 'acceptable' level in 41% of the observations, while the 'acceptable' level was only exceeded in 4% of the observation for TDS (Fig. 10a).
For the gauging station upstream of Flag Boshielo Dam OR2, the TDS load exceeded the 'tolerable' load in 15% of the observations (Fig. 9b). Loads in excess of the 'tolerable' TDS level were observed when the flow was greater than the 60th percentile of the flow. The TDS load exceeded 'acceptable' in 65% of the observations. For SO4, the load exceeded 'tolerable in 4% of observations and acceptable' in 42% of the observations (Fig. 10b).
For the gauging station on the Elands River ER1, the TDS load exceeded 'tolerable' in almost 60% of observations (Fig. 9c). Loads in excess of the 'tolerable' TDS level were observed when the flow was greater than the 20th percentile of the flow. The TDS exceeded 'acceptable' loads for 94% of the observations. For S04, the load exceeded 'tolerable' in 15%, and 'acceptable' in 65% of observations (Fig. 10c).
For the gauging station downstream of Flag Boshielo Dam, OR3, the TDS load did not exceed 'tolerable', but exceeded 'acceptable for 49% of the observations (Fig. 9d). For S4, the load did not exceed'acceptable' (Fig. 10d).
DISCUSSION
The Olifants River and its major tributaries above Flag Boshielo Dam all have one or more major impoundments, resulting in the Olifants River and the Elands River at Flag Boshielo Dam being highly regulated. Analysis of the spilling events and gauging station data below the impoundments suggests that the Olifants River experiences wet periods of frequent high-flow events and dry periods without high-flow events. However, an analysis of the change in water levels at both impoundments (Fig. 7 lower panel) shows that there are frequent filling events at both impoundments, almost annually, many of which are not reflected in the spillage from the impoundment because the impoundment did not fill to spilling capacity. The regulation of the flow of the rivers entering Flag Boshielo Dam implies that high-flow events downstream of Flag Boshielo Dam only occur when Flag Boshielo and all the upstream impoundments are filled to capacity and spilling.
This condition is only likely to occur following substantial rainfall in the catchments upstream during the wet season. When impoundments upstream are not filled to capacity, flow from rainfall events in the catchments of these impoundments is likely to be retained in the impoundments until they reach full capacity However, the magnitude of the filling events varied between years, an indication of the inter-annual variability in rainfall in the upper Olifants River sub-catchment.
The analysis of the water chemistry in the Elands River shows a major increase in all parameters from Mkhombo Dam (MKD) to the gauging station downstream of Marble Hall ER1. The towns of Marble Hall and Groblersdal are both supplied from the irrigation canal on the west bank of the Olifants River (DWA, 2011a, b; DWS, 2015). The Olifants River also shows a considerable increase in the concentrations of the water quality parameters between Loskop Dam and Flag Boshielo Dam.
In the middle Olifants River, the annual PET is about three times the annual rainfall; therefore, the increase in the chemical concentrations in the river and impoundment water is most likely due to evaporation, although the influx of contaminants from poorly operating wastewater treatment works, or other pollution sources, e.g., agriculture, can't be discounted. The TDS and S04 concentrations of for the Olifants River above Flag Boshielo Dam OR2 and the gauging station downstream of Marble Hall ER1 both frequently exceeded the 'tolerable' concentrations set by the DWS, especially during the low flows that are prevalent for the majority of the year. In addition, the 'tolerable' concentrations for Na, CI, and alkalinity were also exceeded for most observations at these gauging stations. The drivers for the unacceptably high concentrations for these parameters at these stations need to be identified by the DWS, catchment management agencies, the local municipalities, and wastewater treatment operations, with mitigation measures introduced by the local municipality, and supervised by the catchment management agency and the DWS to improve the water quality at these stations, reduce environmental impacts, and bring the water quality of the Olifants and Elands rivers to acceptable concentrations for industrial, agriculture, irrigation, and aquaculture/inland fisheries. Acid mine drainage is recognised as the major driver of metal contamination in the Olifants River (McCarthy, 2011, Netshitungulwana and Yibas, 2012) while the agricultural sector is recognised as the major contributor to pesticide (Ansara-Ross et al., 2012, Bollmohr et al., 2008) and nutrient pollution (Ashton and Dabrowski, 2011, McCartney et al., 2007). However, phosphate and organic inputs from domestic sources may also be substantial from the poorly maintained and overloaded wastewater treatment works (Ashton and Dabrowski, 2011).
Lakes and impoundments have been identified as sinks of reactive chemicals, including nutrients, metals and some salts (Shaughnessy et al., 2019, Winter et al., 2001). With sufficient residence time, the precipitation of low-solubility compounds (e.g., transition metals), adsorption of ions onto suspended solids, or the uptake of chemicals into biota, both as nutrients or through bioaccumulation (Di Toro et al., 2001), should sequester most of the reactive chemicals entering the impoundment to the sediment or biota. The concentrations of non-conservative, or reactive, ions and pH appear to be independent of the high-flow resets, e.g., P04, NH4, N03+N02, and Si. The historical water-chemistry data showed a gradual increase in the concentrations of several conservative water chemistry parameters, e.g., EC, Na, Ca, Mg, CI, alkalinity, and S04, for the water leaving Flag Boshielo and Loskop dams during periods of low flow, followed by discrete dilution 'resets' coincident with high-flow events that increased the level of the impoundments (filling events), or resulted in the impoundment spilling (Fig. 7). The gradual increase in the concentration of conservative chemicals is likely due to evaporation, considering the high PET relative to rainfall for the region, while the resets clearly result from dilution due to high water influx.
Gauging stations immediately upstream of Flag Boshielo Dam (OR2 and ER1) exhibited high variability of inter-day flows and water chemistry. However, the water leaving Loskop and Flag Boshielo dams (OR1 and OR3) showed stable inter-day flows, due to regulated releases from the impoundments, and lower variability in water chemistry, due to the mixing of water within the impoundment smoothing the variability of the chemical concentrations in the water column. The flow-duration curves for the gauging stations immediately upstream of Flag Boshielo Dam (OR2 and ER1) had steeper slopes than those for the gauging stations downstream of the impoundments (OR1 and OR3). The steeper slope of the flow-duration curve is characteristic of rivers with high flow variability, while a shallower slope is indicative of greater river regulation. It is curious that the regulated releases from Loskop Dam (OR1) should result in a higher flow variability at the downstream gauging station above Flag Boshielo Dam (OR2); however, the absence of regulation of the tributaries that confluence with the Olifants River between the two impoundments may contribute to the greater flow variability at OR2. The largest of these tributaries is the Moses River; however, flow and water quality data for the tributaries were not available. For the gauging station on the Elands River below Marble Hall ER1, the effluent from the Marble Hall wastewater treatment plant may be a dominant driver for the variability in flow and the considerable increase in the water parameter concentrations relative to Mkhombo Dam.
The flow-duration curves for the gauging stations below Loskop and Flag Boshielo dams exhibit characteristics of regulated rivers: high flows occur at low durations, while controlled flows make up the bulk of the flow-duration curves. The releases from Flag Boshielo Dam are greater and more consistent than the releases from Loskop Dam (Fig. 8). The larger releases from Flag Boshielo Dam are probably necessary for supplying the downstream platinum mines and the inter-basin transfer to Polokwane via the Sand River catchment (Fig. 1). It is not clear whether the higher releases from Flag Boshielo Dam incorporate an ecological flow component. There are periods when no releases from Loskop Dam occur, but this does not appear to be a frequent event for Flag Boshielo Dam, as flow is reported nearly 100% of the time in the flow-duration curve (Fig. 8). The Olifants River Water Resources Development Project proposes that Flag Boshielo Dam and De Hoop Dam, located on the Steelpoort tributary of the Olifants River (Fig. 1), be operated as a single functioning system (DWS, 2015). However, no integrated operating rules have yet been developed for the impoundments within the Olifants River catchment and operating rules are individually specified for each impoundment (DWS, 2019). Loskop and Flag Boshielo dams are currently under the custodianship of the national DWS and are managed collaboratively with local irrigation boards, water user associations, water boards, and other users. It has been suggested that the full ecological reserve requirements be phased in over a number of years to allow for various intervention strategies (e.g., eliminating unlawful use, clearing of alien vegetation) while continuing water use developments (e.g., supply to mining) (Wambuiet al., 2016).
There is rising pressure to utilise South Africa's inland waters for fisheries (Hara and Backeberg, 2014, Sara et al., 2021a). However the establishment of inland fisheries requires that the fish products should be safe for long-term human consumption (Weyl et al., 2021). Flag Boshielo Dam has been suggested as a suitable impoundment for an inland fishery and aquaculture (Britz et al., 2015, Sara et al., 2021a). However, the consumption of fish from Flag Boshielo Dam could be harmful to human health, especially because of metal contamination (Sara et al., 2021b). Several studies based on 2009 surveys raised concern regardingthe concentrations of certain metals in fish muscle (Addo-Bediako et al., 2014a, b; Jooste et al., 2014, 2015; Marr et al., 2015). However, subsequent studies reported fewer concerning results (Lebepe et al., 2016; Sara et al., 2018; Sara et al., 2017). It is unclear whether the results from the 2009 surveys were anomalous, or indicative of macro-scale drivers in the Olifants River catchment, e.g., environmental cycles.
CONCLUSION
This analysis of 20 years of data for the middle Olifants River describes observable patterns in the water quality, but insights into the environmental drivers controlling these parameters have proven to be elusive (Saraet al., 2021b). The values of non-reactive parameters increase when the water levels in the impoundments are receding, but are reset through dilution by high-flow events that substantially increase the level of the impoundment, or cause the impoundment to spill. Regrettably, the DWS has not measured the water parameters at any of the sites used in this study since mid-2018. We recommend that DWS resume sampling as soon as funds are available. The monitoring network should be expanded to include measurements of metal and organic chemical/pesticide concentrations in the water column, as recommended in DWS (2017a). Understanding the relationships between water quality toxic chemicals, and the flow dynamics is important for the management of the middle Olifants River as a water source for agricultural, irrigation, industrial, and domestic uses, but also for the long-term sustainability of the river as a socio-ecological system. Further work is required to identify the drivers of water quality in the middle Olifants River to construct management plans for the impoundments that will allow for the sustainable use of these impoundments for water supply, recreation, and fisheries development.
ACKNOWLEDGEMENTS
The authors would like to thank the anonymous reviewers for their input through the peer review process. The authors thank the Water Research Commission for funding this research project (WRC Project No. K5/2544), the South African Research Chairs Initiative of the Department of Science and Innovation and National Research Foundation of South Africa for additional funding through the DSI-NRF SARChI Chair Ecosystem Health (Grant No 101054), the United States Agency for International Development, under a USAID Southern Africa grant - RFA-674-12-000016 RESilience in the LIMpopo Basin Program (RESILIM). The RESILIM-O part of the programme was implemented by the Association for Water and Rural Development (AWARD), in association with project partners. Any opinion, findings, conclusions or recommendations expressed are those of the authors, and, therefore, the funding agencies do not accept any liability for them.
AUTHOR CONTRIBUTIONS
SMM conceptualised the study, conducted the data analysis and interpretation, andledthewriting. DCHRassistedinthecollection, analysis and interpretation of the data, current developments and management strategy recommendations for the middle Olifants River, recommended data analysis methodologies, and helped in the interpretation of the results. JRS and WJLP aided in the conceptualisation of the study, interpretation of results, and performed critical revisions of the manuscript.
ORCIDS
SM Marr: https://orcid.org/0000-0001-8655-5522
DCH Retief: https://orcid.org/0000-0003-3891-998X
JR Sara: https://orcid.org/0000-0003-2856-3529
WJ Luus-Powell: https://orcid.org/0000-0001-8264-4376
REFERENCES
ADDO-BEDIAKO A, MARR SM, JOOSTE A and LUUS-POWELL WJ (2014a) Are metals in the muscle tissue of Mozambique tilapia a threat to human health? A case study of two impoundments in the Olifants River, Limpopo, South Africa. Int. J. Limnol. 50 201-210. https://doi.org/10.1051/limn/2014091 [ Links ]
ADDO-BEDIAKO A, MARR SM, JOOSTE A and LUUS-POWELL WJ (2014b) Human health risk assessment for silver catfish Schilbe intermedias Rüppell, 1832, from two impoundments in the Olifants River, Limpopo, South Africa. Water SA. 40 (4) 607-613. https://doi.org/10.4314/wsa.v40i4.5 [ Links ]
ANSARA-ROSS TM, WEPENER V, VAN DEN BRINK PJ and ROSS MJ (2012) Pesticides in South African fresh waters. Afr. J. Aquat. Sci. 37 (1) 1-16. https://doi.org/10.2989/16085914.2012.666336 [ Links ]
ASHTON PJ (2010) The demise of the Nile crocodile (Crocodylus niloticus) as a keystone species for aquatic ecosystem conservation in South Africa: The case of the Olifants River. Aquat. Conserv.: Mar. Freshwater Ecosyst. 20 489-493. https://doi.org/10.1002/aqc.1132 [ Links ]
ASHTON PJ and DABROWSKI JM (2011) An overview of water quality and the causes of poor water quality in the Olifants River Catchment, WRC Project No. K8/887. Water Research Commission, Pretoria. [ Links ]
AWARD and USAID (2020) The Olifants River Catchment: A users guide, AWARD and USAID. URL: http://award.org.za/wp/wp-content/uploads/2019/01/The-Olifants-River-Catchment-User-Guide.pdf (Accessed 16 March 2021). [ Links ]
BOLLMOHR S, THWALA M, JOOSTE S and HAVEMANN A (2008) An assessment of agricultural pesticides in the Upper Olifants River Catchment. Report No. N/0000/REQ0801. Resource Quality Services, Department of Water Affairs and Forestry, Pretoria. [ Links ]
BRITZ PJ, HARA MM, WEYL OLF, TAPELA BN and ROUHANI QA (2015) Scoping study on the development and sustainable utilisation of inland fisheries in South Africa. Volume 1: Research Report. WRC Report No. TT 615/1/14. Water Research Commission, Pretoria. [ Links ]
DABROWSKI J, OBERHOLSTER PJ and DABROWSKI JM (2014) Water quality of Flag Boshielo Dam, Olifants River, South Africa: historical trends and the impact of drought. Water SA. 40 (2) 345-358. https://doi.org/10.4314/wsa.v40i2.17 [ Links ]
DAVIE T and QUINN NW (2019) Fundamentals of Hydrology. Routledge, London. [ Links ]
DE VILLIERS S and MKWELO ST (2009) Has monitoring failed the Olifants River, Mpumalanga? Water SA. 35 (5) 671-676. https://doi.org/10.4314/wsa.v35i5.49193 [ Links ]
DI TORO DM, KAVVADAS CD, MATHEW R, PAQUIN PR and WINFIELD RP (2001) The persistence and availability of metals in aquatic environments. International Council on Metals and the Environment, Ottawa, Canada. [ Links ]
DLAMINI S, GYEDU-ABABIO TK and SLAUGHTER A (2019) The loading capacity of the Elands River: a case study of the Waterval Boven Wastewater Treatment Works, Mpumalanga Province, South Africa. J. Water Resour. Protect. 11 (8) 1049-1063. https://doi.org/10.4236/jwarp.2019.118062 [ Links ]
DU PLESSIS A (2019) Water as An Inescapable Risk: Current Global Water Availability, Quality and Risks With a Specific Focus on South Africa. Springer Nature, Cham, Switzerland. [ Links ]
DWA (Department of Water Affairs, South Africa) (201 la) Development of a reconciliation strategy for the Olifants River Water Supply System: Main Report with executive summaries of reconciliation strategies. Report prepared by Aurecon and Associates. Report no.: P WMA 04/B50/00/8310/15. Department of Water Affairs, Pretoria. [ Links ]
DWA (Department of Water Affairs, South Africa) (2011b) Development of a reconciliation strategy for the Olifants River water supply system: Water requirements and water resources report. Report prepared by Aurecon and associates. Report no.: P WMA 04/B50/00/8310/6. Department of Water Affairs, Pretoria. [ Links ]
DWA (Department of Water Affairs, South Africa) (201 lc) Directorate Water Resource Planning systems: Water quality planning, Resource Directed Management of Water Quality. Planning Level Review of Water Quality in South Africa. Sub Series No. WQP 2.0. Department of Water Affairs, Pretoria. [ Links ]
DWAF (Department of Water Affairs and Forestry, South Africa) (1996) South African Water Quality Guidelines, Volume 7: Aquatic Ecosystems. Department of Water Affairs and Forestry, Pretoria. [ Links ]
DWS (Department of Water and Sanitation, South Africa) (2015) Olifants River Water Supply System Reconciliation Strategy 2015, Olifants River Water Supply System Reconciliation Strategy (Continuation Phase 1): (WP 10575). P WMA 04/B50/00/8715. Report by C Talanda B Haasbroek and P van Rooyen of WRP and Hydrosol for DWS Directorate: National Water Resource Planning. Department of Water and Sanitation, Pretoria. [ Links ]
DWS (Department of Water and Sanitation, South Africa) (2017a) Review, evaluation and optimisation of the National Water Resources Monitoring (NWRM) Network Project [online]. URL: http://www.dws.gov.za/Projects/NWRM/documents.aspx (Accessed 24 June 2021). [ Links ]
DWS (Department ofWater and Sanitation, South Africa) (2017b) Surface water quality for the Olifants River, Water Management Systems. Institute for Water Quality Studies, Department of Water and Sanitation, Pretoria. URL: http://www.dwaf.gov.za/iwqs/wms/data/B_reg_WMS_nobor.kmz (Accessed 7 April 2020). [ Links ]
DWS (Department of Water and Sanitation, South Africa) (2019) The development of operating rules for water supply and drought management for stand-alone dams/schemes (Northern Cluster): Olifants (Sekhukhune) Water Supply - 2019/20 Operating Rule Report - 2018/19 System Performance Review. Department of Water and Sanitation, Pretoria. [ Links ]
DWS (Department of Water and Sanitation, South Africa) (2020a) River hydrological data, Hydrological Services, Department of Water and Sanitation, Pretoria. URL: https://www.dws.gov.za/Hydrology/Default.aspx (Accessed 7 April 2020). [ Links ]
DWS (Department of Water and Sanitation, South Africa) (2020b) Surface water quality, Water Management Systems, Institute for Water Quality Studies, Department of Water and Sanitation, Pretoria. URL: https://www.dws.gov.za/IWQS/Default.aspx (Accessed 7 April 2020). [ Links ]
HARA MM and BACKEBERG GR (2014) An institutional approach for developing South African inland freshwater fisheries for improved food security and rural livelihoods. Water SA. 40 (2) 277-286. https://doi.org/10.4314/wsa.v40i2.10 [ Links ]
HEATH R, COLEMAN T and ENGELBRECHT J (2010) Water quality overview and literature review of the ecology of the Olifants River. WRC Report No. TT 452/10. Water Research Commission, Pretoria. [ Links ]
JOOSTE A, LUUS-POWELL WJ and ADDO-BEDIAKO A (2013) The impact of water and sediment quality on the health of fish and the diversity of fish parasites in two impoundments of the Olifants River, Limpopo Province. WRC Project No. 1929/1/12. Water Research Commission, Pretoria. [ Links ]
IOOSTE A, MARR SM, ADDO-BEDIAKO A and LUUS-POWELL WJ (2014) Metal bioaccumulation in the fish of the Olifants River, Limpopo province, South Africa, and the associated human health risk: A case study of rednose labeo Labeo rosae from two impoundments. Afr. J. Aquat. Sci. 39 271-277. https://doi.org/10.2989/16085914.2014.945989 [ Links ]
IOOSTE A, MARR SM, ADDO-BEDIAKO A and LUUS-POWELL WJ (2015) Sharptooth catfish shows its metal: a case study of metal contamination at two impoundments in the Olifants River, Limpopo river system, South Africa. Ecotoxicol. Environ. Saf 112 96-104. https://doi.Org/10.1016/j.ecoenv.2014.10.033 [ Links ]
KNIGHT J and FITCHETT JM (2019) Climate change during the late quaternary in South Africa, in Knight J and CM Rogersons (eds) The Geography of South Africa. World Regional Geography Book Series. Springer, Cham. Switzerland. 37-45. [ Links ]
LEBEPE J, MARR SM and LUUS-POWELL WJ (2016) Metal contamination and human health risk associated with the consumption of Labeo rosae from the Olifants River system. Afr. J. Aquat. Sci. 41 161-170. https://doi.org/10.2989/16085914.2016.1138100 [ Links ]
MARR SM, JOOSTE A, ADDO-BEDIAKO A and LUUS-POWELL WJ (2015) Are catfish from metal-polluted impoundments safe for human consumption? A case study of two impoundments in the Olifants River, South Africa. Inland Waters. 5 215-223. https://doi.org/10.5268/IW-5.3.697 [ Links ]
MCCARTHY TS (2011) The impact of acid mine drainage in South Africa. S. Afr. J. Sci. 107 (5-6) 1-7. https://doi.org/10.4102/sajs.V107Í5/6.712 [ Links ]
MCCARTNEY MP, BOELEE E, COPIE O and MUTERO CM (2007) Minimizing the negative environmental and health impacts of agricultural water resources development in Sub-Saharan Africa. IWMI, Colombo, Sri Lanka. [ Links ]
NETSHITUNGULWANA R and YIBAS B (2012) Stream sediment geochemistry of the Olifants catchment, South Africa: Implication for acid mine drainage. In: McCullough CD, MA Lund and L Wyses (eds) Proceedings of the International Mine Water Association Symposium, 29 September - 4 October 2012. International Mine Water Association, Bunbury, Australia. 257-264. [ Links ]
OBERHOLSTER PJ and ASHTON PJ (2008) State of the nation report: An overview of the current status of water quality and eutrophica-tion in South African rivers and reservoirs, Parliamentary Grant Deliverable. CSIR, Pretoria. [ Links ]
OBERHOLSTER PJ, BOTHA AM, HILL L and STRYDOM WF (2017) River catchment responses to anthropogenic acidification in relationship with sewage effluent: an ecotoxicology screening application. Chemosphere. 189 407-417. https://doi.Org/10.1016/j.chemosphere.2017.09.084 [ Links ]
R DEVELOPMENT CORE TEAM (2022) R: A Language and Environment for Statistical Computing. URL: http://www.R-project.org (Accessed April 2022). [ Links ]
RETIEF DCH and POLLARD SP (2020) Overview of water quality and quantity Olifants River Catchment. URL: http://award.org.za/wp/wp-content/uploads/2020/05/AWARD-BROCHURE-Overview-of-water-quality-and-quantity-in-Olifants-River-catchment-2020-v2.pdf (Accessed 16/03/2021)). [ Links ]
SARA JR, MARR SM, CHABALALA NM, SMIT WJ, ERASMUS L and LUUS-POWELL WJ (2018) Human health risks of metalloids and metals in muscle tissue of silver carp Hypophthalmichthys molitrix (Valenciennes, 1844) from Lake Flag Boshielo, South Africa. Afr. J. Aquat. Sci. 43 (4) 405-411. https://doi.org/10.2989/16085914.2017.1361378 [ Links ]
SARA JR, MARR SM, HLUNGWANI HA and WEYL OLF (2021a) Case studies of fisheries potential of South African inland fisheries. In: Hara M, Muchapondwa E, Sara JR, Weyl OLF, Britz P and Tapelas BN (eds) Inland fisheries contributions to rural livelihoods: An assessment of fisheries potential, market value chains and governance arrangements. WRC Report No. 2497/1/20. Water Research Commission, Pretoria. 33-87. [ Links ]
SARA JR, MARR SM, LUUS-POWELL WJ, SMIT WJ and ADDO-BEDIAKO A (2021b) Predicting the edibility of fish in the Flag Boshielo system. WRC Report No. 2544/1/21. Water Research Commission, Pretoria. [ Links ]
SARA JR, MARR SM, SMIT WJ, ERASMUS LJC, RAPHAHLELO ME and LUUS-POWELL WJ (2017) Metal and metalloid content in Synodontis zambezensis Peters, 1852 from Flag Boshielo Dam, Limpopo Province, South Africa. Afr. J. Aquat. Sci. 42 (3) 287-291. https://doi.org/10.2989/16085914.2017.1361378 [ Links ]
SHAUGHNESSY AR, SLOAN JJ, CORCORAN MJ and HASENMUELLER EA (2019) Sediments in agricultural reservoirs act as sinks and sources for nutrients over various timescales. Water Resour. Res. 55 (7) 5985-6000. https://doi.org/10.1029/2018WR024004 [ Links ]
SIGNORELL A, AHO K, ANDEREGG N, ARAGON T, ARPPE A, BADDELEY A, BOLKER B, CAEIRO F, CHAMPELY S, CHESSEL D and co-authors (2022) DescTools: Tools for descriptive statistics. R package version 0.99.46. URL: https://cran.r-project.org/package=DescTools (Accessed April 2022). [ Links ]
USEPA (United States Environmental Protection Agency) (2007) An approach for using load duration curves in the development of TMDLs. USEPA Report No. EPA 841-B-07-006. Watershed Branch (4503T), Office of Wetlands, Oceans and Watersheds. United States Environmental Protection Agency, Washington, DC. [ Links ]
WAMBUI G, THIAM DR and KANYOKA P (2016) Economic analysis of water policy reforms in South Africa: The case of the Olifants river basin. In: Rudolf KUs (ed.) MOSA - Integrated Water Resources Management in the 'Middle Olifants" river basin, South Africa. Phase II Summary Report. Center for Development Research (ZEF), University of Bonn, Germany. 149-162. [ Links ]
WEYL OLF, BARKHUIZEN L, CHRISTISON K, DALU T, HLUNGWANI HA, IMPSON ND, SANKAR K, MANDRAK NE, MARR SM, SARA JR, et al. (2021) Ten research questions to support South Africa's Inland Fisheries Policy. Afr. J. Aquat. Sci. 46 (1) 1-10. https://doi.org/10.2989/16085914.2020.1822774 [ Links ]
WINTER LT, FOSTER IDL, CH ARLESWORTH SM and LEES JA (2001) Floodplain lakes as sinks for sediment-associated contaminants-a new source of proxy hydrological data? Sci. Total Environ. 266 (1-3) 187-194. https://doi.org/10.1016/S0048-9697(00)00745-2 [ Links ]
ZIERVOGEL G, NEW M, ARCHER VAN GARDEREN E, MIDGLEY G, TAYLOR A, HAMANN R, STUART-HILL S, MYERS J and WARBURTON M (2014) Climate change impacts and adaptation in South Africa. Wiley Interdisciplinary Reviews: Clim. Change. 5 (5) 605-620. https://doi.org/10.1002/wcc.295 [ Links ]
 Correspondence:
SM Marr
Email: erubescens@gmail.com
Received: 4 November 2021
Accepted: 29 September 2022
APPENDIX


