


Servicios Personalizados
Articulo
 Inglés (pdf)
 Articulo en XML
 Referencias del artículo
Indicadores

Links relacionados
-
 Citado por Google
 -
 Similares en Google
Compartir

 Permalink
Water SA
versión On-line ISSN 1816-7950
versión impresa ISSN 0378-4738
Water SA vol.48 no.4 Pretoria oct. 2022
http://dx.doi.org/10.17159/wsa/2022.v48.i4.3991
RESEARCH PAPER
Historical and projected climatic trends in KwaZulu-Natal: 1950-2100
Mark R JuryI, II
IGeography Dept, University of Zululand, KwaDlangezwa, South Africa
IIPhysics Dept, University of Puerto Rico Mayagüez, Puerto Rico, USA
ABSTRACT
The climate of KwaZulu-Natal, South Africa, is evaluated for historical and projected trends in the period 1950-2100. This region lies next to the warm Indian Ocean and experiences an alternating airflow imposed by subtropical easterly and mid-latitude westerly wind belts. Multi-year wet spells have diminished since 2001 and potential evaporation deficits have spread from the Tugela Valley. Although coastal vegetation is greening and sea temperatures in the Agulhas Current are warming (>0.02-yr-1), there are fewer rain days and less cloud cover. Tropical winds across southern Africa have turned toward Madagascar, re-directing moisture and convection away from KwaZulu-Natal in recent decades. Long-range coupled model projections of monthly rainfall display weak trends over the 21st century (-0.01 mm-day-1-yr-1) which are overshadowed by multi-year fluctuations (r2 = 0.04). In contrast, drying trends in potential evaporation are significant (r2 = 0.41). Forecasts of seasonal dry spells could mitigate climate change impacts in south-eastern Africa.
Keywords: KwaZulu-Natal, pattern of climate change, temporal regression, trend impacts
INTRODUCTION
KwaZulu-Natal (KZN), South Africa, lies in the subtropics, next to an anticyclone known as the Mascarene High. Humid air over the warm Mozambique Channel spills westward onto the KZN coast, maintaining a balance between precipitation and evaporation (Tyson and Preston-Whyte, 2000). Orographic uplift by the east-facing escarpment generates -14 km3 of runoff (Nel, 2009) yet demand for water resources by 12 million people is outpacing supply (Stats SA, 2022). This work is motivated by the need for guidance on the sustainable exploitation of climate-sensitive resources.
Natural climate change can be traced to astronomical orbits and collision events, geological drift, fluctuations of solar output, volcanic eruptions, and bio-chemical evolution (IPCC, 2021). The redistribution of heat and momentum between the ocean and atmosphere, and the accumulation of anthropogenic trace gases and particulates, contribute to multi-year fluctuations of the water budget and long-term warming, respectively. The subtropical climate of South Africa is modulated by the seasonal advance and retreat of tropical moisture, pulsed by transient Rossby waves and alternating subtropical easterly / mid-latitude westerly airflow (Mason and Jury, 1997; Usman and Reason, 2004; Jury, 2012; Howard et al., 2019). During KZN dry spells, troughs intensify near Madagascar in response to a warmer Indian Ocean, Pacific El Niño and expanded circumpolar westerlies (Jury, 1992; Cook, 2000; Dube and Jury, 2000; Rouault and Richard, 2005; Ratnam et al., 2014; Malherbe et al., 2016).
Although many of South Africa's natural resources are climate-sensitive (Lyon, 2009; Barimalala et al., 2020; Mbokodo et al., 2020) KZN's humid subtropical climate is more resilient and produces sugarcane (6 Mt-yr-1). maize (1 Mt-yr-1), fruit, livestock and forestry, which contributes ~3 billion USD-yr-1 (Mbhamali and Jury, 2021; Stats SA, 2022) andhosts nature reserves and scenic beaches whose tourism value exceeds 5 billion USD-yr-1. Hitayezu et al. (2014) review climate change impacts on crop yields in KZN and conclude that warming trends could limit production when accompanied by soil erosion. Prior work using the CMIP5 multi-model ensemble (Jury, 2018) found an upward trend in rainfall over KZN; however, recent analyses suggest a reversal of fortune (Ndlovu and Demlie, 2020).
The research will quantify some of the drivers of climatic trends over KZN in the period 1950-2100, using modern datasets, monthly spatial and temporal statistics, coupled climate model projections, and daily weather reanalyses. Scientific questions include:
• Where in KZN are the trends greatest?
• Which climatic elements show largest change?
• Are multi-year fluctuations below long-term change?
• Are historical and projected trends aligned?
• Are the trends 1st or 2nd order?
• Do model projections achieve consensus?
• What are the drivers of climate change in KZN?
The final question requires analysis of regional circulation trends to establish causal mechanisms - leading to novel outcomes that could guide climate change adaptation. Our key purpose is to understand why the drying trend did not emerge in earlier work.
DATA AND METHODS
Changes in rainfall, air temperature, potential evaporation, vegetation, cloudiness, geopotential height, and low-level winds have been analysed over KwaZulu-Natal. The geographical focus is 25-32.5°S, 28-34.5°E, encompassing an index area 27-30.5°S, 29-32°E excluding sea (Fig. 1a). KZN slopes south-eastward toward the Indian Ocean from western highlands that reach 3 000 m. Deep river valleys feed into a broad coastal plain, intersected on 32°E by the Lubombo Rift. The harbour city of Durban, with a population of 4 million, is centrally positioned for transport and industry.
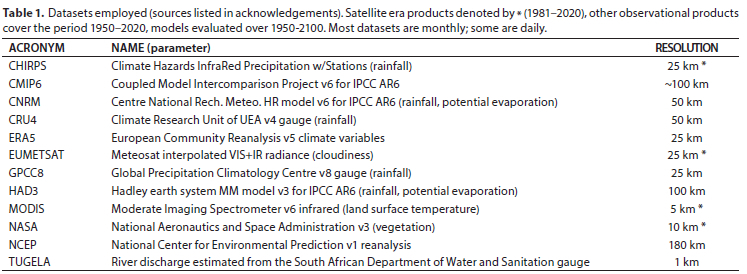
The period of historical analysis for most datasets is 1950-2020, but satellite-interpolated products are limited to 1981-2020: CHIRPS rainfall (Funk et al., 2014), EUMETSAT cloudiness (Karlsson et al., 2020), MODIS land surface temperature (Wan, 2014), and NASA vegetation (Pinzon and Tucker, 2014). Most of the climate variables have been derived from ERA5 reanalysis (Hersbach et al., 2020), except for rainfall which is averaged from CHIRPS, CRU4(Harrisetal., 2014), ERA5,andGPCC8 (Schneider et al., 2018). Projected rainfall and potential evaporation (19502100) derive from the CNRM- and HAD3-coupled general circulation models (Voldoire et al., 2019; Andrews et al., 2020) using the SSP3-7.0 scenario (Gidden et al., 2019) employed for the CMIP6 assessment. The individual models retain inter-annual variability which a multi-model ensemble tends to suppress (Von Trentini et al., 2020; Vaittinad et al., 2021). For instance, the standard deviation of KZN rainfall for an ensemble of all CMIP6 models is ~ 0.1 mm-day-1 whereas the individual models exhibit ~ 0.5 mm-day-1. Acronyms and datasets are described in Table 1.
KZN area monthly records were used to calculate the mean annual cycle for selected 20-yr eras from the mid-20th to late 21st century The continuous time series were smoothed by polynomial filter to eliminate fluctuations < 18 months and analysed for trend slope and regression fit over historical (1950-2020) and projected periods (1950-2100). The historical filtered time series have -47 degrees of freedom, requiring r2 > 0.27 for 95% confidence. The r2 fit quantifies the relative importance of long-term drift around the inter-annual fluctuations and identifies statistical significance in a straightforward way. Historical trends were extrapolated into the 21sl century for comparison with CNRM and HAD3 model projections. KZN rainfall time series 1950-2020 were spatially regressed onto annual fields of 700 hPa wind and specific humidity to identify inter-annual controls in the wider region 12-42°S, 12-52°E. Spectral periods were calculated in the filtered rainfall time series, to determine the amplitude, rhythm, and persistence of oscillations.
Spatial maps of linear trends were calculated at regional scale via NCEP reanalysis (Kalnay et al., 1996), 850-700 hPa winds and specific humidity 1950-2020. Similarly, linear trend maps were calculated at local scale for cloudiness, rainfall, potential evaporation, and vegetation to determine the pattern and impact of climate change. Although monthly data have been used in most analyses, daily values of CHIRPS rainfall, ERA5 dewpoint temperature (Td) and 925 hPa zonal winds (U) were averaged over KZN to form time series 1981-2020. A scatterplot analysis of daily Td and U wind was used to link the local circulation to moisture fluctuations. Hydrological responses were quantified by the Tugela River discharge at 28.74°S, 30.66°E, elevation 444 m in the period 1950-2020, representing a catchment -40 000 km2.
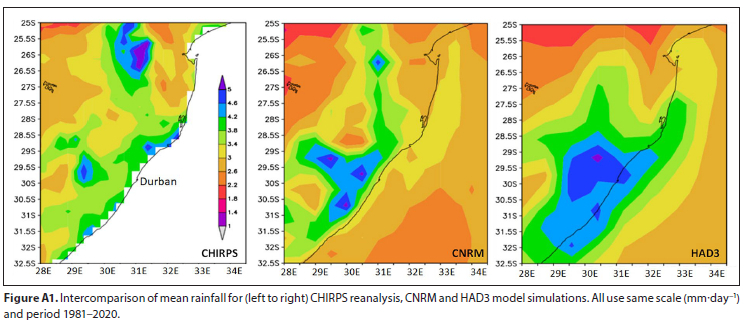
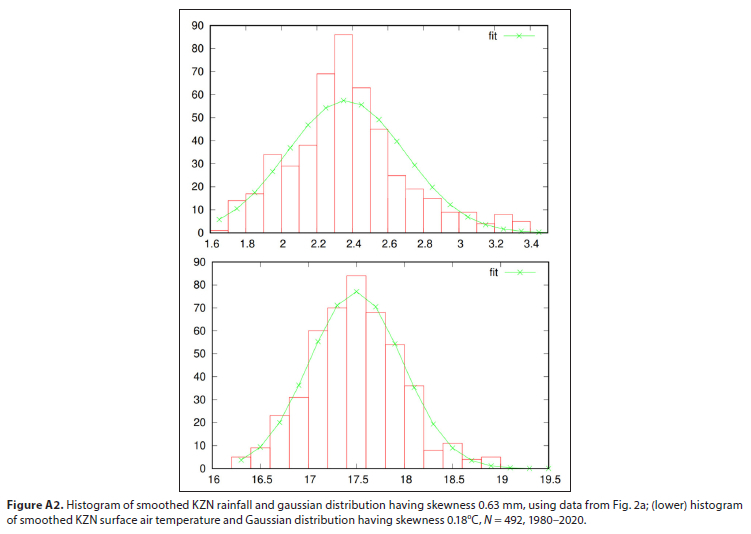
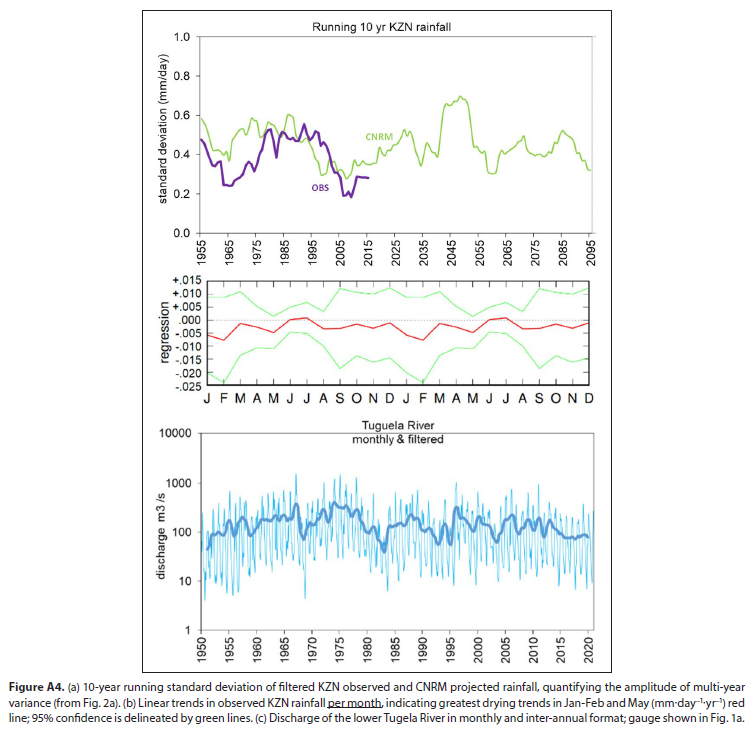
Figure A1 (Appendix) compares maps of mean rainfall for gauge-satellite and model-simulated datasets. Figure A2 (Appendix) analyses the Gaussian distribution of smoothed rainfall and air temperature histograms, to justify using Pearson's r-squared as an indicator of explained variance for linear trends. Figure A3 (Appendix) illustrates scatterplots of station and model monthly rainfall and air temperature data, as a quality check for bias and coherence. Figure A4 (Appendix) considers running variance, trends per month, and river discharge.
RESULTS
KZN climate and data density
The map of linear trends in ERA5 surface air temperature 19502020 (Fig. 1b) shows rapid warming over the coastal plains and Tugela Valley (+0.025°Gyr1) whereas weaker trends (+0.01ºC.yr-1) are evident over the ocean. The gauge network and ship reports are well distributed and frequent (Fig. 1c), lending support to products based on data assimilation and model interpolation. The mean annual cycle of KZN rainfall over 20-yr eras is compared for observed and simulated datasets (Fig. 1d; designated by the middle year, eg. 1960 = 1951-1970). Rainfall has declined - 7% evenly across the annual cycle from 1960 to 2010, comprised of maxima and minima of -4.4 mm-day-1 (Jan) and -0.5 mm-day-1 (Jul). The CNRM model follows observations closely, whereas the HAD3 model crests earlier (Nov-Jan) and exceeds 5 mm-day-1 by 2090. The CNRM projected mean annual cycle reflects drying from 2010 to 2090, particularly in late summer (Feb-Apr).
Rainfall trends and variability
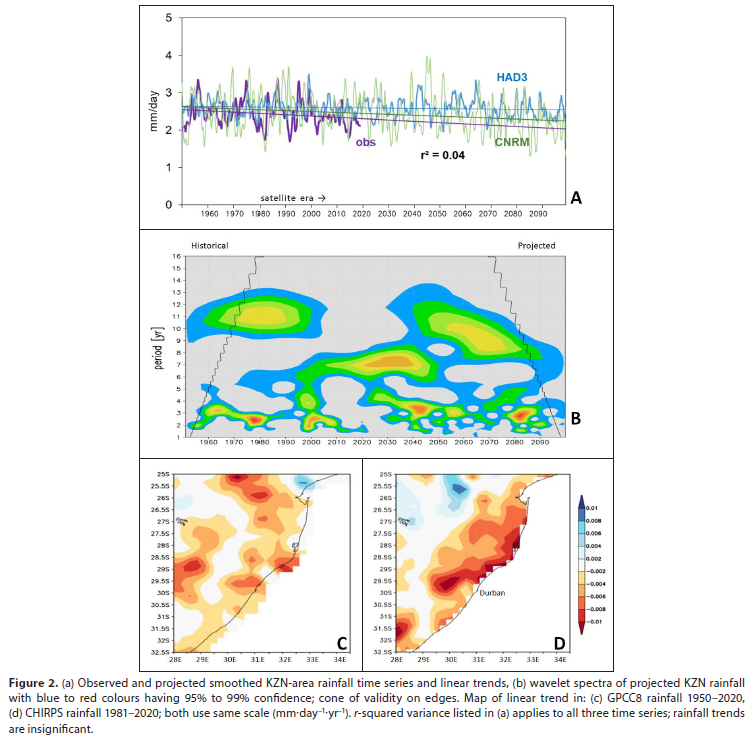
The inter-annual filtered KZN rainfall time series (Fig. 2a) fluctuates between 2 and 3 mm-day-1 and reveals a decline in multi-year wet spells since 2001. The linear trend, extrapolated from the historical record, declines from 2.6 to 2.1 mm-day-1 by the end of the 21st century, but the r2 variance is only 0.04. The same variance emerges from the linear trend in CNRM/HAD3 rainfall projections over the 1950-2100 period; far below statistical significance. Tests with 1st and 2nd order trends reveal that linear regression achieves a better fit to KZN-area time series.
The 10-yr running standard deviation ofinter-annualfilteredrainfall stays in the range 0.3-0.7 mm-day-1 (Fig. A4, Appendix), indicating little change in the amplitude of multi-year wet/dry oscillations. CNRM-projected KZN rainfall declines to 2.3 mm-day-1 by 2100, whereas the HAD3 output shows little change, due to a shift in rainfall from Feb-Apr to Nov-Jan (cf. Fig. 1d). Spectral analysis (Fig. 2b) identifies oscillations of 2-3 yr and 10-12 yr across the 21st century, which derive from the Indian Ocean Dipole, decadal component of the Pacific El Nino Southern Oscillation and the Southern Annular Mode (Jury, 2015; Morioka et al., 2015).
Spatial maps of linear trends in gauge interpolated rainfall are given in Fig. 2c, d. Both products show downward trends -0.01 mm-day-1: the drying in GPCC8 spreads inland 1950-2020 while CHIRPS is confined to the eastern coastal plains 1981-2020, similar to Ndlovu and Demlie (2020, their Fig, 6). Considering linear trends per month, Jan, Feb and May exhibit declines in KZN-area rainfall over the 70-yr historical record (Fig. A4).
Regional controls, daily features
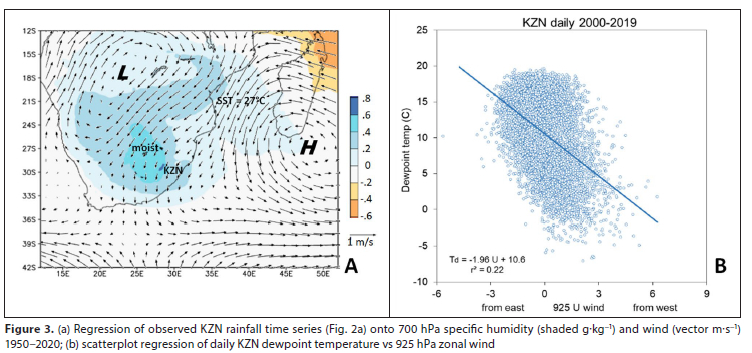
By regressing the observed KZN rainfall time series (Fig. 2a) onto fields of 700 hPa specific humidity and wind, a map is generated that illustrates the drivers of moist convection (Fig. 3a). This will be useful for comparison with linear trends over the period 1950-2020. A low over the Zambezi (17°S, 23°E) and a high near Madagascar (27°S, 48°E) form a 700 hPa circulation pair that draws tropical air southward over Mozambique. The poleward flow undergoes gradual rising motion due to increasing Coriolis, entraining moisture toward southern Africa at the expense of northern Madagascar. The tropical airflow penetrates into the mid-latitude westerlies and sustains wet spells to KZN.
A scatterplot analysis of daily zonal winds and dewpoint temperature reveals howthe airflow modulates moisture (Fig. 3b). Surface easterly flow from the warm Mozambique Channel rises upslope and lifts KZN dewpoint temperature above 15°C during summer wet spells. Conversely, in winter dry spells, surface westerly flow comes from the Kalahari Desert, descends the escarpment, and warms by compression. Dewpoint temperature changes >25°C relate to zonal wind alternations < 9 m-s-1. Ndarana et al. (2020) suggests that shallow convection associated with ridging high pressure cells may decline under global warming, a topic for further study.
Local trends in vegetation, clouds, evaporation, discharge
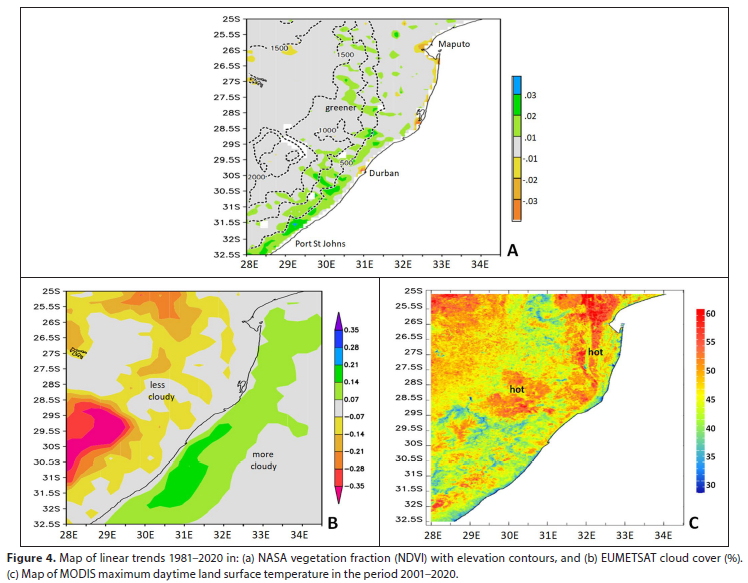
Local trend maps over the satellite era are analysed in Fig. 4a, b. Despite the tendency for drying, the vegetation colour fraction exhibits greening +0.01 yr1 over the coastal plains 1981-2020, reaching +0.03 yr1 near Port St Johns (31.5°S, 29°E). This feature may derive from photo synthetic response to rising C02 (Zhu et al., 2016) and to increased irrigation of sugarcane. The east coast of KZN and urban sprawl around harbour cities show downward trends of vegetation colour fraction (cf. Lawal et al., 2019). Linear trends in satellite cloud fraction (Fig. 4b) show diminishing cover over the escarpment (-0.2% yr1), in contrast with marine zones and the Agulhas Current (+0.2% yr1). Declining cloudiness over the Lesotho highlands could impact river discharge and water resources in KZN (Taylor et al., 2016).
Maximum land surface temperatures over the 2001-2020 period are illustrated in Fig. 4c using MODIS IR data. These reveal two main zones >50°C: the Tugela Valley and Lubombo Rift located 100 km inland. Such hot dry weather coincides with descending westerlies (berg winds) in late spring (Sep-Nov), leading to potential evaporation > 10 mm-day-1 and soil moisture deficits (Jury, 2021).
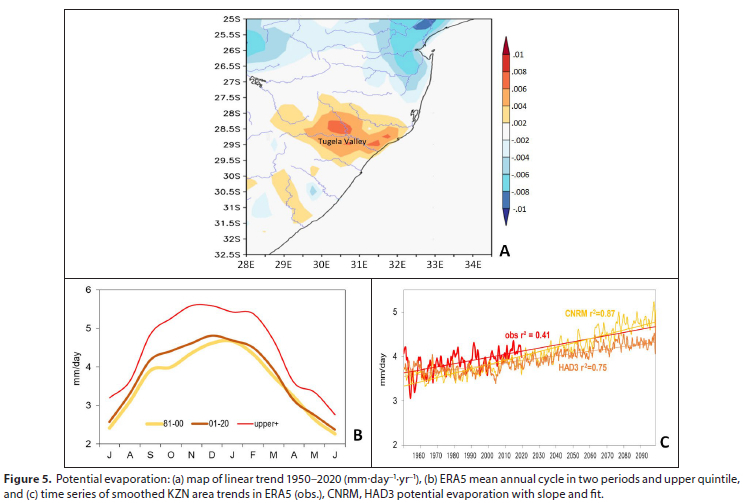
Trends in ERA5 potential evaporation are mapped in Fig. 5a and display positive values +0.005 mm-day'-yr-1 in the Tugela Valley and its northern tributaries. Evaporative losses derive from increased net solar radiation / reduced cloudiness (cf. Fig. 4b) and sensible heat flux, which extract soil moisture and put stress on water resources. The discharge of the lower Tugela River (Fig. A4) has declined -0.7 m3-s-1-yr-1 1950-2020 (cf. Kusangaya et al., 2014) but its linear trend accounts for only r2 -0.05 variance due to large inter-annual oscillations. Reductions of discharge tend tc occur in Sep-Nov; whereas trends in other seasons are flat.
Changes in the annual cycle of potential evaporation are evident (Fig. 5b) in Sep-Dcc months. Values have increased from 4.0 to 4.4 mm-day-1 from 1981-2000 to 2001-2020. Potential evaporation is projected to rise from -3.6 to 4.3 mm-day-1- by 2100 (Fig. 5c). The CNRM and HAD3 model-simulated potential evaporation alsc rises +0.01 mm-day'-yr-1, and both historical and projected linear trends are significant (r > 0.41), indicating that long-term change exceeds short-term variability. Thus climate change is leading to water deficits, as higher surface temperatures (cf. Fig. 4c) accelerate losses.
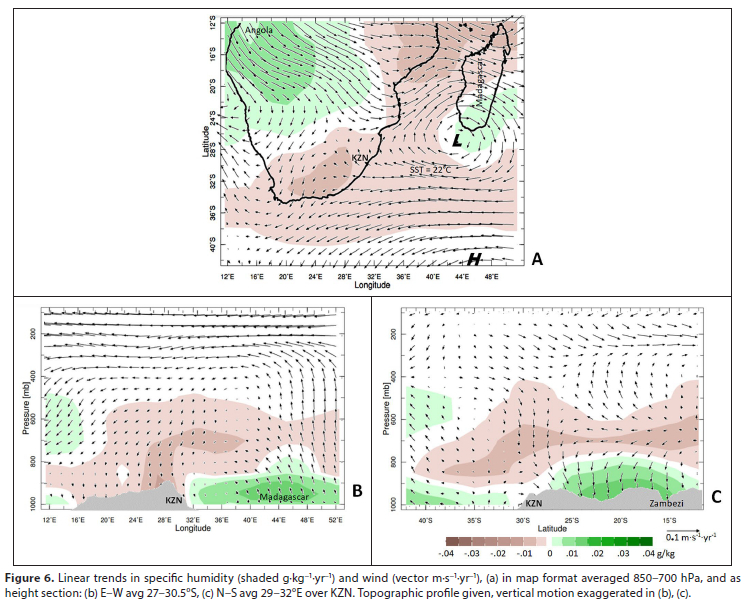
Regional trends in circulation
To better describe atmospheric drivers of climate change, regional trend maps and sections of specific humidity and winds 1950-202C are studied in Fig. 6a-c. The low-level airflow has become more easterly in the mid-latitudes, due to the retreat of circumpolar westerlies / advance of the Mascarene High (42°S, 45°E). In the tropical zone there is a trend of low-level westerlies from Angola, across the Zambezi, toward a low pressure cell near Madagascar (27°S, 43°E). The low-high pair to the east of KZN (Fig. 6a) causes a diffluent airflow and desiccation. Although the Angola outflow has moistened over time, it is directed into NW cloud bands over Madagascar. The height sections illustrate a retreating jet-stream (easterly trend) above 400 hPa linked to rising motion from 42-52°F. Although moistening is evident over the Mozambique Channel (Fig. 6b, 35-52°E) it does not penetrate into KZN (Fig. 6c) due to subsidence (700-500 hPa, 27-32°S, 22-32°E). These novel results identify how the regional circulation brings climate change to KZN.
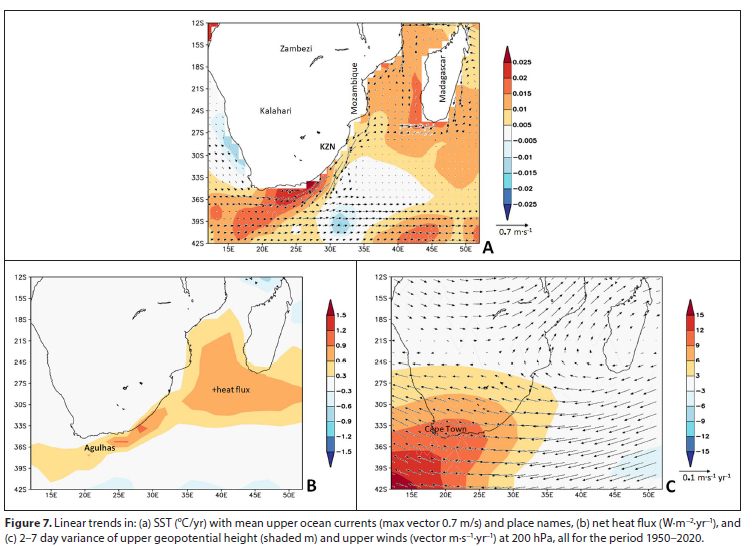
Long-term trends may derive from the marine environment, which is studied in Fig. 7a, b. Sea surface temperatures (SST) exhibit a warming trend +0.02°C-yr-1 in the Agulhas Current source and outflow regions, whereas off KZN the SST trends are weaker 1950-2020 (Fig. 7a). The net surface heat flux exhibits a trend of + 1 Wnr-yr' along the northern flank of the Mascarene High (Fig. 7b) in the Mozambique Channel. On the other hand, changes in heat flux over KZN are relatively weak. It is speculated that stronger land-sea temperature contrasts could intensify the pressure gradient, another topic for further study.
Trends in the upper level circulation are illustrated in Fig. 7c. The retreating jet-stream is evident in the latitude band 27-42°S. Mid-latitude easterlies turn northward in the Mozambique Channel to join a westerly trend across the tropics. Over the South Atlantic there is a trend of increasing 2-7 day variance in 200 hPa geopotential height, indicative of growing Rossby wave amplitudes over the warming Agulhas outflow (off Cape Town). This feature diminishes near KZN, typical of a storm 'graveyard' that could inhibit rainfall.
CONCLUSIONS
The climale of KwaZulu-Nalal, South Africa, has been evaluated for historical and projected trends in the period 1950-2100. A variety of modern observed, satellite, reanalysis, and model datasets have been employed, underpinned by sophisticated numerical data assimilation at fine spatio-temporal resolution (cf. Table 1). Although most of the outcomes from reanalysis and model projections coincide with historical observations and satellite measurements, climate change evaluations should be considered an ongoing scientific endeavour in need of regular updating. Here the statistical extraction of slope and r2 variance in KZN area-averaged time series and in regional linear trend maps for selected parameter fields over the period 1950-2100 quantified the significance: low for rainfall; high for potential evaporation. Tests with 1st and 2nd order regression fit for KZN filtered time series found that linear trends covered more variance. The various datasets and models yielded coherent outcomes, suggesting that differences are minor, and enable interpretations to guide climate change adaptation.
A linear drying trend has spread from the Tugela Valley (cf. Fig. 5a), characterized by declining wet spells (cf. Fig. 2a) and river discharge, and rising potential evaporation (cf. Fig. 5c). Although coastal vegetation is greening and sea temperatures in the Agulhas Current are warming (+0.02°C-yr_1), cloud cover is declining over KZN (cf. Fig. 4b). Tropical winds across southern Africa have gradually turned toward Madagascar in recent decades (cf. Fig. 6a), providing an answer to the motivating question: why is there a drying trend? Heat fluxes over the southern Mozambique Channel (Fig. 7b) arc entrained in a vortex over Madagascar, inhibiting convection over KZN (cf. Fig. 6a). Long-range coupled model projections of monthly rainfall display weak trends over the 21st century (-0.01 mm-day-1-yr-1) that are overshadowed by multi-year fluctuations (r2 = 0.04). In contrast, drying trends in potential evaporation are significant (r2 = 0.41).
Given that extrapolated and simulated trends show consensus, climate change impacts in KZN could be mitigated by prediction of multi-year dry spells. Further studies will consider how the changing circulation will alter the moisture supply to KZN. If a semi-arid climate spreads over the interior (Jury 2021), natural resources over the south-eastern coastal plains may need greater exploitation to keep pace with South Africa's growing demand.
ACKNOWLEDGEMENTS
Support from the South African Department of Higher Education and Training is appreciated. Much of the data analysis derives from websites: IRI Climale Library, KNMI Climate Explorer, and University of Hawaii APDRC. A spreadsheet is available from the author.
REFERENCES
ANDREWS MB, RIDLEY JK, WOOD RA, ANDREWS T, BLOCKLEY F.W, BOOTH B, BURKE F„ DITTUS AJ, PIOTR F, GRAY IJ, HADDAD S and co-authors (2020) Historical simulations with HadGEM3-GC3.1 for CMIP6. J. Adv. Model. Earth Syst. 12 e2019MS001995. https://doi.org/10.1029/2019MS001995 [ Links ]
BADENHORST P, COOPER J, CROWTHER J, GONSALVES J, LAUBSCHER W, GROBLER N, MASON TR, ILLENBERGER WK, PERRY ]E, REDDERING JSV, VAN DER MERWE L, MOLLER JP (1989) Survey of September 1987 Natal floods. South African National Scientific Programmes Report 164. CSIR, Pretoria. 136 pp. [ Links ]
BARIMALA R, BLAMEY RC, DESBOfLLES E and REASON CJC (2020) Variabilily in ihe Mozambique Channel Irough and impacls on southeast African rainfall. J Clim. 33 749-765. https://doi.org/10.1175/JCLI-D-19-0267.1 [ Links ]
COOK KC (2000) The South Indian Convergence Zone and interannual rainfall variability over southern Africa. J. Clim. 13 3789-3804. https://doi.org/10.1175/1520-0442(2000)013<3789:TSICZA>2.0.CO;2 [ Links ]
COOK BI, SMERDON JE, SEAGER R and COATS S (2014) Global warming and 21st century drying. Clim. Dyn. 43 2607-2627. https://doi.org/10.1007/s00382-014-2075-y [ Links ]
DUBE LT and JURY MR (2000) The nature of climate variability and impacts of drought over KwaZulu-Natal, South Africa. S. Afr. Geogr. J. 82 44-53. https://doi.org/10.1080/03736245.2000.9713692 [ Links ]
EYRING V, BONY S, MEEHL GA, SENIOR CA, STEVENS B, STOUFFER RJ and TAYLOR KE (2016) Overview of the Coupled Model Intercomparison Project Phase 6 (CMIP6) experimental design and organization. Geosci. Model. Dev. 9 1937-1958. https://doi.org/10.5194/gmd-9-1937-2016 [ Links ]
FUNK CC, PETERSON P, LANDSFELD M, PEDREROS D, VERDIN L SHUKLA S, HUSAK G, ROWLAND J, HARRISON L, HOELL A and MICHAELSEN J (2014) A quasi-global precipitation time series for drought monitoring: Data Series 832. United States Geological Survey, Reston, VA. https://doi.org/10.3133/ds832 [ Links ]
GIDDEN MJ, RIAHI K, SMITH SJ, FUJIMORI S, LUDERER G, KRIEGLER E, VAN VUUREN DP, VAN DEN BERG M, FENG L, KLEIN D, CALVIN K and co-authors (2019) Global emissions pathways under different socioeconomic scenarios for use in CMIP6: a dataset of harmonized emissions trajectories through the end of the century. Geosci. Model. Dev. 12 1443-1475. https://doi.org/10.5194/gmd-12-1443-2019 [ Links ]
HARRIS I, JONES PD, OSBORN TJ and LISTER DH (2014) Updated high resolution grids of monthly climatic observations-the CRU dataset.Int. J. Climatol. 34 623-642. https://doi.org/10.1002/joc.3711 [ Links ]
HERSBACH H, BELL B, BERRISFORD P, HIRAHARA S, HARANYI A, MUNOZ-SABATER J, NICOLAS J, PEUBEY C, RADU R, SCHEPERS D, SIMMONS A and co-authors (2020) The ERA5 global reanalysis. Q. J. R. Meteorol. Soc. 146 1999-2049. [ Links ]
HITAYEZU P, ZEGEYE EW and ORTMANN GF (2014) Some aspects of agricultural vulnerability to climate change in the KwaZulu-Natal Midlands, South Africa: a systematic review. J. Hum. Ecol. 48 (3) 347-356. https://doi.org/10.1080/09709274.2014.11906804 [ Links ]
HOERLING M, HURREL J, EISCHEID J and PHILLIPS A (2006) Detection and attribution of twentieth-century northern and southern African rainfall change. J. Clim. 19 3989-4008. https://doi.org/10.1175/JCLI3842.1 [ Links ]
HOWARD E, WASHINGTON R and HODGES KI (2019) Tropical lows in southern Africa: Tracks, rainfall contributions and the role of ENSO. J. Geophys. Res. Atmos. 124 11009-11032. https://doi.org/10.1029/2019JD030803 [ Links ]
IPCC (2021) Climate change 2021: the physical science basis. WG-1 report to AR6 of the Intergovernmental Panel on Climate Change. Cambridge University Press, Geneva. 2 391 pp. [ Links ]
JURY MR (1992) A climatic dipole governing the interannual variability of convection of SW Indian Ocean and SE Africa region. Theor. Appl. Climatol. 50 103-115. https://doi.Org/10.4314/wsa.v38i4.1 [ Links ]
JURY MR (2012) An inter-comparison of model simulated east-west climate gradients over South Africa. Water SA. 38 1-11. https://doi.org/10.4314/wsa.v38i4.1 [ Links ]
JURY MR (2015) Factors contributing to a decadal oscillation in South African rainfall. Theor. Appl. Climatol. 120 227-237. https://doi.org/10.1007/S00704-014-1165-4 [ Links ]
JURY MR (2018) Climate trends across South Africa since 1980. Water SA. 44 297-307. https://doi.org/10.4314/wsa.v44i2.15 [ Links ]
JURY MR (2021) Spreading of the semi-arid climate across South Africa. J. Water Clim. Change, https://doi.org/10.2166/wcc.2021.187 [ Links ]
KALNAY E, KANAMITSU M, KISTLER R, COLLINS W, DEAVEN D, GANDIN L, IREDELL M, SAHA S, WHITE G, WOOLLEN J, ZHUY and co-authors (1996) The NCEP/NCAR 40-Year Reanalysis Project. Bull. Am. Meteorol. Soc. 77 437-471. https://doi.org/10.1175/1520-0477(1996)077<0437:TNYRP>2.0.CO;2 [ Links ]
KARLSSON K-G, ANTTILA K, TRENTMANN J, STENGEL M, MEIRINK F, DEVANSTHALE A, HANSCHMANN T, KOTHE S, JAASKELAINEN E, SEDLAR J, BENAS N and co-authors (2020) CLARA-CM-SAF cloud, albedo and surface radiation dataset from AVHRR data - v2.1. Satellite Application Facility for Climate Monitoring. https://doi.org/10.5676/EUM_SAF_CM/CLARA_AVHRR/V002_01 [ Links ]
KOVACS ZP, DU PLESSIS DB, BRACHER PR DUNN P and MALLORY GCL (1985) Documentation of the 1984 Domoina floods. Technical Report. Department of Water Affairs, Pretoria. 155 pp. [ Links ]
KUSANGAYA S, WARBURTON ML, ARCHER-VAN GARDEREN E and JEWITT GPW (2014) Impacts of climate change on water resources in southern Africa: a review. Phys. Chem. Earth. 67 47-54. https://doi.Org/10.1016/j.pce.2013.09.014 [ Links ]
LAWAL S, LENNARD C and HEWITSON B (2019) Response of southern African vegetation to climate change at 1.5 and 2.0° global warming above the pre-industrial level. Clim. Serv. 16 100134. https://doi.org/10.1016/jxliser.2019.100134 [ Links ]
LYON B (2009) Southern African summer drought and heat waves: observations and coupled model behaviour. J. Clim. 22 6033-6046. https://doi.org/10.1175/2009JCLI310Ll [ Links ]
MALHERBE J, DIEPPOIS B, MALULUEKE P, VAN STADEN M and PILLAY DL (2016) South African droughts and decadal variability. Nat. Hazards. 80 657-681. https://doi.org/10.1007/s11069-015-1989-y [ Links ]
MASON SJ and JURY MR (1997) Climatic variability and change over southern Africa: a reflection on underlying processes. Prog. Phys. Geogr. 21 23-50. https://doi.org/10.1177/030913339702100103 [ Links ]
MBHAMALI TW and JURY MR (2021) Climate-sensitivity of sugarcane yield in southeastern Africa. Int. J. Climatol. 41 1-14. https://doi.org/10.1002/joc.7066 [ Links ]
MBOKODO IL, BOPAPE M-J, CHIKOORE H, ENGELBRECHT FA and NETHENGWE NS (2020) Heat waves in the future warmer climate of South Africa. Atmosphere 11. https://doi.org/10.3390/atmosll070712 [ Links ]
MORIOKA Y, ENGELBRECHT F and BEHERA SK (2015) Potential sources of decadal climate variability over southern Africa. J. Clim. 28 8695-8709. https://doi.org/10.1175/JCLI-D-15-020Ll [ Links ]
NDARANA T, MPATI S, BOPAPE M-J, ENGELBRECHT F and CHIKOORE H (2020) The flow and moisture fluxes associated with ridging South Atlantic Ocean anticyclones during the subtropical southern African summer. Int. J. Climatol. 41. https://doi.org/10.1002/joc.6745 [ Links ]
NDLOVU M and DEMLIE M (2020). Assessment of meteorological drought and wet conditions using two drought indices across KwaZulu-Natal Province, South Africa. Atmosphere 11 623. https://doi.Org/10.3390/atmosll060623https://doi.org/10.3390/atmos11060623 [ Links ]
NEL W (2009) Rainfall trends in the KwaZulu-Natal Drakensberg region of South Africa during the twentieth century. Int. J. Climatol. 29 1634-1641. https://doi.org/10.1002/joc.1814 [ Links ]
PINZON JE and TUCKER CJ (2014) A non-stationary 1981-2012 AVHRR NDVI3g time series. Remote Sens. 6 6929-6960. https://doi.org/10.3390/rs6086929 [ Links ]
POHL B, DIEPPOIS B, CRETAT J, LAWLER DM and ROUAULT M (2018) From synoptic to interdecadal variability in southern African rainfall: towards a unified view across timescales. J. Clim. 31 5845-5872. https://doi.Org/10.1175/JCLI-D-17-0405.1 [ Links ]
RATNAM J V BEHERA SK, MASUMOTO Y and YAMAGATA T (2014) Remote effects of El Nino and Modoki events on the austral summer precipitation of southern Africa. J. Clim. 27 3802-3815. https://doi.org/10.1175/JCLI-D-13-00431.1 [ Links ]
ROUAULT M and RICHARD Y (2005). Intensity and spatial extent of droughts in southern Africa. Geophys. Res. Lett. 32 L15702. https://doi.org/10.1029/2005GL022436 [ Links ]
SCHNEIDER U, BECKER A, FINGER P, MEYER-CHRISTOFFER A, RUDOLF B and ZIESE M (2018) GPCC full data monthly product version 8 surface precipitation from rain-gauges built on GTS-based and historical data. Global Precipitation Climatology Centre. https://doi.org/10.5676/DWD_GPCC/FD_M_V2018_050 [ Links ]
STATS SA (Statistics South Africa) (2022) Report on agricultural production from Statistics South Africa. URL: www.statssa.gov.za/publications/Report-11-02-01/CoCA%202017%20Fact%20Sheets.pdf (Accessed 20 February 2022). [ Links ]
TAYLOR SJ, FERGUSON JWH, ENGELBRECHT FA, CLARK VR, VAN RENSBURG S and BARKER N (2016) The Drakensberg escarpment as the great supplier of water to South Africa. In: Greenwood GB and Shroder JF (eds) Mountain Ice and Water: Investigations of the Hydrologic Cycle in Alpine Environments. Elsevier. 1-41. https://doi.org/10.1016/B978-0-444-63787-1.00001-9 [ Links ]
TYSON PD and PRESTON-WHYTE RA (2000) The Weather and Climate of Southern Africa (2nd edn). Oxford University Press. Oxford. 408 pp. [ Links ]
USMAN MT and REASON CJC (2004) Dry spell frequencies and their variability over southern Africa. Clim. Res. 26 199-211. https://doi.org/10.3354/cr026199 [ Links ]
VAITTINADA A-P, VRAC M and MAILHOT A (2021) Ensemble bias correction of climate simulations: preserving internal variability. Nature SciRep. 11 3098. https://doi.org/10.1038/s41598-021-82715-1 [ Links ]
VOLOIRE A, SAINT-MARTIN D, SENESI S, DECHARME B, ALIAS A, CHEVALLIER M, COLIN J, GUEREMY J-F, MICHOU M, MOINE M-P, NABAT P and co-authors (2019) Evaluation of CMIP6 experiments with CNRM-CM6. J. Adv. Model. Earth Syst. 11 2177-2213. https://doi.org/10.1029/2019MS001683 [ Links ]
VON TRENTINI F, AALBERS EE, FISCHER EM and LUDWIG R (2020) Comparing interannual variability in three regional single-model initial-condition large ensembles over Europe. Earth Syst. Dyn. 11 1013-1031. https://doi.org/10.5194/esd-11-1013-2020 [ Links ]
WAN Z (2014) New refinements and validation of the v6 MODIS land-surface temperature /emissivity products. Remote Sens. Environ. 140 36-45. https://doi.Org/10.1016/j.rse.2013.08.027 [ Links ]
ZHU Z, PIAO S, MYNENI RB, HUANG M, ZENG Z, CANADELL JG, CIAIS P, SITCH S, FRIEDLINGSTEIN P, ARNETH A, CAO C and co-authors (2016) Greening of the earth and its drivers. Nat. Clim. Change. 6 791-795. https://doi.org/10.1038/nclimate3004 [ Links ]
 Correspondence:
Mark R Jury
Email: mark.jury@upr.edu
Received: 21 April 2022
Accepted: 4 October 2022
APPENDIX


