


Services on Demand
Article
 English (pdf)
 Article in xml format
 Article references
Indicators

Related links
-
 Cited by Google
 -
 Similars in Google
Share

 Permalink
Water SA
On-line version ISSN 1816-7950
Print version ISSN 0378-4738
Water SA vol.48 n.4 Pretoria Oct. 2022
http://dx.doi.org/10.17159/wsa/2022.v48.i4.3920
RESEARCH PAPER
Impacts of climate change on streamflow and reservoir inflows in the Upper Manyame sub-catchment of Zimbabwe
Oliver MasimbaI, II; Webster GumindogaI; Alexander MhizhaI; Donald Tendayi RwasokaIII
IUniversity of Zimbabwe, Dept of Construction and Civil Engineering, PO Box MP167, Mount Pleasant, Harare, Zimbabwe
IIInstitute of Agricultural Engineering, PO Box BW330 Borrowdale, Harare, Zimbabwe
IIIUpper Manyame Sub-catchment Council, Box 1892, Harare, Zimbabwe
ABSTRACT
This study focused on the Upper Manyame sub-catchment which covers an area of approximately 3 786 km2 and forms part of the Manyame catchment, one of the seven catchments of Zimbabwe. Manyame catchment has its source in Marondera town and drains into the Zambezi River downstream of the Kariba Dam and upstream of the Cahora Bassa Dam, in the northern part of the country. This study assessed potential climate change impacts on the streamflow and reservoir inflows in the Upper Manyame sub-catchment. Hydrologic simulations for future climate (2030s and 2060s) were carried out using statistically downscaled bias-corrected variables from the HadCM3 (HadCM3A2a and HadCM3B2a scenarios) and CanESM2 (RCP2.6 and RCP8.5) global circulation models. The HEC-HMS hydrological model was set up for two gauged micro-catchments and eight ungauged tributary micro-catchments. Model calibration for gauged micro-catchments of Upper Manyame over the period from 2000-2010 revealed satisfactory model performance of 4.3% (RVE) and 0.1 (bias) for Mukuvisi micro-catchment and 9.5% (RVE) and 0.15 (bias) for Marimba micro-catchment. Model simulations resulted in a projected decrease in streamflow by 7.4-26.4% for HadCM3. For CanESM2, simulations resulted in a projected decrease in streamflow by 2.5-34.7%. Reservoir inflows into Lake Chivero and Lake Manyame, the main water supply sources for Harare, will decrease by 10.5-18% for HadCM3 and by 8-33.6% for CanESM2.
Keywords: CanESM2, climate change, HadCM3, HEC-HMS, reservoir inflows, streamflow
INTRODUCTION
Globally, the evidence of climate change is compelling, with sea levels rising, precipitation patterns changing, glaciers retreating, and the world getting warmer (Adedeji et al., 2014; IPCC, 2014). In Africa, there are unprecedented floods in West Africa and an increase in ocean acidity around Africa's southern coast (Urama and Ozor, 2010). Climate change projections for sub-Saharan Africa point to a warming trend, particularly in the inland subtropics, frequent occurrence of extreme heat events, increasing aridity and changes in rainfall, with a particularly pronounced decline in Southern Africa and an increase in East Africa (Serdeczny et al., 2016). Altered weather patterns and climate extremes threaten agricultural production and food security, health, water and energy security, which in turn undermine Africa's ability to grow and develop. Countries in Southern Africa have experienced temperature increases by 0.4°C over the past 100 years, and the temperatures are expected to further increase at a rate of 0.05°C per decade (Kandji et al., 2006). Inter-annual rainfall variability over Southern Africa has increased since the late 1960s, and droughts have become more intense and widespread in the region. Alternating patterns of above-normal/below-normal rainfall periods in Southern Africa have resulted in some of the most extreme wet and dry years ever recorded. As a result of these cycles, floods and droughts have affected the hydrologic, ecological and socioeconomic systems in the region (Hulme et al., 2001).
In Zimbabwe, the past few decades have shown considerable spatial and temporal variability in rainfall, characterised by shifts in rainfall onset periods, increases in the proportion of low rainfall years and increases in the frequency and intensity of mid-season droughts (Chamaille-Jammes et al., 2007; Mason and Jury, 1997). The country is being affected by climate change as evidenced by an increase in mean annual temperatures of about 0.4°C since 1900, and a 5% decline in precipitation (Unganai, 2009). According to Brazier (2015), an analysis of studies on the impacts of climate change in Zimbabwe reveals that it is likely that by 2050 and until the end ofthe century there will be a modest decrease in total amount of rainfall, changes to the onset and end of the season, more frequent and longer mid-season dry periods, reduced groundwater recharge, erratic rainfall distribution across the country as well as temperature increases of between 1°C and 3°C, which is greater than the global average. These changes are likely to lead to reduced water supply for domestic and agricultural use from both surface and groundwater sources.
Sibanda et al. (2018) analysed trends in temperature and extreme weather events in Mzingwane catchment. The results revealed a statistically significant increase in the occurrence of extreme dry events from 1980. Makuvaro et al. (2017) showed statistically significant increasing temperature changes in Gweru of 0.02°C per year over 43 years. Dube and Nhamo (2018) found significant increasing temperature trends in Livingstone, Zambia. However, there have also been contradictory results in terms of increasing or no rainfall trends in some studies, such as Makuvaro et al. (2017), Dube and Nhamo (2018) and Mazvimavi (2010). Regardless of the contrary observations, studies have shown that monotonic trends, seasonal shifts and increased hot/cold or wet/dry cycles have impacted a number of sectors and activities in Zimbabwe such as crop farming, animal husbandry, local planning and knowledge systems, wildlife and rural development initiatives.
Utete et al. (2018) assessed the impact of climatic and non-climatic factors on fish catches and species composition in Lake Chivero and Manyame. They concluded that climatic variability was contributing to the declines in fish catches and changes in species composition. Marshall (2017) noted that the thermocline in the Lake has weakened, with much smaller density and thermal gradients compared to the 1980s. Mhlanga et al.(2018) found that under climate change scenarios RCP 8.5 and 6.0 areas suitable for dairy farming will decrease by 25.4% and 2.7%, respectively. Dube and Nhamo (2018) argued that increased climate variability that they observed over Livingstone could potentially affect tourism at Victoria Falls. Jinga and Ashley (2019) argued that climate change could see a decrease in areas with wet miombo woodland species, as the areas become drier. Dry miombo areas will expand. Efforts are being made to improve weather and climate forecasting by integrating local indigenous knowledge systems (Gwenzi et al., 2016). However, literature surveys show that there has been limited work on hydrological and water resources climate change impact assessment in Zimbabwe. Whilst climate change is anticipated to significantly impact on hydrological regimes (Arnell and Gosling, 2013; Mbaye et al., 2015; Nigatu et al., 2016), there is no critical mass of knowledge on the impacts on hydro-systems in Zimbabwe.
Catchment-level hydrologic climate change impact studies need data at finer spatial and temporal scales than the ones produced by global circulation models (GCMs) (Nguyen et al., 2008). In order to bridge the spatial and temporal gap between the GCM predictions and the hydrologic scale, downscaling of GCM data is undertaken. Downscaling can be done statistically or dynamically. Statistically downscaling involves establishing some regression between the GCM data and local point data and then transforming the local catchment or point data. Dynamic downscaling involves using advanced physics, numerical weather prediction models in a telescopic framework (Maraun et al., 2010; Vaittinada Ayar et al., 2016).
Masimba et al. (2019) used the Statistical DownScaling Model (SDSM) to downscale the projected precipitation and temperature for the 2030s and 2060s with data from HadCM3 and CanESM2 in a study of the Upper Manyame sub-catchment of Zimbabwe. The projected temperature and precipitation analysis showed that the temperature will increase whilst precipitation will decrease significantly in most months. However, downscaling studies are faced with many uncertainties, which mainly emerge from uncertainties in GCMs, uncertainties in greenhouse gas (GHG) emission scenarios, issues with observations of hydroclimatic variables, issues with different statistical downscaling techniques and issues with predictor selection and prepossessing criteria (Sachindra et al., 2014). However, the finer the temporal resolution the greater the uncertainties in the GCM outputs (Prudhomme et al., 2002). The GCMs introduce uncertainty through the limitations in the modelling capturing the processes correctly, difficulties in estimation of parameter values and difficulties finding the correct numerical solution for the equations.
There are various rainfall-runoff models that can be used to estimate the impacts of climate change on hydrology. These models include: the ToPographic Model (TOPMODEL) (Beven and Kirkby, 1979), Soil and Water Assessment Tool (SWAT) (Arnold et al., 1998), Hydrologiska Byrans Vattenavdelning(HBV) (Bergstrom, 1976) and the Hydrologic Engineering Center-Hydrologic Modeling System (HEC-HMS) (USACE, 2000).
The HEC-HMS model was selected for this study mainly because it is physically based, spatially distributed and gives more details concerning the surface water resources and can be used to model reservoir inflows (HEC-HMS, 2010). HEC-HMS was designed to simulate the surface runoff response of a catchment to precipitation by representing the catchment with interconnected hydrologic and hydraulic components. Examples of the HEC-HMS model applications in African basins include Middle Zambezi in a study by Phiri (2011) involving analysis of the Cahora Bassa Dam water balance and reservoir operations and their flooding impact on upstream settlements, and in Upper Manyame by Gumindoga et al. (2016) for simulation of ungauged runoff. Few studies have been done that have applied the HEC-HMS model in the Zambezi basin for climate change impact studies. Gebre and Ludwig (2015) used HEC-HMS to simulate the impacts of climate change in the Upper Blue Nile in Ethiopia under two representative concentration pathways, RCP4.5 and RCP8.5. Ethiopia is a direct distance of approximately 3 088 km from Zimbabwe, in a direction 17° from north. The results revealed that the runoff is projected to increase by 55.7% (RCP4.5) and 74.8% (RCP8.5) during the 2030s whereas during the 2070s the runoff was projected to increase by 73.5% (RCP4.5) and 127.4% (RCP8.5).
To the best of our knowledge, the impacts of climate change on the reservoir inflows and streamflows of Upper Manyame sub-catchment have not yet been established, despite the fact that more than 2 million people in the urban area of greater Harare depend on the water resources from this sub-catchment. Previous efforts to analyse impacts of climate change on the streamflow of Upper Manyame sub-catchment focused on trend analysis and not the actual impacts of precipitation and temperature on the streamflow and reservoir inflows. Thus, this study is aimed at addressing this knowledge gap by using a rainfall-runoff model (HEC-HMS) to simulate impacts of downscaled projected precipitation and temperature on streamflow and reservoir inflows.
METHODS
Description of the study area
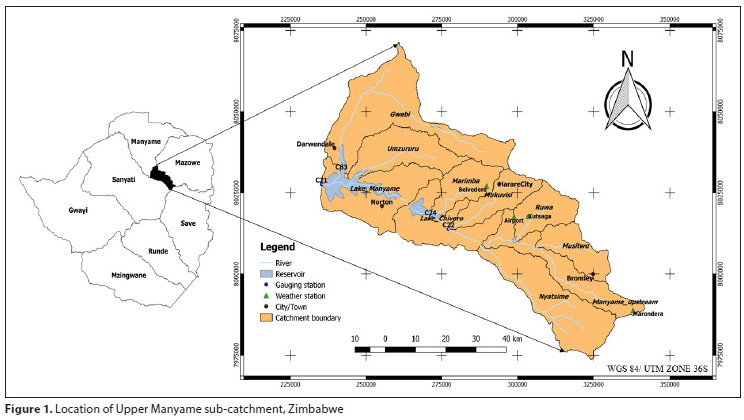
This study focused on the Upper Manyame sub-catchment in Manyame catchment, one of the seven catchments in Zimbabwe (Fig. 1). Manyame catchment has its source in Marondera town, Zimbabwe, and drains into the Zambezi River downstream of the Kariba Dam and upstream of the Cahora Bassa Dam, in the northern part of the country. In Fig. 1, on the extreme left is the map of Zimbabwe showing all the country's seven hydrological catchments. On the right side is the map of the Upper Manyame sub-catchment. The sub-catchment covers an area of approximately 3 786 km2 and originates near Marondera town, drains through rural areas and then encompasses the most urbanized area in Zimbabwe, comprising Harare, Chitungwiza, Ruwa, Norton, Darwendale and Bromely (Rwasoka et al., 2011). According to the Meteorological Services Department of Zimbabwe, the mean maximum temperature in the Upper Manyame sub-catchment is around 28°C and the mean annual rainfall is 810 mm/year. The sub-catchment is divided into two hydrological sub-zones, CH4 and CH5. This is based on the mean annual rainfall (Mazvimavi et al., 2005). Upper Manyame sub-catchment falls under Agro-ecological Region II, with CH4 and CH5 falling into agro-ecological sub-regions II (a) and II (b), respectively (Mugandani et al., 2012). Sub-region II (a) is characterized by intensive farming systems with fewer dry spells during summer, while sub-region II (b) is characterized by more severe dry spells during the rainy season or the occurrence of relatively short rainy seasons. According to Nhapi (2009), the spatio-temporal variation in the rainfall patterns in the Upper Manyame sub-catchment has increased due to the effects of climate change and/or climate variability.
The main socio-economic activities include: manufacturing industry, farming, mining, tourism and recreation. Harare, the capital city of Zimbabwe, and the surrounding satellite towns of Chitungwiza, Ruwa, Epworth and Norton are fast growing and all rely on the catchment for their water supply (Mazvimavi et al., 2005). The source of Manyame River, Marondera Town, is the provincial capital of Mashonaland East. The Upper Manyame ends at the Manyame Dam outlet. Based on ZIMSTAT (2012) census data the Upper Manyame catchment is estimated to have a population of more than 2.4 million people. Figure 1 shows the location of Upper Manyame sub-catchment.
The area has soil types which range from heavy textured clays to sandy clay loams. The heavy textured clay soils have vertic properties; the soils expand when wet and shrink and form cracks when dry. The soils are well drained on slopes and are poorly drained near drainage lines or watercourses (Mazvimavi et al., 2005). The maximum slope is 68° whilst the average slope is 19°. The sub-catchment comprises open grasslands, rain-fed and irrigated croplands, urban areas, water surfaces, and shrublands. The land cover of Upper Manyame sub-catchment as of 2016 consists of bare land (50%), settlements (22%), grasslands (20%) cultivation area (4%), water and marshy (2%) and forest (2%) (Gumindoga et al., 2016). However, the rate of increase of settlements is rapid, as a result of increased rural to urban migration.
Sources of data
Hydro-meteorological data
Daily temperature and precipitation data for Belvedere, Harare Airport, Kutsaga and Marondera meteorological stations were obtained from the Meteorological Services Department (MSD) of Zimbabwe. The daily temperature and precipitation data were from 1970 to 2013. The daily runoff data for the period 2000-2012 for Mukuvisi and Marimba gauging stations were obtained from the Zimbabwe National Water Authority (ZINWA). The percentage gaps in the temperature, precipitation and runoff data series were less than 1%, and the gaps were filled using the linear interpolation method in the Statistical Package for the Social Sciences (SPSS). The data were used for calibration and validation of the HEC-HMS model.
Global climate data
The statistically downscaled projected precipitation and temperature data from a study by Masimba et al. (2019) were used as inputs into the HEC-HMS model. The projected climate variables were acquired from two GCMs that are HadCM3 and CanESM2 of the Coupled Model Intercomparison Project phase 5 (CMIP5) experiment. The HadCM3 scenarios were HadCM3A2a (worst-case scenario with more emissions and high levels of population growth) and HadCM3B2a (emphasis on local solutions to promote socio-economic and environmental sustainability and involves the adoption of cleaner production) whilst for the CanESM2 two representative concentration pathways were used: RCP2.6 (very stringent mitigation) and RCP8.5 (business as usual). The observed baseline period (1971-2000) precipitation and temperature data and GCM generated data for the same period were compared. The projections were for the 2030s (2021-2050) and 2060s (2051-2080).
Soils and elevation data
An advanced spaceborne thermal emission and reflection radiometer global digital elevation map (ASTERGDEM) at 30m resolution was obtained from http://www.gdem.aster.ersdac.or.jp. This was used as an input for digital elevation model hydroprocessing to extract micro-catchments. Soil data were obtained from FAO GIS database. The soil data helped to estimate HEC-HMS parameters.
HEC-HMS model set up, calibration and validation
The DEM hydroprocessing was done using ILWIS software. The process of DEM hydroprocessing was carried out according to Maathuis and Wang (2006). In this case, 10 micro-catchments, namely: Gwebi, Lake Chivero basin, Lake Manyame basin, Manyame upstream, Marimba, Mukuvisi, Musitwe, Nyatsime, Ruwa, and Umzururu were extracted for the Upper Manyame sub-catchment.
The deficit and constant loss method was used for this study mainly because it is the one suitable for long periods of simulations (USACE, 2008). The constant loss rates were obtained from the Soil Conservation Service (SCS) soil groups and infiltration (loss) rates.
The percentage impervious values were estimated by exporting the Upper Manyame sub-catchment shapefile to Google Earth viewer.
The Snyder unit hydrograph method was used to model the transformation of precipitation excess into direct surface runoff. The Snyder unit hydrograph method enables the derivation of unit hydrographs for ungauged micro-catchments (Snyder, 1938).
Before transferring Snyder unit hydrograph parameters from the gauged Marimba and Mukuvisi micro-catchments to the ungauged, a catchment hydrological response similarity was first established (Sreenivasulu and Bhaskar, 2010). Data from DEM hydro-processing were used for hydrologic similarity assessment by comparing the physical catchment characteristics. Runoff and hydrograph shape are normally affected by drainage and rainfall characteristics. In this study rainfall intensity, duration, spatial and temporal distribution and storm motion were used as rainfall characteristics. Linking physical and hydrological catchment characteristics provided an understanding of the hydrological behaviour of the different micro-catchments (Sreenivasulu and Bhaskar, 2010). The Muskingum routing method, which uses a simple conservation of mass approach to route flow through the stream reach, was used for this study.
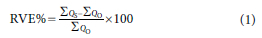
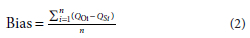
The performance of the model was assessed by comparing the simulated and observed flows in terms of the relative volume error (RVE) (Eq. 1) and the bias (Eq. 2). Values for the RVE range from -°° to +°o with 0 as the optimum value. A RVE value of 0 indicates that there is no difference between simulated and observed flow volume. A RVE between -5% and +5% indicates that a model performs well whereas a RVE between -5% and -10% and +5% and +10% indicates a model with a reasonable performance (Krause et al., 2005).
where:
ΣQS = summation of simulated discharge ΣQ0 = summation of observed discharge
where:
QOi = observed discharge for day i
QSi = simulated discharge for day i
n = total number of days for the time series
The values for bias range from -°° to +°°, but recommended values should be equal to zero or almost zero.
Meteorological model in HEC-HMS
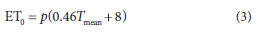
The data required for the meteorological model of HEC-HMS are precipitation, discharge (Mukuvisi and Marimba micro-catchments), evapotranspiration and the gauge weights of different weather stations. The calibration period was from 1 October 2000 to 30 September 2010, and the validation period was from 1 October 2010 to 30 September 2012. Thiessen polygons were produced in ArcGIS software to determine the spatial distribution of rainfall in the study area and also to determine the gauge weights of each rainfall station. The average monthly potential evapotranspiration was calculated using the Blaney-Criddle method. Eq. 3 shows the Blaney-Criddle formula.
where:
ET0 = potential evapotranspiration (mm/day)
p = mean daily percentage of annual daytime hours
Tmean = mean daily temperature (°C)
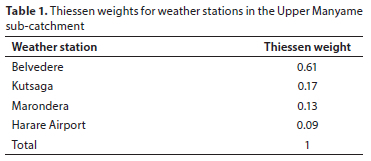
Figure 2 shows the Thiessen polygons for Upper Manyame sub-catchment showing the area of influence of each of the four weather stations: Belvedere, Harare Airport, Kutsaga and Marondera. The Thiessen weights are based on area of influence of each weather station.
Table 1 shows the Thiessen weights for each of the four weather stations in Upper Manyame sub-catchment. They are comparable to the weights obtained by Gumindoga et al. (2016) using the same interpolation technique in the ILWIS GIS software.
Simulation of the streamflow in the Upper Manyame sub-catchment
The impact of climate change on streamflow was assessed using the projected temperature and precipitation obtained from statistical downscaling as input to the calibrated HEC-HMS model. The results were compared with the baseline period with observed climate data from 2000-2010. Streamflow modelled with projected GCM-derived future climate was compared against streamflow modelled with observed historical climate. To detect if there have been any changes as a result of climate change, all the optimized parameters of the HEC-HMS model derived from the model setup in the 2000-2010 period were held constant. The parameters which were held constant included soil parameters, land cover parameters, and elevation parameters. By holding all these model parameters as constants from a reference period 2000-2010 any changes in streamflow will be explicit to climate change only. Similar techniques were used in the study by Gumindoga et al. (2014) on hydrological impacts of urbanization in Harare, Zimbabwe, whereby the model parameters were held constant to reveal the impacts explicit to urbanization only.
The simulation was done for the 2030-2040 decade and the 2060-2070 decade for scenarios HadCM3A2a and HadCM3B2a as well as RCP2.6 (very stringent mitigation) and RCP8.5 (business as usual). The decade-long simulations were chosen for comparison purposes with the reference period, which was from 2000-2010.
RESULTS AND DISCUSSION
Calibration and validation
Calibration was done using observed climate and streamflow data. The calibrated HEC-HMS model for the Marimba micro-catchment revealed a relative volume error of 9.5% and a bias of 0.15. For the Mukuvisi micro-catchment the relative volume error was found to be 4.3%, and the bias was 0.1. The positive RVEs reveal that the streamflow was somewhat overestimated by the model. The RVE value for Mukuvisi is within the range -5% to 5% which reflects a good model performance whilst that for Marimba RVE is within the range -10% to 10% which reflects a fairly reasonable performance of the model. However, the simulation resulted in an overestimation. Figures 3 and 4 show the hydrographs of observed and simulated flow for the Mukuvisi and Marimba micro-catchments.
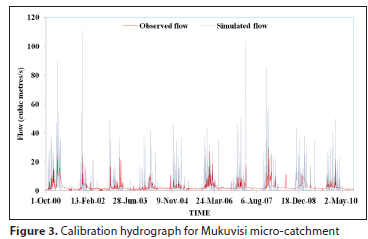
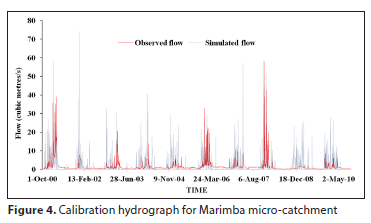
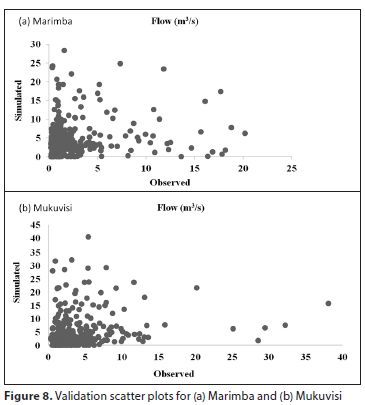
From visual inspection of the hydrographs, the simulated and observed flows are generally in sync regardless of some differences in the magnitude of peak values. The validation was done using data from 1 October 2010 to 30 September 2012. Figures 5 and 6 show the validation hydrographs for Mukuvisi and Marimba micro-catchments, respectively.
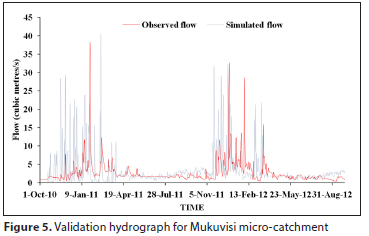
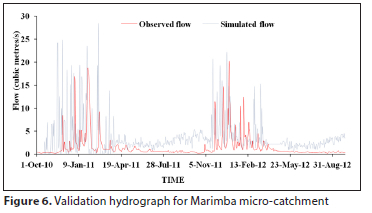
From visual inspection, the hydrographs for validation (Figs 5 and 6) show that the observed and simulated hydrographs are almost the same in terms of showing the peak and low flows for both micro-catchments. The relative volume error was however higher than that for calibration for both micro-catchments. The water uses/abstractions were not taken into account in the simulations, hence the higher simulated volumes compared to observed flow. It is recommended future studies to make efforts to capture water use/abstraction data and incorporate it in the research so as to reduce uncertainty.
Figure 7 shows the calibration scatter plots for Marimba and Mukuvisi micro-catchments.
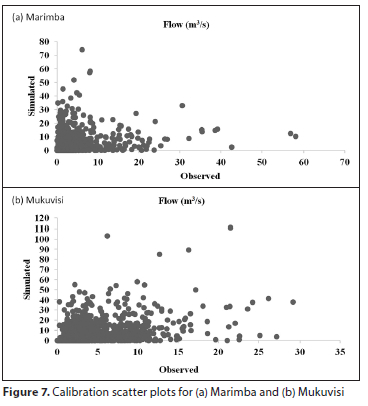
Figure 8 shows validation scatter plots for Marimba and Mukuvisi micro-catchments
Simulation results for HadCM3 scenarios
Streamflow
Table 2 shows the variation of streamflow between the baseline period (2000-2010) and the projected decades for the two scenarios HadCM3A2a and HadCM3B2a. In addition, the percentage change in streamflow is shown in brackets for each micro-catchment and scenario period. A positive percentage change reflects an increase in streamflow whilst a negative percentage change reflects a decrease in streamflow.
The results in Table 2 generally showed a decrease in streamflow for both scenarios and the two projected decades as compared to the baseline decade 2000-2010 which was used for calibration. Table 2 also shows an undersimulation of peak flow compared to observed data. It is projected that there will be a relatively lower decline in streamflow for the HadCM3B2a scenario as compared to the HadCM3A2a scenario for all the micro-catchments. Within the HadCM3A2a and the HadCM3B2a scenarios the results show that the decline in streamflow will increase with time from the 2030-2040 decade to the 2060-2070 decade. For Mukuvisi micro-catchment the streamflow is projected to decrease by 12.9% and 7.4%, respectively, for scenarios HadCM3A2a and HadCM3B2a during the decade 2030-2040 as compared to the baseline decade (2000-2010). During the decade 2060-2070 the streamflow is projected to decrease by 13.5% and 11.7% for the HadCM3A2a and HadCM3B2a scenarios, respectively. Umzururu micro-catchment is projected to have the highest decline in streamflow which will be at most 26.4% for the HadCM3A2a scenario.
However, some micro-catchments, notably Mukuvisi, Ruwa, Musitwe and Manyame upstream, are projected to have relatively lower decline in streamflow, of at most 14% for the HadCM3A2a scenario (2030-2040) and at most 18% for the 2060-2070 decade for the same scenario. The percentage decline is projected to range from 7.4% to around 16% for most of the micro-catchments. Notably, for Marimba the streamflow volume is projected to decrease by 14.2% and 7.4% for the HadCM3A2a and HadCM3B2a scenarios, respectively, for the 2030-2040 decade. The streamflow is projected to decrease for the 2060-2070 decade by approximately 16.2% for scenario HadCM3A2a and 12.7% for scenario HadCM3B2a. The decrease in streamflow in the projected periods is mainly due to a decrease in the projected rainfall. Also, the temperature is projected to increase with time, which suggests a potential increase in evaporation. The combination oflower rainfall and higher temperature/evaporation will result in a reduction in streamflow. The high temperature will cause an increase in water loss through evaporation. The decline in streamflow is projected to be higher for the HadCM3A2a scenario as compared to the HadCM3B2a scenario, mainly because the HadCM3A2a scenario is the worst-case scenario with high emissions and hence more pronounced impacts of climate change. The HadCM3B2a scenario is constructed based on assumptions of fewer emissions and the use of environmentally friendly technology leading to reduced impacts of climate change.
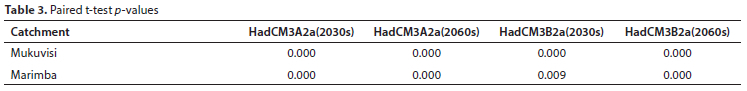
A paired i-test was run to determine whether there was a statistically significant difference between the baseline flows and projected flows for all the HadCM3 projected time scenarios. Table 3 shows the two tailed p-values.
The results show that there are statistically significant differences between the baseline flow and the projected flow for the HadCM3 scenarios.
Reservoir inflows
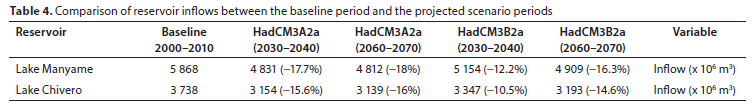
Table 4 shows the comparison of the reservoir inflows between the baseline period (2000-2010) and the projected scenario periods. Shown in brackets is the percentage change in inflows for each reservoir.
Results for major surface water sources, i.e., Lake Manyame and Lake Chivero, showed a projected decrease of inflows during the 2030-2040 decade as well as the 2060-2070 decade for both scenarios compared to the baseline period of 2000-2010. Lake Chivero is projected to have a decrease in inflows of 15.6% and 10.5% for the HadCM3A2a and HadCM3B2a scenarios, respectively, between the baseline period and the 2030-2040 decade. Between the baseline period and the 2060-2070 decade the reservoir is projected to have a decline in inflows of 16% and 14.6% for the HadCM3A2a and HadCM3B2a scenarios, respectively. Lake Manyame is projected to have a decrease in inflows of17.7% and 12.2% for the HadCM3A2a and HadCM3B2a scenarios, respectively, between the baseline period and the 2030-2040 decade. During the 2060-2070 decade the inflows are projected to decline by 18% and 16.3% for the HadCM3A2a and HadCM3B2a scenarios, respectively. The projected decrease in reservoir inflows into the major reservoirs of the sub-catchment that is Lake Manyame and Lake Chivero will cause water shortages for the Harare residents who depend on these reservoirs for their water supply. Again, the projected decrease in rainfall and increase in temperature will lead to this decrease in reservoir inflows. Also, the increase in temperature will cause a rise in open water evaporation which will greatly reduce the available surface water. However, there is need for future studies to also consider the impacts of climate change on reservoir yields of the major lakes (Lake Chivero and Lake Manyame).
Simulation results for CanESM2 RCPs
Streamflow
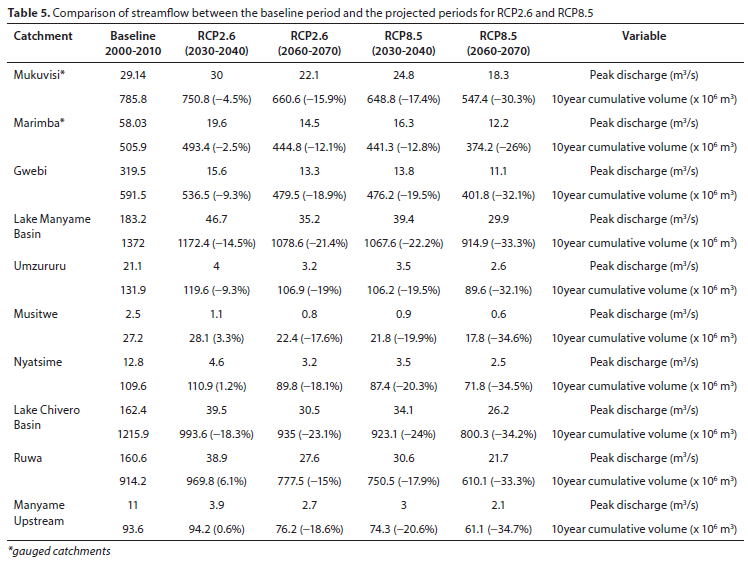
Table 5 shows the change in streamflow between the baseline period used for calibration (2000-2010) and the 2030-2040 decade as well as the 2060-2070 decade for the two representative concentration pathways: RCP2.6 and RCP8.5. Shown in brackets is the percentage change in streamflow for each catchment during the projected periods. A positive percentage change represents an increase in streamflow while a negative percentage change represents a decrease in streamflow.
The results in Table 5 show that there will be a decline in streamflow for most of the micro-catchments. The decline in streamflow will be relatively higher for RCP8.5 as compared to RCP2.6. Lake Chivero basin will experience a relatively higher decline in streamflow as compared to other micro-catchments. The streamflow for Lake Chivero basin will decrease by at most 23.1% for RCP2.6 and, at most, 34.2% for RCP8.5. Marimba micro-catchment will experience the least decline in streamflow. Streamflow is projected to drop by 2.5% and 12.1% between the baseline period and the 2030-2040 and 2060-2070 decades, respectively, under scenario RCP2.6. For the RCP8.5 scenario, streamflow volumes will decrease by 12.8% between the baseline period and the 2030-2040 decade and 26% between the baseline period and the 2060-2070 decade. However, some micro-catchments will experience a slight increase in streamflow during the 2030-2040 decade for RCP2.6. These micro-catchments include Musitwe (3.3%), Nyatsime (1.2%), Ruwa (6.1%) and Manyame Upstream (0.6%).
Generally, the decrease in streamflow will be higher for RCP8.5 as compared to RCP2.6 because this is a representative concentration with more emissions and hence a higher value of radiative energy. This means that there will be more global warming and the impacts of climate change will be greater as compared to RCP2.6 with a relatively lower radiative energy and less emissions. In a study done by Mbaye et al. (2015) on the assessment of impacts of climate change on water resources in the Upper Senegal basin, the results revealed that streamflow will decrease mainly during the usually high-flow season. The decline in streamflow was projected to be relatively higher for RCP8.5 (0.8 mm/day) as compared to RCP4.5 (0.2 mm/day). The study attributed this difference in magnitude of streamflow decline to the differences in levels of emissions and global warming between the two RCPs. RCP8.5 was said to have more emissions and higher levels of global warming as compared to RCP4.5.
The rainfall and temperature projections under these representative concentration pathways also revealed that there will be a decline in the amount of rainfall and an increase in the temperature. The decrease in rainfall will be higher for RCP8.5 than RCP2.6 and, the increase in temperature was also projected to be higher for RCP8.5 as compared to that for RCP2.6.
A paired t-test was run to determine whether there was a statistically significant difference between the baseline flow and projected flow for all the CanESM2 RCP projected time scenarios. Table 6 shows the two-tailed p-values.
The paired f-test results show that there are statistically significant differences between the baseline flow and projected flow for most of the time periods, except for RCP2.6 (2030s) where there is no statistically significant difference between the baseline flow and the projected flow.
Reservoir inflows
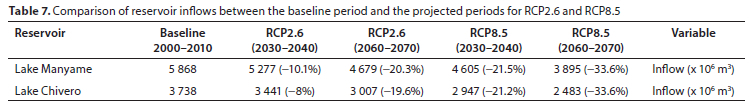
Table 7 shows the comparison of reservoir inflows into Lake Manyame and Lake Chivero between the baseline period and the projected periods.
Lake Manyame and Lake Chivero are projected to have a decline in inflows between the baseline period and the projected time periods. Lake Chivero's inflows will decrease by between 8% and 19.6% between the baseline period and the 2030-2040 and 20602070 decades, respectively, for RCP2.6. The decrease in inflows for RCP8.5 will be 21.2% and 33.6% between the baseline period and the 2030-2040 and the 2060-2070 decades, respectively. Lake Manyame will also experience a decline in the inflows by 10.1% and 20.3% between the baseline period and the 2030-2040 and 2060-2070 decades, respectively, for RCP2.6. Under RCP8.5 inflows will drop by 21.5% and 33.6% between the baseline period and the 2030-2040 and 2060-2070 decades, respectively.
The decline in streamflow and inflows into the major reservoirs of Lake Manyame and Chivero suggest that there will be a reduction in the available surface water in Upper Manyame sub-catchment. This will be exacerbated by the increase in the rate of evaporation, mainly triggered by an increase in mean temperature. Reductions in available surface water will impact negatively on the water supply to the residents of greater Harare. Furthermore, reduced water availability will increase the tension between urban water demands and agricultural water demands upstream of the lakes. This calls for forward planning and stakeholder engagement by water management authorities in the sub-catchment.
Many countries in Southern Africa are projected to have a decrease in streamflow due to reduction in precipitation amount in future. Countries in the Zambezi basin are projected to have a decline in streamflow by approximately 20% by 2050. Areas around Harare, Zimbabwe, are projected to experience a 19% reduction in streamflow due to decrease in precipitation amount (Beilfuss, 2012). These predictions are in line with this study's predictions that the streamflow will decrease with time for all the scenarios and representative concentration pathways. It is, however, recommended that future studies should consider as many GCM models as possible depending on their accessibility.
The projected decrease in inflows presents a potential challenge from a water quality perspective. Lake Chivero has been established as a eutrophic, if not hypertrophic, Lake. Nhapi et al. (2007) established that a significant cause of the nutrient enrichment of Lake Chivero is sewage effluent. In such a system, reservoir inflows play an important role in annual flushing, and to some extent vertical mixing, of the water column. Projected decrease in reservoir inflows of 8-34% over the coming years will worsen the current water quality status of the lake. Fish catches and fish composition that were noted by Utete et al. (2018) to be on the decline will, most likely, further decline. This calls for better management of the lake and the sub-catchment as a whole.
CONCLUSIONS
Results for the HEC-HMS model calibration and validation showed that the model can simulate streamflow and reservoir inflows at a recommended RVE and bias. The impacts of the HadCM3 and CanESM2 projected climate variables on streamflow is that streamflow is projected to decrease for most of the micro-catchments. The reservoir inflows for Lake Manyame and Lake Chivero are projected to decrease. Climate change is projected to continue to affect the area in the future time periods as signaled by the reduction in streamflow and reservoir inflows. There is therefore a need to strengthen climate change mitigation and adaptation measures to reduce the projected impacts.
In summary, the results revealed that the streamflow and reservoir inflows are projected to decrease significantly, thereby reducing the available surface water volumes.
ACKNOWLEDGEMENTS
Many thanks to WaterNet Phase 3 (2012-2016), Harare, Zimbabwe for sponsoring this study.
REFERENCES
ADEDEJI O, REUBEN O and OLATOYE O (2014) Global climate change. J. Geosci. Environ. Protect. 114-122. https://doi.org/10.4236/gep.2014.22016 [ Links ]
ARNELL NW and GOSLING SN (2013) The impacts of climate change on river flow regimes at the global scale. J. Hydrol. 486 351-364. https://doi.org/10.1016/j.jhydrol.2013.02.010 [ Links ]
ARNOLD JG, SRINIVASAN R, MUTTIAH RS and WILLIAMS JR (1998) Large area hydrologic modeling and assessment part I: Model development. J. Am. Water Resour. Assoc. 34 (1) 73-89. https://doi.org/10.1111/j.1752-1688.1998.tb05961.x [ Links ]
BEILFUSS R (2012) A risky climate for Southern African hydro: Assessing hydrological risks and consequences for Zambezi river basin dams. International Rivers, USA. 60 pp. https://doi.org/10.13140/RG.2.2.30193.48486 [ Links ]
BERGSTROM S (1976) Development and application of a conceptual runoff model for Scandinavian catchments. SMHI Norrkoping. Report RH07. [ Links ]
BEVEN KJ and KIRKBY MJ (1979) A physically based, variable contributing area model of basin hydrology. Hydrol. Sci. 24 (1) 43-69. https://doi.org/10.1080/02626667909491834 [ Links ]
BRAZIER A (2015) Climate change in Zimbabwe, facts for planners and decision makers. Konrad-Adenauer-Stiftung, Harare. URL: https://www.kas.de/c/document_library/get_file?uuid=6dfce726-fdd1-4f7b-72e7-e6c1ca9c9a95&groupId=252038 (Accessed 19 July 2019). [ Links ]
CHAMAILLE-JAMMES S, FRITZ H and MURINDAGOMO F (2007) Detecting climate change of concern in highly variable environments. J. Arid Environ. 71 321-326. https://doi.org/10.1016/j.jaridenv.2007.05.005 [ Links ]
DUBE K and NHAMO G (2018) Climate variability, change and potential impacts on tourism: Evidence from the Zambian side of the Victoria Falls. Environ. Sci. Polic. 84 113-123. https://doi.org/10.1016/j.envsci.2018.03.009 [ Links ]
GEBRE SL and LUDWIG F (2015) Hydrological response to climate change of the Upper Blue Nile River Basin: Based on IPCC Fifth Assessment Report (AR5). Climatol. Weather Forecasting. 15. http://dx.doi.org/10.4172/2332-2594.1000121 [ Links ]
GUMINDOGA W, RIENTJES T, SHEKEDE MD, RWASOKA DT, NHAPI I and HAILE AT (2014) Hydrological impacts of urbanization of two catchments in Harare, Zimbabwe. Remote Sens. 6 12544-12574. https://doi.org/10.3390/rs61212544 [ Links ]
GUMINDOGA W, RWASOKA DT, NHAPI I and DUBE T (2016) Ungauged runoff simulation in Upper Manyame Catchment, Zimbabwe: Applications of the HEC-HMS model. Phys. Chem. Earth. 34 371-382. https://doi.org/10.1016/J.PCE.2016.05.002 [ Links ]
GWENZI J, MASHONJOWA E, MAFONGOYA PL, RWASOKA DT and STIGTER K (2016) The use of indigenous knowledge systems for short and long range rainfall prediction and farmers' perceptions of science-based seasonal forecasts in Zimbabwe. Int. J. Clim. Change Strategies Manage. 8 (3) 440-462. https://doi.org/10.1108/IJCCSM-03-2015-0032 [ Links ]
HEC-HMS (2010) United States Army Corps of Engineers, Institute of Water Resources, Hydrologic Engineering Centre, Davis California, USA. URL: https://www.hec.usace.army.mil/software/HEC-HMS/documentation/HEC-HMS_Technical%20Reference%20Manual_(CPD-74B).pdf [ Links ]
HULME M, DOHERTY R, NGARA T and NEW MDL (2001) African climate change: 1900 - 2100. Clim. Res. 17 145-168. https://doi.org/10.3354/cr017145 [ Links ]
IPCC (2014) Summary for policymakers. In: Field CB, Barros VR, Dokken DJ, Mach KJ, Mastrandrea MD, Bilir TE, Chatterjee M, Ebi KL, Estrada YO, Genova RC et al. (eds) Climate Change 2014: Impacts, Adaptation, and Vulnerability. Part A: Global and Sectoral Aspects. Contribution of Working Group II to the Fifth Assessment Report of the Intergovernmental Panel on Climate Change. Cambridge University Press, Cambridge. 1-32. URL: https://www.ipcc.ch/site/assets/uploads/2018/02/ar5_wgII_spm_en.pdf (Accessed 20 July 2019). [ Links ]
JINGA P and ASHLEY MV (2019) Climate change threatens some miombo tree species of sub-Saharan Africa. Flora. 257. https://doi.org/10.1016/j.flora.2019.151421 [ Links ]
KANDJI ST, VERCHOT L and MACKENSEN J (2006) Climate change and variability in Southern Africa: impacts and adaptation in the agricultural sector, Nairobi, Kenya. 42 pp. URL: http://apps.worldagroforestry.org/downloads/Publications/PDFS/B14549.pdf (Accessed 10 January 2021). [ Links ]
KRAUSE P, BOYLE DP and BASE F (2005) Comparison of different efficiency criteria for hydrological model assessment. Adv. Geosci. 5 89-97. https://doi.org/10.5194/adgeo-5-89-2005 [ Links ]
MAATHUIS BHP and WANG L (2006) Digital elevation model based hydro-procesing. Geocarto Int. 21 (1) 21-26. https://doi.org/10.1080/10106040608542370 [ Links ]
MAKUVARO V, MUREWI CTF, DIMES J and CHAGONDA I (2017) Are smallholder farmers' perceptions of climate variability and change supported by climate records? A case study of Lower Gweru in semiarid central Zimbabwe. Am. Meteorol. Soc. https://doi.org/10.1175/WCAS-D-16-0029.1 [ Links ]
MARAUN D, WETTERHALL F, IRESON AM, CHANDLER RE, KENDON EJ, WIDMANN M, BRIENEN S, RUST HW, SAUTER T, THEMEfiL M and co-authors (2010) Precipitation downscaling under climate change: Recent developments to bridge the gap between dynamical models and the end user. Rev. Geophys. 48 (3) https://doi.org/10.1029/2009RG000314 [ Links ]
MARSHALL B (2017) An assessment of climate change and stratification in Lake Kariba (Zambia-Zimbabwe). Lakes Reservoirs Res. Manage. 22 (3) 229-240. https://doi.org/10.1111/lre.12185 [ Links ]
MASIMBA O, GUMINDOGA W, MHIZHA A and RWASOKA D (2019) An assessment of baseline and downscaled projected climate variables in the Upper Manyame sub-catchment of Zimbabwe. Phys. Chem. Earth A/B/C. 114 102788. https://doi.org/10.1016/j.pce.2019.07.001 [ Links ]
MASON SJ and JURY MR (1997) Climatic variability and change over southern Africa: a reflection on underlying processes. Prog. Phys. Geogr. 21 (1) 23-50. https://doi.org/10.1177/030913339702100103 [ Links ]
MAZVIMAVI D (2010) Investigating changes over time of annual rainfall in Zimbabwe. Hydrol. Earth Syst. Sci. 14 2671-2679. https://doi.org/10.5194/hess-14-2671-2010 [ Links ]
MAZVIMAVI D, MAKURIRA H, KUSANGAYA S and WILLIAMS HB (2005) Assessment of surface water resources of Zimbabwe and guidelines for planning. Consultancy Report for the Zimbabwe National Water Authority, Zimbabwe. [ Links ]
MBAYE ML, HAGEMANN S, HAENSLER A, STACKE T, GAYE AT and AFOUDA A (2015) Assessment of Climate Change Impact on Water Resources in the Upper Senegal Basin (West Africa). Am. J. Clim. Change. 4 77-93. https://doi.org/10.4236/ajcc.2015.41008 [ Links ]
MHLANGA I, NDAIMANI H, MPAKAIRI K and MUJERE N (2018) Climate change: An uncertain future for dairy farming in Zimbabwe. Trans. R. Soc. S. Afr. 73 (3) 237-242. https://doi.org/10.1080/0035919x.2018.1503203 [ Links ]
MUGANDANI R, WUTA M, MAKARAU A and CHIPINDU B (2012). Re-Classification of the AgroEcological Regions of Zimbabwe in Conformity With Climate Variability and Change. Afr. Crop Sci. J. 20 (s2) 361-369. [ Links ]
NGUYEN VTV, DESRAMAUT N and NGUYEN TD (2008) Estimation of design storms in consideration of climate variability and change. In: Proceedings of 11th International Conference on Urban Drainage, 31 August-5 September 2008, Edinburgh. 1-11. [ Links ]
NHAPI I (2009) The water situation in Harare, Zimbabwe: a policy and management problem. Water Polic. 11 (2) 221-235. https://doi.org/10.2166/wp.2009.018 [ Links ]
NHAPI I, SIEBEL MA and GIJZEN HJ (2007) The impact of urbanisation on the water quality of Lake Chivero, Zimbabwe. Water Environ. 18 (1) 44-49. https://doi.org/10.1111/j.1747-6593.2004.tb00492.x [ Links ]
NIGATU ZM, RIENTJES T and HAILE AT (2016) Hydrological impact assessment of climate change on Lake Tana's water balance, Ethiopia. Am. J. Clim. Change. 5 27-37. https://doi.org/10.4236/ajcc.2016.51005 [ Links ]
PHIRI M (2011) An analysis of the Cahora Bassa Dam water balance and reservoir operations and their flooding impact on upstream settlements. Civil Engineering, University of Zimbabwe. URL: https://ir.uz.ac.zw/handle/10646/795?show=full (Accessed 26 April 2021). [ Links ]
PRUDHOMME C, REYNARD N and CROOKS S (2002) Downscaling of global climate models for flood frequency analysis: where are we now? Hydrol. Process. 16 1137-1150. https://doi.org/10.1002/hyp.1054 [ Links ]
RWASOKA DT, GUMINDOGA W and GWENZI J (2011) Estimation of actual evapotranspiration using the Surface Energy Balance System (SEBS) algorithm in the Upper Manyame catchment in Zimbabwe. Phys. Chem. Earth A/B/C. 36 736-746. https://doi.org/10.1016/j.pce.2011.07.035 [ Links ]
SACHINDRA DA, HUANG F, BARTON AF and PERERA BJC (2014) Statistical downscaling of general circulation model outputs to catchment scale hydroclimatic variables issues. Challenges and possible solutions. J. Water Clim. Change. 5 496-525. https://doi.org/10.2166/wcc.2014.056 [ Links ]
SERDECZNY O, ADAMS S, BAARSCH F, COUMOU D, ROBINSON A, HARE W, SCHAEFFER M, PERRETTE M and REINHARDT J (2016) Climate change impacts in Sub-Saharan Africa: from physical changes to their social repercussions. Regional Environ. Change. 17 (6) 1585-1600. https://link.springer.com/article/10.1007/s10113-015-0910-2 [ Links ]
SIBANDA S, GRAB SW and AHMED F (2018) Spatio-temporal temperature trends and extreme hydro-climatic events in southern Zimbabwe. S. Afr. Geogr. J. 100 (2) 210-232. https://doi.org/10.1080/03736245.2017.1397541 [ Links ]
SNYDER FF (1938) Synthetic unit graphs: Trans. Am. Geophys. Union. 9 447-454. https://doi.org/10.1029/TR019i001p00447 [ Links ]
SREENIVASULU V and BHASKAR PU (2010) Estimation of catchment characteristics using remote sensing and GIS techniques. Int. J. Eng. Sci. Technol. 2 7763-7770. [ Links ]
UNGANAI L (2009) Adaptation to climate change among agropastoral systems: case for Zimbabwe. Earth Environ. Sci. https://doi.org/10.1088/1755-1307/6/41/412045 [ Links ]
URAMA KC and OZOR N (2010) Impacts of climate change on water resources in Africa: The role of adaptation. African Technology Policy Studies Network. 29 (1) 1-29. https://pdfs.semanticscholar.org/2eac/cdb9c3b59556f2b39bd549482a773010fc8f.pdf [ Links ]
USACE (2000) HEC-HMS technical reference manual. Hydrologic Engineering Center, Davis, CA. [ Links ]
USACE (2008) HEC-HMS hydrologic modeling system user's manual. Hydrologic Engineering Center, Davis, CA. URL: https://www.hec.usace.army.mil/software/HEC-HMS/documentation/HEC-HMS_Applications_Guide_March2008.pdf (Accessed 26 April 2020). [ Links ]
UTETE B, PHIRI C, MLAMBO SS, MUBOKO N and FREGENE BT (2018) Fish catches, and the influence of climatic and non-climatic factors in Lakes Chivero and Manyame, Zimbabwe. Cogent Food Agric. 4. https://doi.org/10.1080/23311932.2018.1435018 [ Links ]
VAITTINADA AYAR P, VRAC M, BASTIN S, CARREAU J, DEQUE M and GALLARDO C (2016) Intercomparison of statistical and dynamical downscaling models under the EURO- and MED-CORDEX initiative framework: present climate evaluations. Clim. Dyn. 46 1301-1329. https://doi.org/10.1007/s00382-015-2647-5 [ Links ]
ZIMSTAT (2012) Census Preliminary Report, Harare, Zimbabwe. URL: http://www.zimstat.co.zw (Accessed 17 September 2020). [ Links ]
 Correspondence:
Oliver Masimba
Email: omasimba7@gmail.com
Received: 17 May 2021
Accepted: 24 September 2022

