


Services on Demand
Article
 English (pdf)
 Article in xml format
 Article references
Indicators

Related links
-
 Cited by Google
 -
 Similars in Google
Share

 Permalink
Water SA
On-line version ISSN 1816-7950
Print version ISSN 0378-4738
Water SA vol.48 n.3 Pretoria Jul. 2022
http://dx.doi.org/10.17159/wsa/2022.v48.i3.3929
RESEARCH PAPER
Evaluation of nitrate redistribution in surface and subsurface drip irrigation systems
Sogand Arab; Javad Mozaffari; Mohammad Javad Nahvinia
Water Science & Engineering Department, Arak University, Arak, Iran
ABSTRACT
Nitrogen compounds added to the soil may convert to nitrate and cause contamination. The distribution and uniformity of soil nitrate in surface vs. subsurface drip irrigation systems were compared in a physical model consisting of a transparent glass box (1.20 x 0.5 x 1 m) and sandy loam soil, and considering emitter installation depths of 0 and 30 cm, discharge rates of Q1 = 2, Q2 = 4, Q3 = 8 L/h, and fertilizer levels of S1 = 125, S2 = 250, S3 = 375 mg/L. Irrigation continued for 6 h and nitrate and moisture sampling was performed for 68 h after the initiation of water front advance. The result showed that doubling the discharge caused the wetted area to triple in size in the subsurface drip irrigation system whereas it only doubled in size in the surface drip irrigation system. Thus in the subsurface system, when increasing the fertilizer level, the nitrate spread out extensively and therefore its concentration was greatly reduced. Also, by increasing discharge, the difference in soil nitrate concentration between the two systems increases because of increasing non-uniformity of nitrate distribution in the surface system, such that by increasing the fertilizer concentration form 125 to 375 mg/L, the difference in nitrate concentration increases from 22% to 500% (for Q1 = 2 L/h), 43% to 352% (for Q2 = 4 L/h), and 14% to 166% (for Q3 = 8 L/h). Thus the subsurface drip irrigation system has a more uniform trend of nitrate distribution than the surface drip irrigation system. Also, treatment with maximum flow and fertilizer level will create the most optimal nitrate concentration in the soil.
Keywords: moisture, nitrate, subsurface drip irrigation, surface drip irrigation, fertilizer level
INTRODUCTION
The use of nitrogen fertilizers in agriculture increases the nitrate concentration in groundwater resources (Keeney and Follet, 1991; Zeng et al., 2013). Studies on the transfer of solutes in soil have shown that factors such as the fertilizer level used, soil physical conditions and irrigation method affect the transfer of solutes. Therefore, examining solute transfer can provide knowledge that can aid in controlling leaching (Haygarth et al., 2005; Zeng et al., 2013). Any irrigation method that can reduce the amount of deep infiltration of solutes in the plant root zone and supply the plant water requirement will certainly create the most optimal conditions for plant growth and preventing contamination of groundwater (Hu et al., 2009). Therefore, improvements in irrigation systems are one of the most effective ways to increase water use efficiency and reduce nitrate leaching.
Drip irrigation systems are of the most important of these systems, the most prominent of which are surface and subsurface drip irrigation systems. In drip irrigation systems (DI), the emitter is usually installed on the soil surface. However, in the subsurface drip system (SDI), it is installed below the soil surface at various depths. Studies of the performance of the subsurface drip system at different flow rates and fertilizer levels has shown that a favourable result is observed in terms of the uptake of fertilizers and the reduction of leaching from the soil, as well as in reducing water consumption (Nagaz et al., 2012; Brewer et al., 2012). Gonçalves et al. (2019) evaluated the crop productivity in surface, sprinkler and subsurface drip irrigation systems in Brazil. The results showed that in the subsurface drip irrigation systems, the fertilizer level in the soil profile was less than for the other two methods. In addition, more water and fertilizer were saved than with the other methods. Finally, this system was recognized as a suitable irrigation system to increase crop productivity. Wang et al. (2019) investigated the effect of modern (pressurized) irrigation in comparison with traditional methods by considering the effect of water volume and concentration of nitrate fertilizer on cucumber yield. The results showed that this method appropriately manages the water and fertilizer consumption and significantly reduces the leaching rate of nitrate fertilizer and increases the crop yield.
The positive effect of drip irrigation on crop yield and reduction of solute leaching is based on the design parameters of this system, including the arrangement of laterals and calculating the depth and distance between laterals. In order to calculate these parameters, information on the distribution of moisture and nitrate in the soil must be available to estimate the values corresponding to the optimal location. Zhenjie et al. (2017) examined the subsurface drip irrigation system with wastewater as the irrigation source and found that a lateral installation depth of 15 cm could reduce the risk of nitrate leaching in the low depths of the soil, by less contact of water with soil and roots. Furthermore, Rajwadeet al. (2018) examined crop productivity under the subsurface drip irrigation system using different nitrogen fertilizer levels and irrigation depths. The results showed that by reducing nitrogen fertilizer levels by 25-50% and with lateral distances of 60 cm, water and fertilizer productivity can be increased by 32% and 73%, respectively.
Physical modelling is one of the common ways of addressing a research objectives. The purpose of applying the physical model is to understand or predict the behaviour of a system based on variables and parameters. The main purpose of this study was to compare the uniformity of nitrate distribution in surface and subsurface drip irrigation systems such that the results obtained could be effective in estimation of leaching requirements and fertilizer application rates.
MATERIALS AND METHODS
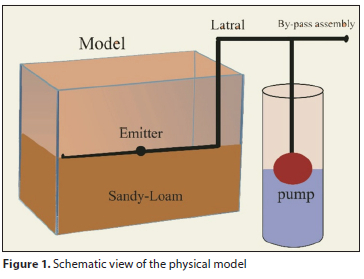
The experiments were conducted in the laboratory of the Faculty of Agriculture and Natural Resources of Arak University, using a physical model with transparent glass walls with dimensions of 1.2 x 0.5 x 1 m and sandy loam soil texture (Fig. 1). The characteristics of the soil used are given in Table 1. The treatments included two lateral installation depths of 30 (H1) and 0 (H2) cm, emitters with discharges of 2 L/h (Q1), 4 L/h (Q2) and 8 L/h (Q3), and fertilization with three nitrate concentrations of 125 mg/L (S1), 250 mg/L (S2) and 375 mg/L (S3). In this study, 18 irrigation experiments were performed in a physical model. In order to eliminate nitrate contamination, the soil of the physical model was emptied after each experiment and washed with distilled water and dried for 24 h. For the next experiment, the physical model was filled with dried soil according to a certain density (ρb=1.45 g/cm3). Urea fertilizer (CH4N2O) with 46% nitrogen was used in the experiment due to the high consumption in agriculture and the desirable solubility in water, which prevents emitter clogging.
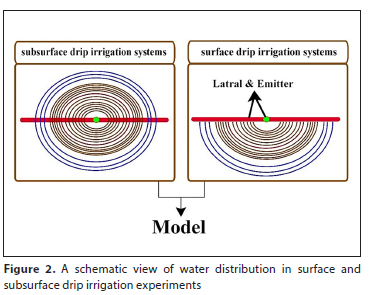
The model was irrigated for 6 h by means of a pump and through polyethylene pipes (main pipe with a diameter of 20 mm and lateral with a diameter of 16 mm). All tests were performed at constant pressure and a constant temperature of 20°C. Figure 2 shows a schematic view of water distribution in surface and subsurface drip irrigation experiments.
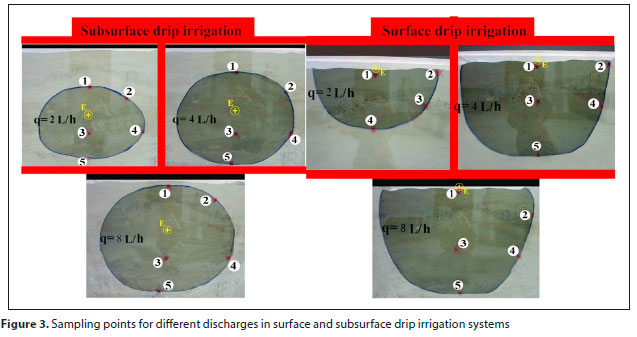
During the irrigation, the water front advance was marked at different times of 1, 5, 10, 15, 30, 60, 90, 120, 150, 180, 240, 300 and 360 min on the glass plate and in different directions (longitudinal, transverse, and vertical). Irrigation was stopped after 6 h, but measurement for a further 68 h, to take into account the water front advance. Before performing the experiment, the soil was sieved with a 2 mm sieve and the inner body of the glass model was covered with glue and sand to prevent preferential flow and errors during the experiments. In order to measure the moisture content and nitrate concentration, based on the latest marking of the wetting front, some samples were taken by shovel at the end of each experiment from the specific points around the emitter and transferred to special containers (Fig. 3).
The samples, with a specified volume (100 cm3), were immediately transferred to the laboratory for moisture measurement. The samples were weighed before being placed in the oven, and after 24 h of drying in the oven, and the initial soil moisture calculated. A spectrophotometer (SPECORD 200 / PLUS model) was used to measure the nitrate concentration after soil saturation extraction. Nitrate concentration for each irrigation system was plotted in 3D diagrams using Sigma Plot 12.3 software.
RESULTS AND DISCUSSION
Moisture distribution
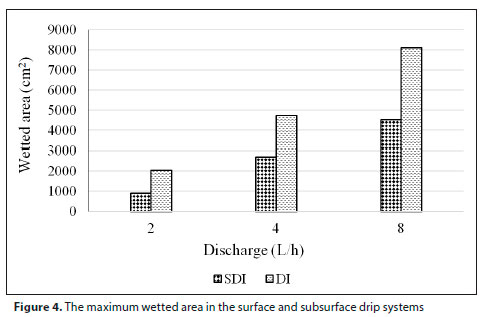
By observing the moisture front advance, it was seen that the area of moisture distribution was increasing. According to Fig. 4, the maximum wetted area in the subsurface drip system is 201% when the discharge is doubled (4 L/h versus 2 L/h). When the discharge is quadrupled (8 L/h versus 2 L/h) the maximum wetted area is increased by 402%. Furthermore, in the surface drip system, these values are equal to 132% and 296%, respectively. In another comparison, the maximum wetted area in the surface drip system is about 127%, 75%, and 80% higher than in the subsurface drip system, for the discharges of 2 L/h, 4 L/h, and 8 L/h, respectively. In general, it can be concluded that the wetted area in the surface drip system changed by the same amount as discharge, when doubling and quadrupling the discharge. However, in the subsurface drip system, these values for wetted area increased 3 to 5 times, though the wetted area in the surface drip system is much larger than in the subsurface drip system (at the same flow rate) (Fig. 3). In the subsurface drip system, because the emitter is below the soil surface, a part of the moisture front wets the dry soil above the emitter and therefore the vertical distribution of moisture in the subsurface drip system is less than in the surface drip system. Also, in the subsurface drip system, the water from the emitter infiltrated the soil in the initial stages of irrigation, but after a while the advance of the moisture front changes, with some of the moisture returning to the emitter due to the potential difference between the water inside the emitter and the surrounding soil. This change in the advance of the moisture front can lead to a difference in the wetted area resulting from the two systems.
Nitrate distribution
In this study, the effect of discharge and fertilizer application on nitrate concentration in both irrigation systems was investigated. The nitrogen and water balance with the maximum nitrate concentration are indicated in Figs 5-8.
Effect of discharge on nitrate distribution in drip irrigation systems
As can be seen in Fig. 5, the maximum nitrate concentration for the first fertilizer level (S1,125 mg/L) in the flow discharge of 4 L/h (16 mg/L) increased by 300% compared to the flow discharge of 2 L/h (4 mg/L). For the flow discharge of 8 L/h (18 mg/L) the maximum nitrate concentration increased by 350% compared to the flow discharge of 2 L/h. This concentration increased by 112% and 133% in the second fertilizer level (S2, 250 mg/L) and by 2% and 6%, respectively, in the third fertilizer level (S3, 375 mg/L). In this system, the distribution of nitrate has a similar trend to the subsurface drip system, except that the maximum nitrate concentration increases with increasing discharge. As mentioned before, the reason for this is the change in the maximum wetted area. In the surface drip system the changes in area and flow discharge are similar (when doubling and quadrupling the flow discharge, the area doubled and quadrupled).
Effect of discharge rate on nitrate distribution in subsurface drip irrigation system
Nitrate concentration was separately investigated for 3 discharges (2, 4, and 8 L/h) and at constant fertilizer levels of 125 (S1), 250 (S2) and 375 (S3) mg/L. As shown in Fig. 6, the maximum nitrate concentration in the soil for the fertilizer level of S1 at a discharge of 2, 4, and 8 L/h is 3.3, 3.1, and 3 mg/L, respectively, indicating that at a discharge of 4 L/h this concentration has decreased by 6% compared to the discharge of 2 L/h (flow rate has doubled). In addition, with a discharge of 8 L/h, the maximum nitrate concentration increased by 10% compared to the discharge of 2 L/h (the flow has quadrupled). For fertilizer level S2 at the discharges of 4 L/h (3.2 mg/L) and 8 L/h (3.1 mg/L), the maximum nitrate concentrations in the soil decreased by 23% and 27% compared to the discharge of 2 L/h (4.2 mg/L). In addition, at a constant fertilizer level of 375 mg/L (S3), the maximum nitrate concentration in the soil is 10.4, 6.8, and 4.7 mg/L, at a discharge of 2, 4, and 8 L/h, respectively, and for discharges of 4 and 8 L/h, the maximum nitrate concentrations in the soil decreased by 45% and 55% compared to the discharge of 2 L/h. According to the above-mentioned results, for all concentrations, increasing the discharge results in the nitrate concentration of the soil decreasing, due to the increase in wetted area. With increasing the discharge, because of consuming a high water volume and adding a high fertilizer level to the soil, a wider moisture front and higher nitrate concentration are expected; however, because the changes in the area are greater than the changes in discharge (with a 2 and 4 times increase in discharge, the area has increased 3 to 5 times), the nitrate concentration in this system is decreasing. Consequently, by increasing the fertilizer level, it is obvious that the percentage reduction of soil nitrate concentration will increase.
Effect of fertilizer level on nitrate distribution in drip irrigation systems
As shown in Fig. 7, at the discharge of 2 L/h, the maximum nitrate concentration (6 mg/L) for the S2 fertilizer level increased by 50% relative to its concentration with S1.(4 mg/L). The maximum nitrate concentration for the third fertilizer level (S3, 11.8 mg/L) also showed an increase of 195% compared to S1.
In addition, for the discharge of 4 L/h, the maximum nitrate concentration for S3 (12 mg/L) decreased by 21% and 25%, respectively, compared to S1 and S2.(16 and 12.7 mg/L, respectively). Additionally, for a discharge of 8 L/h, the maximum nitrate concentration for S3 (12.5 mg/L) decreased by 23% and 31%, respectively, compared to S1 and S2 (18 and 14 mg/L, respectively) (Fig. 7). In this irrigation system, like subsurface drip irrigation, increasing discharge results in an increase in wetted area while soil nitrate concentration shows a decreasing trend. Thus at discharges of 4 and 8 L/h, the soil nitrate concentration has decreased.
Effect of fertilizer level on nitrate distribution in subsurface drip irrigation systems
According to Fig. 8, at a discharge of 2 L/h (Q1), the maximum soil nitrate concentration for the second fertilizer level (S2, 4.2 mg/L) increased by 27% compared to the first fertilizer level (S1, 3.3 mg/L). In addition, the maximum nitrate concentration (10.4 mg/L) for the third fertilizer level (S3) increased by 215% compared to the first fertilizer level.
For a discharge of 4 L/h (the maximum nitrate concentrations for S1 and S2 are 3.1 and 3.2 mg/L, respectively) and 8 L/h (the maximum nitrate concentrations for S1 and S2 are 3 and 3.1 mg/L, respectively), the nitrate concentration for S2 did not change significantly compared to S1; however, for S3 (nitrate concentrations for discharges of 4 and 8 L/h are 6.8 and 4.7 mg/L, respectively) this increased by 120% and 57% compared S1 with discharges of 4 and 8 L/h, respectively (Fig. 8).
Therefore, changes in nitrate concentration with a change of fertilizer level depend on the maximum wetted area achieved by the system. In the subsurface system, by injecting a higher fertilizer level under constant discharge, the fertilizer level entering the system increases and the maximum nitrate concentration of the soil also increases. In addition, with increasing the discharge, the wetted area has an increasing trend and, as a result, the rate of increase in nitrate concentration has a decreasing trend.
Simultaneous comparison of nitrate concentration in surface and subsurface drip systems in a constant fertilizer level
The soil nitrate concentration in a surface drip irrigation system and for the first fertilizer level (S1) increased by 22%, 416%, and 500%, respectively, for discharges Q1, Q2, and Q3, when compared with the subsurface drip irrigation system. For the second fertilizer level (S2), these values show an increase of 43%, 297% and 352%; for the third fertilizer level (S3), these values show an increase of 14%, 77% and 166%, respectively. In fact, when increasing the discharge at a constant fertilizer level, the percentage difference in nitrate concentration between the two systems increases, and the surface drip irrigation system in all conditions results in increased soil nitrate concentrations relative to the subsurface system, due to a lack of uniform fertilizer distribution in the surface drip system (Figs 5-8).
Tables 2 and 3 show the maximum soil nitrate concentration for subsurface and surface drip systems. According to Table 2, at discharge of 2 L/h, and a triple concentration of fertilizer, the maximum soil nitrate concentration in the subsurface drip system has almost tripled. But with the increase in flow to 8 L/h, and a triple concentration of fertilizer, the maximum soil nitrate concentration of has increased almost 1.5 times. Therefore, with increasing flow, the uniformity of nitrate concentration in the soil will increase.
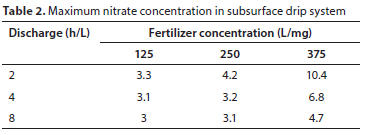
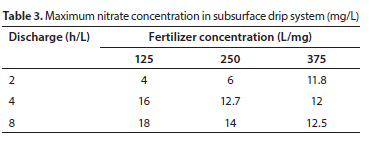
Table 3 shows the maximum nitrate concentration for the surface drip system. At a discharge of 2 L/h, by tripling the fertilizer concentration, the maximum soil nitrate concentration is almost tripled, which is a similar result to that for the subsurface drip system. However, at discharges of 4 and 8 L/h, with increasing fertilizer concentration, the maximum nitrate concentration has decreased, such that by tripling the concentration of fertilizer at a discharge of 8 L/h, the soil nitrate concentration decreases by 30%. In the surface drip system, at a fertilizer level of 125 mg/L, increasing discharge caused greater non-uniformity in soil nitrate concentration. However, with the increase in fertilizer concentration to 375 mg/L, this trend has been corrected and the non-uniformity of nitrate distribution for the flow of 8 L/h has decreased. In general, it can be concluded that the treatment with maximum flow and fertilizer level will create the most optimal maximum nitrate concentration in the soil.
CONCLUSIONS
The results of the present study have shown that changes in wetted area affect the soil nitrate concentration. In both systems, with increasing discharge the wetted area has an increasing trend, but in the surface drip irrigation system the increase is greater than in the subsurface drip system. In the subsurface drip system, with increasing discharge the soil nitrate concentration decreases due to the change in wetted area being greater than the change in flow discharge. But, in the surface drip system the soil nitrate concentration increases as a result of the same changes in flow discharge and wetted area. In addition, increasing the fertilizer level in the subsurface system resulted in increased soil nitrate concentration, whereas in the surface drip irrigation system at a lower discharge (2 L/h), the soil nitrate concentration increased, and decreased with increasing discharge. Also, the surface drip system has a non-uniform nitrate distribution, whereas the distribution of nitrate was more uniform in the subsurface drip system. So, subsurface drip irrigation systems can improve the efficiency of fertigation distribution. These results can assist in the design of suitable surface and subsurface irrigation systems.
REFERENCES
BREWER MT, MORGAN KT, ZOTARELLI L, STANLEY CD and KADYAMPAKEN D (2018) Effect of drip irrigation and nitrogen, phosphorus and potassium application rates on tomato biomass accumulation, nutrient content, yield, and soil nutrient status. J. Hort. 5 (1) 227. https://doi.org/10.4172/2376-0354.1000227 [ Links ]
GONÇALVES IZ, BARBOSA EAA, SANTOS LNS, NAZARIO AA, FEITOSA DRC, TUTA NF and MATSURA EE (2019) Nutritional balance and production of sugarcane irrigated with treated wastewater through subsurface drip. J. Irrig. Sci. 37 207-217. https://doi.org/10.1007/s00271-019-00620-y [ Links ]
HAYGARTH PM, CONDRON LM, HEATHWAITE AL, TURNER BL and HARRIS GP (2005) The phosphorus transfer continuum, linking source to impact with an interdisciplinary and multi-scaled approach. Sci. Total Environ. 344 5-14. https://doi.org/10.1016/j.scitotenv.2005.02.001 [ Links ]
HU T, KANG SH, LI F and ZHANG J (2009) Effects of partial root-zone irrigation on the nitrogen absorption and utilization of maize. J. Agric. Water Manage. 96 (2) 208-214. https://doi.org/10.1016/j.agwat.2008.07.011 [ Links ]
KEENEY DR and FOLLET RF (1991) Managing nitrogen for groundwater quality and farm profitability: overview and introduction. In: Follett RF, Keeney DR and Cruse RM (eds) Managing Nitrogen for Groundwater Quality and Farm Profitability. Soil Science Society of America, Madison. https://doi.org/10.2136/1991.managingnitrogen.c1 [ Links ]
LI G, ZHAO L, ZHANG S, HOSEN Y and YAGI K (2011) Recovery and leaching of 15N labeled coated urea in a lysimeter system in the North China Plain. J. Pedosphere. 21 (6) 763-772. https://doi.org/10.1016/S1002-0160(11)60180-X [ Links ]
NAGAZ K, MOKH EL, MASMOUDI MM and BEN MECHLIA N (2012) Evaluation of nitrogen fertigation through surface and subsurface drip irrigation system with salin water on popato yield and water productivity under the arid conditions of Tunisia. 5th Edition of the International Conference Agricultural Development and Sustainability, Villa Clara, Cuba. [ Links ]
RAJWADE YA, SWAIN DK, TIWARI KN and SINGH BHADORIA PB (2018) Grain yield, water productivity, and soil nitrogen dynamics in drip irrigated rice under varying nitrogen rates. Alliance Crop Soil Environ. Soc. 110 (3) 868-878. https://doi.org/10.2134/agronj2017.09.0538 [ Links ]
WANG A, GALLARDO M, ZHAOA W, ZHANG Z and MIAO M (2019) Yield, nitrogen uptake and nitrogen leaching of tunnel greenhouse grown cucumber in a shallow groundwater region. J. Agric. Water Manage. 217 73-80. https://doi.org/10.1016/j.agwat.2019.02.026 [ Links ]
ZENG WZ, WU JW, HUANG JS and MA T (2013) Effect of salinity on soil respiration and nitrogen dynamics. J. Ecol. Chem. Eng. Sci. 20 (3) 519-530. https://doi.org/10.2478/eces-2013-0039 [ Links ]
ZHENJIE Q, JIUSHENG L and WEIXIA ZH (2017) Effects of lateral depth and irrigation level on nitrate and Escherichia coli leaching in the North China Plain for subsurface drip irrigation applying sewage effluent. J. Irrig. Sci. 35 (6) 469-482. https://doi.org/10.1016/j.agwat.2006.12.014 [ Links ]
 Correspondence:
Javad Mozaffari
Email: javad_370@yahoo.com
Received: 26 June 2021
Accepted: 23 June 2022

