


Services on Demand
Article
 English (pdf)
 Article in xml format
 Article references
Indicators

Related links
-
 Cited by Google
 -
 Similars in Google
Share

 Permalink
Water SA
On-line version ISSN 1816-7950
Print version ISSN 0378-4738
Water SA vol.48 n.2 Pretoria Apr. 2022
http://dx.doi.org/10.17159/wsa/2022.v48.i2.3927
RESEARCH PAPER
The impacts of long-term flow reductions and an extreme drought on a large, permanently open estuary, and implications for setting the ecological reserve
Barry M ClarkI; Jane K TurpieII, III; James DS CullisIV; Jessica DawsonI; Louise DobinsonIV; Marie M KunnekeV; Annabel HornV
IAnchor Environmental Consultants (Pty) Ltd, 8 Steenberg House, Sllverwood Close, Tokai 7945, South Africa
IISouth African Institute for Aquatic Biodiversity, Somerset Street, Makhanda 6140, South Africa
IIIEnvironmental Policy Research Unit, School of Economics, University of Cape Town, Rondebosch 7701, South Africa
IVZutari (Pty) Ltd, 1 Century City Dr, Century City, Cape Town 7446, South Africa
VDepartment of Environmental Affairs & Development Planning, Western Cape Government, Cape Town, South Africa
ABSTRACT
Environmental water requirements (EWRs) are set for South Africa's estuaries to ensure that they are maintained in a state that is both achievable and commensurate with their level of conservation and economic importance. However, these EWRs are typically determined on the basis of models and scenario analyses that require extrapolation beyond existing data and experience, especially if climate change is considered. In the case of the Berg Estuary, South Africa, available data on changes in freshwater flow and water quality span a period of at least five decades (1970s-present) during which significant reduction in flows has been observed. Monitoring data also cover an extreme 3-year drought, from 2015-2017, which provided a unique opportunity to study the effects of severe freshwater starvation (zero-flow for an extended period) on this large, permanently open system. Our analyses show that mean annual runoff (MAR) under present-day conditions has been reduced to around 50% of that under reference (natural) conditions and that reduction in runoff during the low-flow season (summer) has been more severe (80-86% reduction) than for the high-flow season (39-42% reduction). The salinity gradient now extends much further upstream than under reference conditions. Hypersaline conditions along with a reverse salinity gradient were recorded in the estuary for the first time ever during the drought of 2015/17. Levels of dissolved inorganic nitrogen (NOx) reaching the estuary from the catchment have increased dramatically (6-7 fold) over the past five decades, dissolved reactive phosphate (PO4) slightly less so (2-3 fold), but ammonia (NH4) hardly at all. Increases in nutrient input from the catchment in the high-flow season are also much more dramatic than in the low-flow season. The estuary is no longer compliant with gazetted EWRs and requires urgent interventions to restore the quantity and quality of freshwater it receives.
Keywords: Berg Estuary, environmental flow requirements, estuary health, water quality, drought, climate change
INTRODUCTION
Estuaries are among the most biodiverse and valuable types of ecosystems globally, but their location in the landscape and their characteristics also make them extremely vulnerable to a wide range of pressures. Their health is dependent not only on direct management but also critically on the quantity and quality of freshwater inflows (Meynecke et al., 2006; Murrell et al., 2007; Sun et al., 2008). Because of the dependence on long-term monitoring data, understanding of how these inflows affect estuaries has generally been poor - but has improved, largely as a result of the development of legislation in countries such as Australia, South Africa and the USA that requires it (Adams, 2014).
South Africa's National Water Act (Act No. 36 of 1998) is a progressive piece of legislation that recognises the environment as a legitimate user in making decisions about water allocation. The Act contains provisions for setting environmental water requirements (EWRs) that would ensure that each estuary is maintained in a state of health that is both achievable and commensurate with their level of conservation and economic importance. The gazetted state of health to be managed for is expressed on a scale from natural to largely modified (A to D, or rarely E or F, highly/extremely degraded, if unavoidable), and is determined on the basis of the recommended ecological category (REC) from a conservation perspective and other socio-economic factors in the classification process (Dollar et al., 2010). The REC is based on the estuary's present health as assessed using the Estuary Health Index (EHI) in combination with the estuary's national importance rating (DWA, 2012a, Turpie et al., 2012). The EWRs are expressed in terms of the proportion (or sometimes absolute quantity) of natural mean annual runoff (MAR) that should be allowed to reach the estuary in each month, and the minimum water quality standards of these freshwater inflows. These EWRs form part of a broader set of resource quality objectives (RQOs) that include other measures that could impact on resource quality, such as fisheries management, and also take into consideration the need to balance potential trade-offs with other users.
The methods to set EWRs rely on good understanding of the relationship between the quantity and quality of freshwater inflows and the overall health of an estuary system, which means understanding the linkages between those inputs and estuarine hydrodynamics, sediment dynamics, primary productivity and the productivity and diversity of faunal assemblages across a range of taxonomic groups. Inevitably, such data are limited, and this requires drawing on data and understanding from similar systems and developing models to estimate the potential impacts ofchanging flows on the system. Furthermore, since EWR studies seek to identify limits of use of freshwater inflows in a growing economy, they generally have to consider scenarios that are well beyond observed experience. This is particularly the case when scenarios include future climate scenarios. This information is also critical in terms of determining the value of the estuaries.
EWRs and RQOs were gazetted for the Berg Estuary in the Western Cape, South Africa, on the basis of models developed using long-term monitoring data (DWS, 2019). However, this predated an extreme (approximately 1:300 year) drought event that saw the complete cessation of freshwater inflows to the estuary for an extended period and contributed to a water supply crisis for the City of Cape Town (Kaiser and Macleod, 2018). This natural experiment provided the opportunity to observe the effects on the water quality and ecological health of the system, and to develop insights into the potential implications of increasing water demands in a much drier climate, as is predicted for the future in this area (Engelbrecht et al., 2011).
This paper presents data on measured changes in flow in the lower Berg catchment over the past 50 years, estimates changes in runoff to the estuary over the same period, along with data on changes in the quality of freshwater flows reaching the estuary and water quality in the estuary itself, focusing on the effects of the drought in 2015 to 2017. We show that this large, permanently open estuary, which is relatively robust to freshwater reduction, will potentially become severely impacted by climate change, far more so than was previously assumed or projected for this system. The implication for biota that rely on the system as a nursery and foraging area and on ecosystem services it provides are profound, and underscore the importance of ensuring adequate quantities of water of good quality are set aside for estuaries the world over. This is increasingly important due to the risks of climate change and increasing demands for water.
Study area
The Berg Estuary is located approximately 130 km north of Cape Town on the west coast of the Western Cape Province, South Africa. The mouth of the estuary is permanently open, having been canalised in the late 1960s to facilitate the use of the estuary as a fishing port. The Berg River is about 160 km long from the headwaters to the sea. The lower reaches are extremely flat, with the result that tidal oscillations propagate upstream for about 69 km (Bath, 1989). The Berg is one of the country's largest estuaries, covering an area of 61 km2. It supports large areas of salt marsh, and high numbers and diversity of waterbirds and fish, and is ranked as one of the most important estuaries in the country in terms of its biodiversity (Turpie et al., 2002). Changes in the quantity, timing and quality of freshwater flows reaching the estuary from the catchment have been identified as major threats to the health of the estuary (Bennett, 1994; Slinger and Taljaard, 1994; De Villiers, 2007; Clark et al., 2009; Cullis et al., 2019; Van Niekerk et al., 2019).
The Berg River Catchment forms a major part of the Western Cape Water Supply System (WCWSS) which supplies the growing urban population of Cape Town and the surrounding irrigation farming and industrial areas from a number of interconnected reservoirs, including the 130 Mm3 Berg River Dam. As a result, the MAR reaching the estuary had dropped to around 70% of natural MAR by 1993 (Bennett, 1994) and 54% by 2010 (DWA, 2012b). Water quality in the catchment has also deteriorated significantly in recent years as a result of wastewater treatment works discharges and agricultural return flows. Levels of phosphate (PO43-) and nitrogen (NO3- + NO2-) in the Berg River have increased by between 1.5 and 2-fold since 1990 (De Villiers, 2007; Cullis et al., 2019), and levels of faecal coliforms and trace metals frequently exceed published safety guideline limits (Jackson et al., 2007, Paulse et al., 2007, Cullis et al., 2019).
The estuary's catchment area experienced a very severe drought over the period 2015-2017, rated as the worst drought in the Western Cape since 1904 (Botai et al., 2017; Otto et al., 2018; Wolski, 2018; Archer et al., 2019; Odoulami et al., 2020). Anecdotal reports suggest that flows to the estuary dried up completely for extended periods during this drought.
Climate change projections for the region indicate that the Western Cape is one of the most vulnerable regions of the country in terms of the potential for reduced rainfall and associated runoff as a result of climate change (Engelbrecht et al., 2011; Schulze, 2011; Midgley et al., 2011). Cullis et al. (2015) examined a hybrid frequency distribution (HFD) plot of likely climate change impacts across all the primary catchment areas of South Africa and found that the Berg catchment was one of only two primary catchments in the country where all scenarios considered under the analysis showed a reduction in MAR by 2050. Further analysis using a 10th percentile scenario from the HFD study (Cullis et al., 2015) suggests that climate change will likely reduce MAR in the Berg Catchment by around 15% and historical firm yield by around 60 Mm3 or 8% by 2050 (DWS, 2018). This will have a significant impact on the water available to the estuary and is a critical reason for an improved understanding of the impact on estuary health.
DATA AND METHODS
Overall approach
In this study we have sought to provide an overview of historical changes in the quantity and quality of freshwater reaching the Berg Estuary, how these have affected water quality in the system, how these impacts have been exacerbated by a recent major drought, and what implications this has for the health of the system now and in the future.
Hydrology and crop water requirements
The hydrological anlaysis aimed to provide an improved estimate of inflow to the Berg Estuary. To this end, an historical monthly estuary inflow time-series was constructed for the period June 1974 to May 2019 using the observed flows from the closest flow-gauging station to the estuary, G1H031, located at Misverstand Dam, some 100 km upstream of the estuary. The observed flows were adjusted to take into account losses and gains between the gauging station and the estuary as a result of estimated irrigation demands, contributions from incremental catchments and natural river losses and losses due to invasive alien plants (IAPs). Irrigation water requirements downstream of G1H031 were derived by estimating the gross demand calculated as the A-pan evaporation for quaternary catchment G10K multiplied by the crop factor. The relevant crop factors were obtained from the 1990 Surface Water Resources of South Africa Study, WR90 (Midgely et al., 1994). The net demand is then estimated as the gross demand less the effective rainfall (actual rain x effective rainfall which was assumed to be 65%). The historical crop water requirements were applied to mapped areas of different crop types sourced from the 2013 Western Cape Crop Census (DOA, 2013) and the 2017/18 Western Cape Crop Census (DOA, 2018), and for the period before 2000 the estimated irrigation areas from the Water Resources 1990 study (Midgley et al., 1994) were used. The distribution of crops was assumed to be the same as for the Crop Census 2018, and a linear growth was applied to obtain the irrigation areas for each year in the time-series. Estimated losses due to IAPs were derived from the Consolidated Drought Support Project for the City of Cape Town (Aurecon, 2019). This study showed that IAPs currently reduce total system yield by 27 Mm3/a and that this could increase to as much as 95 Mm3/a or 17% by 2045. This is consistent with previous studies in the region (Cullis et al., 2007; Le Maitre, 2016). Three hydrological scenarios were considered: a 'Natural' scenario, which is equivalent to the reference conditions and assumes no upstream infrastructure or irrigation demands; a 'Present Day' scenario, which is based on the estimated irrigation demands downstream of Misverstand Dam, as well as the current infrastructure including the Berg River Dam and upstream demands; and a 'Future Scenario' which takes into account planned infrastructure development to augment the Western Cape Water Supply System (WCWSS, the Berg River Voelvlei augmentation scheme). A climate change scenario was also generated which was based on a 10th percentile 'dry' scenario using the results of the hybrid frequency distribution (HFD) study (Cullis et al., 2015) and imposed on each of the hydrological scenarios.
Water quality
The water quality analysis examined changes in salinity and nutrients in the estuary from the 1970s up to and including the recent drought, and related the observed patterns to the hydrological inflows. While some of these data have been published, most were extracted from the grey literature:
• Data on physical properties (temperature, salinity, dissolved oxygen), nutrients (nitrite, nitrate, total ammonia, reactive phosphate), chlorophyll a, and faecal coliform bacteria from 18 stations distributed along the length of the estuary, collected on various occasions in 1975, 1976, 1989, 1990 and 1995. Details on methods used for collection and analysis of the samples are provided in Slinger and Taljaard (1994), Eagle and Bartlett (1984), Taljaard et al. 1992, and Slinger and Taljaard (1994, 1996).
• Data on physical properties (temperature, salinity, dissolved oxygen) and nutrients (nitrite, nitrate, total ammonia, reactive phosphate) from ~25 sites distributed up the length of the estuary collected by the authors as part of the Department of Water Affairs and Forestry Berg River Baseline Monitoring Programme on several occasions in the period 2003-2005 (Clark and Ractliffe, 2007).
• Continuous monitoring data on temperature and salinity at two sites in the Berg Estuary over the period 2012-2019 supplied by the Department of Water and Sanitation (DWS) and West Coast District Municipality (WCDM).
• Data on physical properties (conductivity), nutrients (nitrite, nitrate, total ammonia, reactive phosphate) and faecal coliform bacteria available for a range of sites in the Berg River Catchment (12 sites) and Estuary (10 sites), collected at monthly intervals over the period 2013-2019 as part of the Berg River Improvement Plan (BRIP), supplied by the Department of Environmental Affairs & Development Planning (DEA&DP) (unpublished data) and Cullis et al. (2019).
• Data on physical properties (conductivity, pH) and nutrients (nitrite, nitrate, total ammonia, reactive phosphate) collected by the DWS: Resource Quality Information Services (RQIS, unpublished) from various sites in the Berg River Catchment and Estuary between 1965 and 2019.
Locations of sampling stations for these monitoring programmes are given in Fig. 1.
RESULTS
Hydrology and crop water requirements
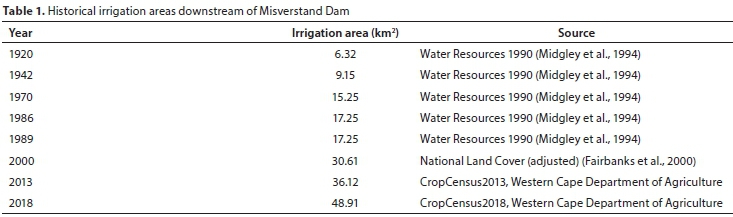
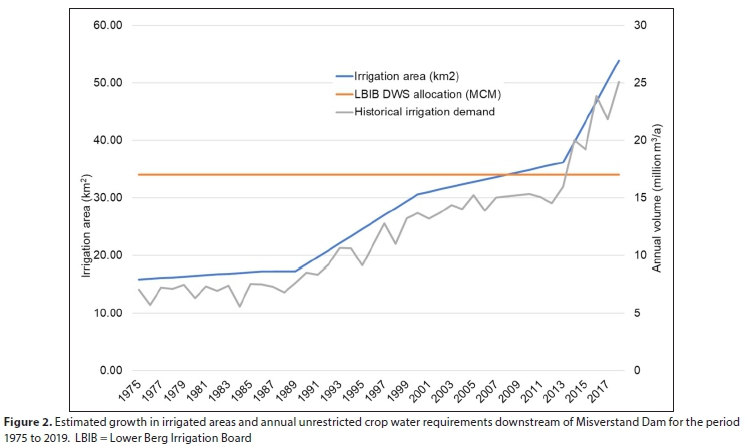
The total irrigated area below Misverstand Dam consisted of a range of different crop types and was estimated to be 3 612 ha in 2013 and 4 891 ha in 2018. The total gross unrestricted crop water requirement for 2013 was estimated at 21.3 Mm3/a, and the net demand was 18 Mm3/a (taking into account effective rainfall and irrigation efficiency). Similarly, the total mean monthly crop water requirements for 2018 was estimated at 26.3 Mm3/a, and the net demand at 21.6 Mm3/a. A summary of the estimated irrigated areas from 1920 to 2018 is shown in Table 1 and estimated crop water requirements from 1975 to 2017 are shown in Fig. 2. There has been a steady increase in irrigated crop areas from 1920 to about 1989, when a sharper increase in irrigation areas (and presumably water use) began for the period 1990 to 2000, and then another very sharp increase after 2012 to 2018. However, water use in the Lower Berg River is managed through specific allocations from the Department of Water and Sanitation (DWS). The current registered allocation for irrigation water use downstream of Misverstand Dam is 17 Mm3/a with 4.05 Mm3/a allocated in summer from Voelvlei Dam, 5.37 Mm3/a from run-of-river in summer, and 7.60 Mm3/a from run-of-river in winter. The analysis suggests that these allocations would have been exceeded from around 2014 due to a combination of the increase in irrigated area and the reduced rainfall during the drought. Climate change is expected to increase irrigation demands by a further 6% by 2050 (Cullis et al., 2015).
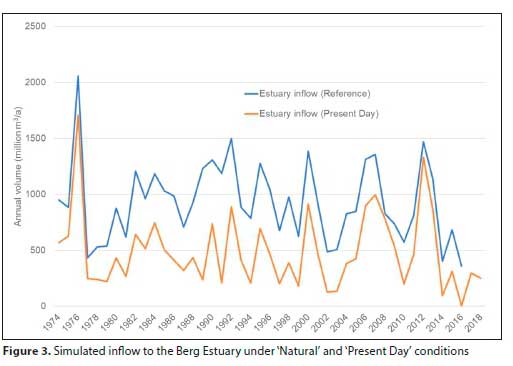
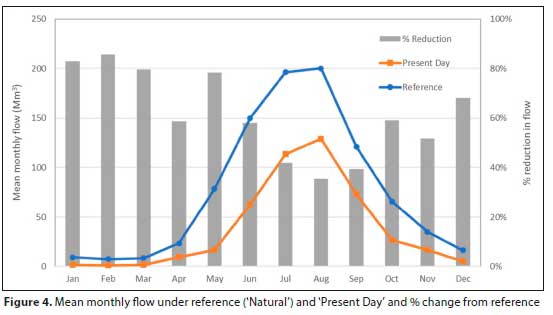
The hydrological time-series analysis (Fig. 3) suggests that flows reaching the estuary under present-day conditions have been reduced quite dramatically, by 50% overall relative to natural (reference) conditions (natural MAR = 912.4 Mm3/a, present day MAR = 459.2 Mm3/a), and that reductions during the dry season (summer, 80-86%) are much more significant than during the high-flow season (winter, 39-42%; Fig. 4). The increased irrigation demands have resulted in a modest reduction in overall annual volume of water reaching the estuary but a very marked reduction in dry season (summer) flows (Fig. 5). Also clear from this analysis is the marked reduction in flows reaching the estuary during the drought (2015-2017), relative to the rest of the flow record. The flow duration curve for summer month flows (Fig. 5) shows that even under natural conditions the minimum flow requirement for the estuary of 0.6 m3/s is only met 35% of the time, while under the present day this drops to around 16% if irrigation use is restricted to the current DWS allocations, and drops below 10% based on the unrestricted crop water requirements below Misverstand Dam.
Salinity, temperature and dissolved oxygen
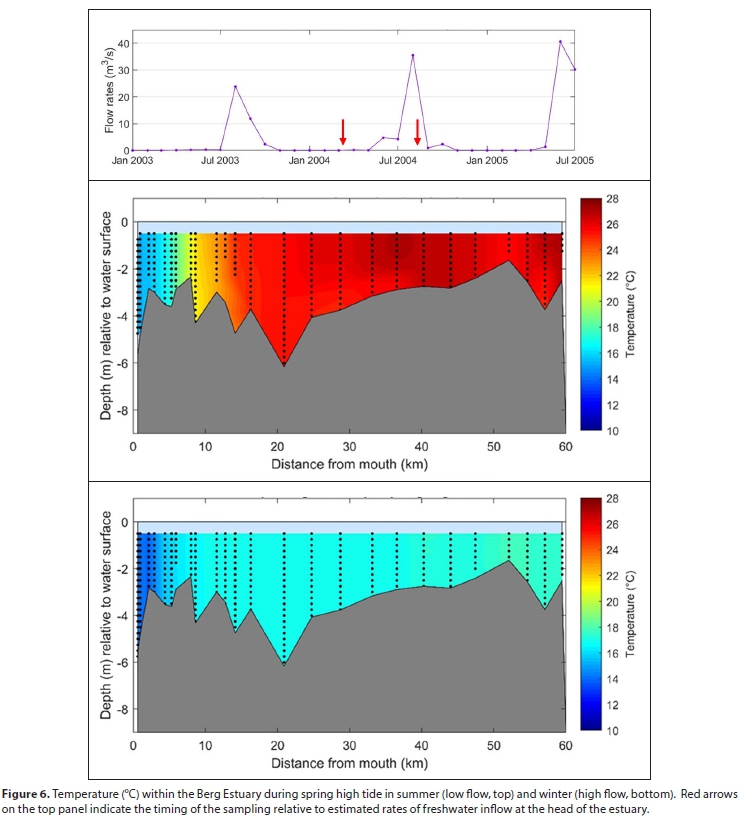
Data on temperature and salinity in the Berg Estuary indicate that the system is well mixed throughout its length. Examples of temperature and salinity profile data collected during the low-flow season (summer) and high-flow season (winter), which are typical of these seasons, are shown on Fig. 6. Under high-tide conditions in summer there is generally a marked longitudinal gradient in temperature, being lowest (10°C) near the mouth due to seasonal upwelling in the sea and advection of this cool upwelled water into the lower reaches through tidal action, but increasing rapidly with distance upstream where it matches that of the air temperature which can reach up to 30°C or more. In winter (the high-flow season), the longitudinal temperature gradient is much less marked, solar insolation and upwelling intensity are much reduced and water temperature in the Berg Estuary typically ranges from around 14°C at the mouth up to a maximum of around 18°C in the upper reaches (Fig. 6). Longitudinal stratification is much reduced in both summer and winter under low-tide conditions, when the cooler seawater is forced back out of the mouth.
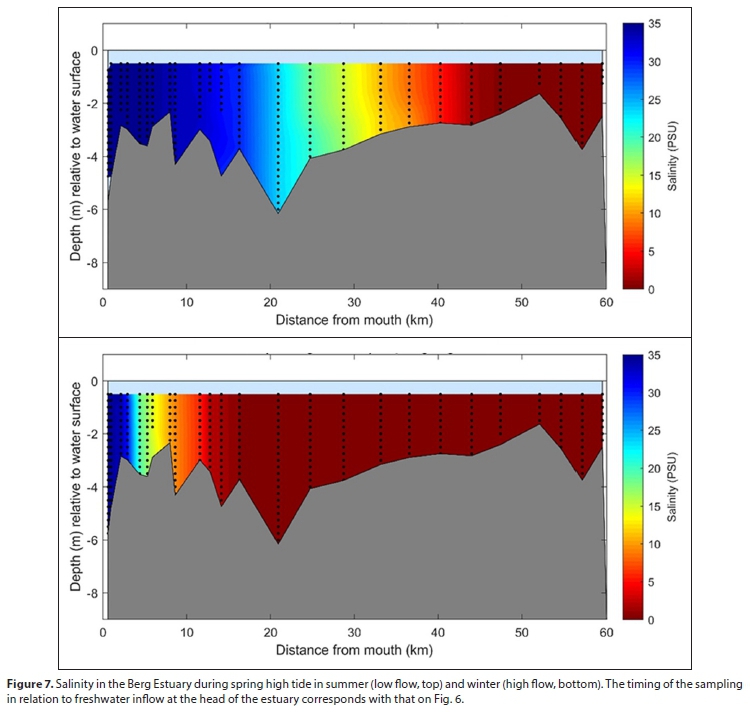
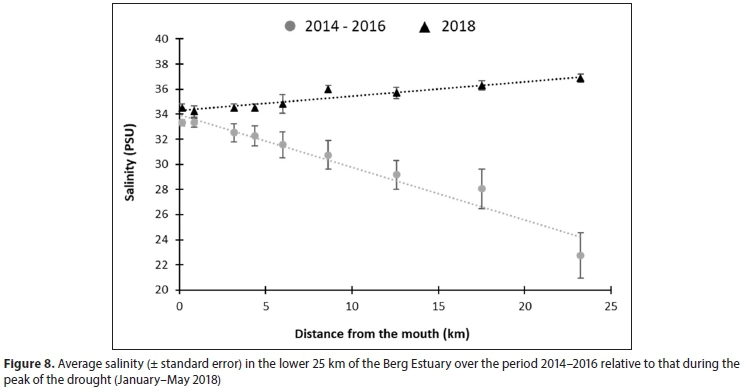
There is a marked salinity gradient that extends up the length of the estuary in both low and high flow seasons. Saline influences extend much further upstream during the low-flow (typically around 40-45 km) compared with the high-flow season (3-15 km, Fig. 7). Conditions recorded in the estuary during the drought of 2015 to 2017 were somewhat anomalous as a reverse salinity gradient developed in the estuary in summer and autumn (lowflow season, Jan-Jun) of 2017 and 2018, with salinity increasing from levels typical of normal seawater (34.5) at the mouth up to a peak of 37.2, 23 km upstream (Fig. 8). This is the first time such a reverse salinity gradient, and indeed hypersalinity, has been recorded in the Berg Estuary.
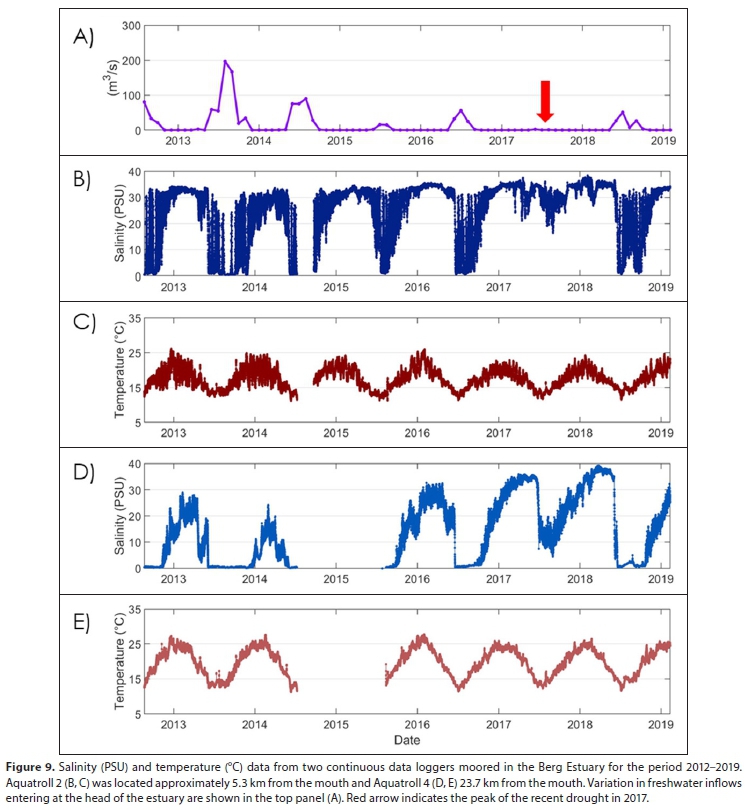
The continuous monitoring data from mid-2012 highlighted the typical daily and longer-term seasonal variations in temperature and salinity, along with the anomalous conditions experienced during the recent drought (Fig. 9). Short-term (daily) variations in temperature and salinity were both much more marked in the lower estuary (Aquatroll 2, 5.3 km from the mouth) compared with further upstream (Aquatroll 4, 23.7 km from the mouth). The effects of the drought on salinity, especially in the lower reaches of the estuary, were also very clear - salinity levels recorded by Aquatroll 2 did not drop below 17 for a period of more than 18 months. Effects of elevated salinity in the estuary during the drought were evident as far upstream as Jantjiesfontein (52 km upstream of the mouth), where salinity levels above 4 were recorded at a site where they seldom rise above 2 (Fig. 10). Incidences of hyper-salinity (>35) were recorded at the continuous monitoring station 23 km from the mouth (Fig. 9), over an extended period in 2017 (30 March-12 June, 26% of records) and again in 2018 (22 Jan-03 Jun, 13% of records, Fig. 9) but none in the period prior to (21 Aug 201229 Mar 2017), or after this (03 Jun 2018-22 May 2019).
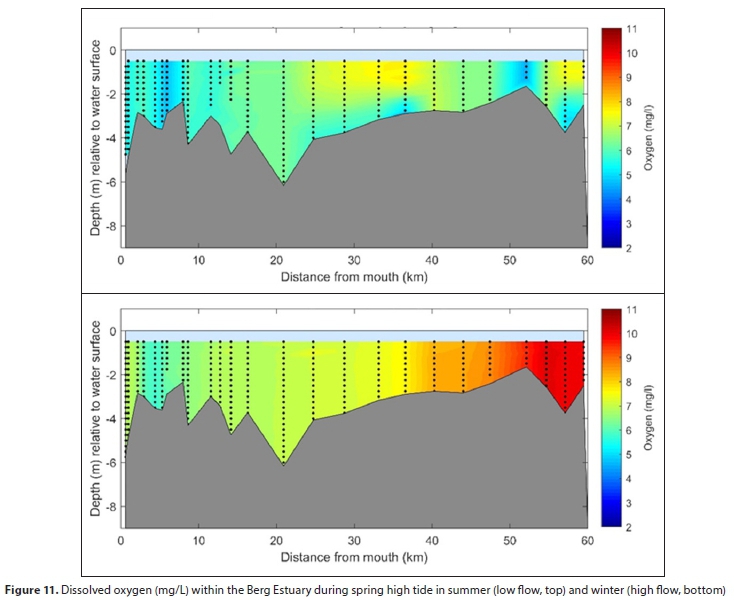
Levels of dissolved oxygen are strongly linked with temperature. Thus, levels of oxygen were typically higher (above 6 mg/L) in the high-flow season (winter) when the temperature across the entire estuary was low (<20°C, Fig. 11). During the low-flow season, upwelling at sea often brings oxygen-depleted waters up to the surface and into the lower reaches of the estuary, which, in combination with elevated temperatures further upstream, means that oxygen levels are typically low (<7 mg/L) throughout the system. Pockets of low-oxygen water (DO < 4 mg/L) are also often found close to the bottom in the upper and middle reaches of the estuary during the low-flow season. These pockets of low-oxygen water develop as a result of poor flushing at this time of the year, decomposition of organic matter in the warm water, and the uptake of oxygen by microalgae and macrophytes at night.
Nutrients
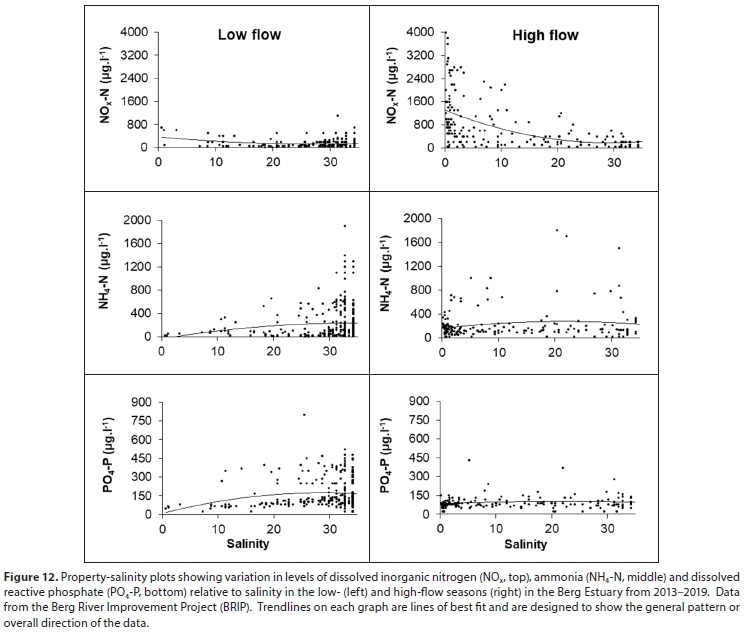
Data on levels of dissolved inorganic nutrients (nitrite, nitrate, ammonia, phosphate) in the Berg Estuary and river inflow were available from a number of surveys conducted in the period 1975 to 2019. Data on nutrient levels were plotted against salinity to examine an assessment of the relative importance of different sources of nutrients (freshwater inflow at head of the estuary, seawater inflow at the mouth) and processes that operate within the estuary (uptake and remineralisation). Monthly sampling of nutrient levels in the estuary undertaken as part of the Berg River Improvement Project (BRIP), collected over the period 2013-2019, provides a clear indication of some of these patterns.
Only data collected in those periods that could be clearly classified as being in the low-flow (summer) season (at least 2 months after winter high flows had subsided) or high-flow season (winter, after the onset of the winter rains) are presented here (Fig. 12). River inflow at the head of the estuary is clearly the primary source of dissolved inorganic nitrogen (NOx = NO2 + NO3) in the system, with levels peaking at around 4 000 μg/L at salinities <2 in the high flow season in the most recent survey data (2013-2019). Levels of NOx were much lower (<1 000 μg/L) in the fresh water at the head of the estuary in summer (low-flow season), and similar to levels in seawater at the estuary mouth during both seasons. Levels of NOx drop off very rapidly as salinity increases with distance downstream, stabilising at salinity levels of around 20 (Fig. 12) or around 20 km upstream of the mouth (Fig. 13). During the low-flow season, salinities at the head and mouth of the estuary are similar, but are typically lowest at intermediate salinities (15) which were recorded in the middle reaches of the estuary (15-20 km upstream of the mouth).
The impacts of the recent drought (2015-2017) on nutrient inputs to the Berg Estuary are most clearly evident in data on levels of DIN (NOx) in the estuary from the BRIP programme. DIN levels typically spike each year during the high-flow (winter) season at all sites in the estuary, with the magnitude of the spike diminishing with distance upstream, as the nutrient-rich freshwater is diluted to an increasingly greater extent by the less nutrient-rich seawater. However, there was a complete absence of a spike in the 2017 high-flow (winter) season due to the below-average flows (Fig. 14).
Levels of dissolved inorganic phosphate (DIP) were slightly higher in the low-flow (summer) period (peaking at between 500 and 800 μg/L) than in the high-flow (winter) season (peaking at around 200-500 μg/L). In the low-flow (summer) season, levels of DIP were highest near the mouth (salinity >30) but remained high in some samples until salinity dropped below 10, at which point level of DIP also dropped off very sharply. In the high-flow season (winter) levels of DIP were mostly low (<200 μg/L) across the full salinity gradient, with odd samples registering levels higher than this (up to 450 μg/L).
When variations in the levels of these nutrients were examined in relation to distance upstream, using data collected through BRIP programme (which covers the period 2013-2019 and the lower 25 km of the estuary only), patterns were similar to that evident when data were plotted against salinity, except for ammonia (Fig. 13). Levels of DIN in the low-flow (summer) period were low (<200 μg/L) throughout the lower and middle reaches of the estuary but showed a clear increase with distance upstream in the high-flow season. Ammonia levels declined with distance upstream in both the low- (summer) and high-flow (winter) seasons, the latter not immediately evident in the full dataset and possibly linked to the fact that the BRIP data cover only the lower and middle reaches of the system. Little variation was evident in levels of PO4 with distance upstream but levels were clearly higher in the low-flow (summer) as opposed to the high-flow (winter) season, which is similar to the trend observed when these data were plotted against salinity.
Nutrient levels have also changed dramatically over the past 30 years, primarily in respect of the amount of DIN (NOx) with the freshwater inflow at the head of the estuary. Peak levels of DIN in river inflow in the high-flow season increased dramatically in both the low-flow (summer) and high-flow (winter) seasons, while those in seawater at the mouth of the estuary barely changed at all (Fig. 15). Peak levels in river inflow during the low-flow (summer) season increased from around 100 μg/L in 1990 to around 700 μg/L in the past decade (2013-2019). and from around 600 μg/L in 1989 to around 4 000 ug/L in the high-flow (winter) season. Levels of NH4 seem to have become much more variable throughout the estuary in the past decade relative to preceding decades (1990, 2000), but have not increased per se (Fig. 16). Peak levels of PO4 in the influent river water in the low-flow season increased from around 30 μg/L in 2005 (no data available from the head of the estuary prior to this) to around 70 μg/L in the past decade (20132019), and in the high-flow season from around 50 μg/L in the 1970s to around 150 μg/L in the past decade (Fig. 17). These data also indicate that peak levels of PO4 in seawater at the mouth of the estuary may also have increased over the same period, but not nearly as much as in the influent freshwater - an increase that is also to some extent masked by a much greater increase in variability.
DISCUSSION
South Africa enacted legislation in 1998 (National Water Act, No. 36 of 1998) that provides for the protection of the 'ecological reserve, which is one of a suite of measures designed to ensure that the country's water resources are used (and maintained) in such a way as not to compromise the economic opportunities and social wellbeing of future generations. An ecological reserve is supposed to be set for all significant water resources in the country (which include rivers, wetlands, estuaries and groundwater) at a level defined in terms of the quantity and quality of freshwater that it receives (the 'resource quality objectives' or RQOs), which is adequate to ensure that the resource in question is maintained in a state of health that is both achievable and commensurate with its level of conservation and economic importance, but also balances the demand for water for other uses in the catchment. While environmental water requirements (EWRs) have been determined for almost all estuaries in the country, at least at a basic level, and RQOs have been determined for a large portion of these estuaries, very little effort has been invested in auditing compliance with the RQOs or in assessing the impacts of non-compliance on estuary health. This represents one of the first studies in this country where this has actually been done.
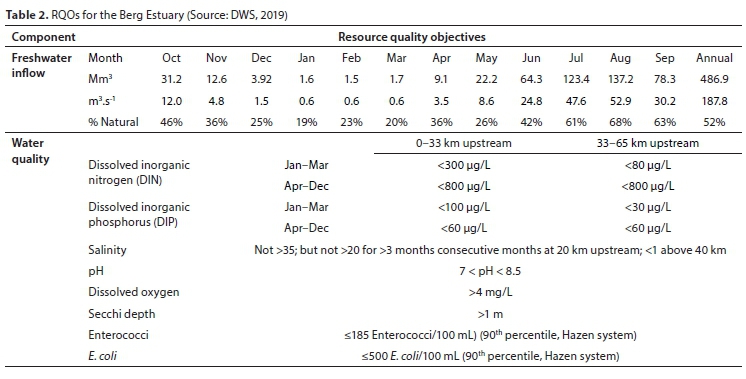
The 'target ecological category' (TEC) and requisite RQOs were gazetted for the Berg Estuary in 2019 (DWS 2020). based on results of an environmental flow assessment (EFA) completed in 2012 (DWA, 2012b) and a classification study completed in 2018 (DWS, 2018). At the time of publication, the estuary was rated as second-most important in the country (Turpie et al., 2002); the PEC and TEC were determined to be a 'C' (moderately modified), and the RQOs designed to maintain the estuary in this state of health are listed in Table 2. Values specified for the RQOs were linked with tolerance thresholds for biota in the estuary identified during the EFA study. Of critical importance was the fact that it was recommended that freshwater inflows to the estuary not be allowed to drop below 0.6 m3/s as this was the minimum flow necessary to ensure adequate flushing and to minimise the risk of water stagnating and becoming hypoxic in the upper reaches of the estuary during the warm summer months (DWA, 2012b).
Results from this study, which extended the hydrology to 2019 and included the recent drought, place the MAR reaching the estuary at around 459.2 Mm3/a, which is only 6% less than that estimated in 2012 (486.86 Mm3/a), but has highlighted the fact that freshwater flows reaching the estuary during the low-flow season (summer) are considerably lower than that estimated by DWA (2012b) and also markedly lower than the minimum flow specified in the gazetted RQOs. In fact, it is clear from this study that flows during the summer months often dropped to zero and remained at this level for many months during the recent drought.
The main reasons for the discrepancy between estimated inflows to the estuary from this study and the previous one is that flows reaching the estuary were not explicitly measured or even modelled in the latter study, the assumption being that a sufficiently large portion of the water released from Misverstand Dam would actually reach the estuary and that any losses en route would be balanced by inflows from incremental catchments. Estimates of flows from this study suggest that the amount of water abstracted for irrigation purposes from the section of river between Misverstand Dam and the top of the estuary, and that taken up by IAPs, is generally not offset by inflows from the incremental catchments joining the river below the dam, especially during the summer months when water demand is high and rainfall is low. This, coupled with what has clearly been an increase in nutrient inputs from the catchment, has had a severe impact on water quality in the estuary. During the recent drought, river flows essentially stopped reaching the estuary, which is the first time that this has been observed and thus provided an opportunity to investigate the water quality and ecosystem health impacts that can better inform the assessment of the possible impacts of further flow reductions and not meeting the EWRs.
These findings strongly highlight the importance of investing in good quality flow data/hydrology. If a proper investment had been made in collecting good hydrological data in earlier studies much of this conflict with the gazetted RQOs could have been avoided or addressed sooner. Addressing such concerns post allocation and/or dam construction is much more costly and very often not possible.
Continuously recorded data on salinity levels (one measurement taken every 2 hours) are available for two recording stations in the Berg Estuary - one at 5.3 km upstream of the mouth and the second at 23.7 km upstream (Fig. 9). Data from the second station indicate that salinity levels did not exceed 20 for more than 3 months in 2013 or 2014 as required by the RQOs, but did exceed this level in 2016, 2017, 2018 and 2019. Regrettably, no data are available for 2015. A good portion of this period of non-compliance is covered by the extreme drought of 2015-2017, during which one could reasonably expect that requirements for compliance with the RQOs would have been suspended. However, this does not account for non-compliance in 2018 and 2019, which is more likely linked with reduction in freshwater flows reaching the estuary as a result of the recent increases in the volume of water abstracted from the river for irrigation purposes (Fig. 2). It seems, therefore, that non-compliance with the flow RQOs highlighted above during and subsequent to the drought is translating into non-compliance with salinity RQOs as well, as might have been predicted in the EFA study. Incidences of hyper-salinity (salinity levels > 35), also a contravention of the RQO limits, were recorded in middle reaches of the estuary in the monthly monitoring data collected as part of this study in summer and autumn (low-flow season, Jan-Jun) of 2017 and 2018 and also at the second of the two continuous monitoring stations (23.7 km upstream of the mouth) over a similar period in 2017 and 2018, but none in the period prior to (21 Aug 2012 - 29 Mar 2017), or after this (03 Jun 2018 to 22 May 2019). The incidences of hyper-salinity recorded in 2017 were within the period of the recent drought, or at least the period of below-average rainfall that extended from 2015-2017 (Botai et al., 2017; Wolski, 2018; Otto et al., 2018; Odoulami et al., 2020), and could be considered excusable, but this is not the case for those recorded in 2018, which are presumably linked to over-abstraction of water from the river in the period after the end of the drought.
Monitoring data collected from 1975 to 2019 confirmed that river inflow at the head of the estuary is the primary source of dissolved inorganic nitrogen (NOx = NO2 + NO3) in the system, with levels peaking at around 4 000 μg/L in the high-flow season (winter), but dropping in recent years to around 700 μg/L. The latter is similar to levels measured in seawater at the mouth of the estuary during both seasons. There has been a marked increase in levels of DIN in the river inflow at the head of the estuary over time, which is consistent with observed increases higher up in the catchment (DWAF, 2004; De Villiers, 2007; DWA, 2012b, c; De Villers and Thiart, 2007; Struyf et al., 2012; Magoba, 2018; Cullis et al., 2019). These changes are linked to increased agricultural activities, human settlements and wastewater inputs in the catchment. While the reported levels of DIN in seawater at the mouth of the estuary may seem high (up to 700 μg/L), these are in line with levels that are typically recorded in the Benguela region (Barber and Smith, 1981; Chapman and Shannon, 1985; Brown and Hutchings, 1987; Bailey and Chapman, 1991; Brown, 1992), which is one of the most intense upwelling regions in the world.
The rapid drop-off in levels of NOx with salinity in the high-flow season, more rapid than one might expect as a result of simple dilution, and the convex curvature of the slope of the gradient evident in both the high- and low-flow seasons, are both indicative of significant uptake of DIN within the system at this time (Church, 1986; Fisher et al., 1988; Balls, 1994; Eyre, 2000; Ferguson et al., 2004). This suggests that DIN concentration plays an important role in controlling primary production in the system.
The impacts of the recent drought (2015-2017) on nutrient inputs to the Berg Estuary are also clearly evident in data presented in this paper, particularly those for DIN. DIN levels typically spike each year during the high-flow (winter) season at all sites in the estuary, with the magnitude of the spike diminishing with distance upstream as the nutrient-rich freshwater is diluted to an increasingly greater extent by the less nutrient-rich seawater. However, there was a complete absence of a spike in the 2017 high-flow (winter) season, due to below-average flows at this time of year and less wash-off of nutrients into the river than usual.
Levels of ammonia (NH4-N) in the estuary were similar in the high- and low-flow seasons (peaking at around 2 000 μg/L). However, variation in relation to salinity was very different for the two seasons. In both seasons, levels were lowest in the middle reaches of the estuary (again pointing to significant uptake of this nutrient by primary producers in the estuary, and its importance in controlling primary production in the system). In the low-flow season (summer), ammonia levels were very much higher in the lower as opposed to the upper reaches of the estuary, and suggest that the sea (or possibly a point-source of ammonia in the lower reaches of the estuary) are the primary sources of ammonia in the system at this time. In contrast to DIN, however, peak levels of ammonia measured at the mouth of the estuary were considerably higher than those measured in newly upwelled water (Chapman and Shannon, 1985; 30-100 μg/L), and may be linked with discharge of effluent from a fish-processing plant located at the mouth of the estuary, effluent from which generally contains very high ammonia levels (Christie and Moldan, 1977; Monteiro et al., 1997). Levels of ammonia seem to have become much more variable throughout the estuary in the past decade relative to preceding decades (1990, 2000), but have not increased per se.
Levels of dissolved inorganic phosphate (DIP) in the Berg Estuary were slightly higher in the low-flow (summer) period than in the high-flow (winter) season and were elevated at salinities above 10 during the low-flow season. These data suggest that, at least in summer (low-flow season), the sea (or a point-source in the lower estuary) is the primary source of DIP in the system and that the sea and freshwater inflow contribute more of less equally in winter (high-flow season), and that there is little or no evidence of DIP uptake, or that this nutrient exerts any control over primary production in the estuary. There has been a marked increase in levels of DIP in freshwater entering at the head of the estuary since the 1970s, particularly in the high-flow season, which seems to mirror changes observed in levels of DIN. A similar increase in the DIP in the upper reaches of the Berg River has also been observed, particularly during the period of the drought, and is associated with urban and rural developments in the catchment (Cullis et al., 2019).
Under natural conditions, inorganic N and P inputs to the estuary from the Berg River were probably low, considering that much of the catchment, especially that part from which perennial flow is derived, is comprised of Table Mountain Sandstone (TMS) which typically leaches very few ions (Fourie and Gorgens, 1977; Bath, 1993; Day, 2007). Vegetation in the Berg River Catchment is mainly fynbos (Harrison and Elsworth, 1958; Mucina and Rutherford, 2006), which is nutrient-poor and decomposes very slowly (Mitchell et al., 1986; Mitchell and Coley, 1987; Witkowski, 1991). Over time, human activities in the catchment have increased runoff ofnutrients into the Berg River (Cullis et al., 2019), hence increasing contributions from this source to the estuary. This, coupled with increases in retention time of influent water into the estuary as a result of reduced freshwater inflow (estimated to be around 50% in this study), will have greatly increased the amount of nutrients available for primary production in the estuary. Although there are limited data to support this, a study by Snow and Bate (2009) showed that levels of Chl-a in the Berg Estuary had increased dramatically relative to those measured a decade earlier by Slinger and Taljaard (1994). Slinger and Taljaard (1994) recorded levels of between 1.0 and 1.25 μg/L during the high-flow season (winter) of 1989 and between 0.1 and 0.4 μg/L during the low-flow season (summer) of 1990, while Snow and Bate (2009) measured levels in the range 0.2-8.0 μg/L and 6-10 μg/L in the low- and high-flow periods in 2005, respectively. They attributed the observed increases to corresponding increases in nutrient level, and it is likely that this has increased still further since this time given the subsequent increases in nutrient levels reported in this study.
Reductions in freshwater inflow and increases in nutrient inputs and their concomitant impacts on other drivers (e.g. retention time, water temperature, dissolved oxygen concentration) and response variables (primary production, invertebrates, fish and bird populations) has had a profound impact on the ecological functioning and health of the Berg Estuary. In a study commissioned by DWA (2012), based on data available at the time (mostly collected in the period prior to 2008), it was estimated that the health of the estuary had dropped to a 'C' category (defined as 61-75% of natural) using the Estuary Health Index (EHI, Turpie et al., 2012). This finding, coupled with the recognised importance of the system from a conservation and socio-economic perspective, resulted in the TEC being gazetted at the same level ('C' category: DWS, 2019), which implies that the system should not be allowed to degrade beyond this point. Data presented in this study suggest that this requirement has not been upheld and that the health of this important estuary has been allowed to degrade further. Indeed, using the data presented here, along with data on measured changes in other biotic response variables (vegetation, fish and birds), DEADP (2020) suggest that this estuary is now in a 'D' category (41-60% of natural). Importantly, this assessment is based not on the impacts of the recent drought alone, but on likely impacts of current levels of inflow, nutrient input, etc., applied over an extended (70-year) period. Given that most climate change scenarios forecast a reduction in rainfall for the region and that this, combined with continued growth in demand for water from upstream users, will likely lead to a further reduction in inflows to the estuary. This is likely to lead to a further degradation in the ecological health of the estuary and suggests that urgent action is needed. It is proposed that practical solutions, such as increasing the storage capacity at Misverstand Dam and improved monitoring and enforcement for downstream users, be introduced to ensure that the minimum flows are achieved during the summer months; however, a greater challenge will be to address the much larger impact on winter flows as a result of climate change, which could see as much as a 34% reduction in the MAR under the current development scenario. This is likely to require much harder decisions about the allocation of water to different users and a potential trade-off in terms of the value of the estuary.
The reason that this has been allowed to happen is most probably linked to the lack ofgood monitoring data for this system, particularly in respect of its physico-chemical drivers such as freshwater flow and water quality. Recent initiatives to improve coverage of water quality monitoring in the system must be commended, but the lack of a monitoring station where flows reaching the estuary can be accurately gauged remains a serious problem.
ACKNOWLEDGEMENT
This study has been funded by the Department of Environmental Affairs and Development Planning (DEA&DP), Western Cape Government.
REFERENCES
ADAMS JB (2014) A review of methods and frameworks used to determine the environmental water requirements of estuaries. Hydrol. Sci. J. 59 (3-4) 451-465. https://doi.org/10.1080/02626667.2013.816426 [ Links ]
ARCHER E, LANDMAN W, MALHERBE J, TADROSS M and PRETORIUS S (2019) South Africa's winter rainfall region drought: A region in transition? Clim. Risk Manage. 25 1-8. https://doi.org/10.1016/j.crm.2019.100188 [ Links ]
AURECON (2019) Consolidated Drought Support Project. Report prepared for the City of Cape Town. Aurecon, Cape Town. [ Links ]
BAILEY GW and CHAPMAN P (1991) Short-term variability during an anchor station study in the southern Benguela upwelling system: Chemical and physical oceanography. Prog. Oceanogr. 28 (1-2) 9-37. https://doi.org/10.1016/0079-6611(91)90019-I [ Links ]
BALLS PW (1994) Nutrient inputs to estuaries from nine Scottish east coast rivers; influence of estuarine processes on inputs to the North Sea. Estuar. Coast. Shelf Sci. 39 329-352. https://doi.org/10.1006/ecss.1994.1068 [ Links ]
BARBER RT and SMITH RL (1981) Coastal upwelling ecosystems. In: Longhurst AR (ed) Analysis of Marine Ecosystems. Academic Press, London. 31-68. [ Links ]
BATH A (1993) Western Cape System Analysis. Water Quality. Volume 1: General. Report No P G000/00/2891. Ninham Shand report to Department of Water Affairs and Forestry, South Africa. [ Links ]
BENNETT BA (1994) The fish community of the Berg Estuary and an assessment of the likely effects of reduced freshwater inflows. Afr. Zool. 29 118-125. https://doi.org/10.1080/02541858.1994.11448336 [ Links ]
BOTAI CM, BOTAI JO, DE WIT JP, NCONGWANE KP and ADEOLA AM (2017) Drought characteristics over the Western Cape Province, South Africa. Water SA. 9 876 https://doi.org/10.3390/w9110876 [ Links ]
BROWN PC (1992) Spatial and seasonal variation in chlorophyll distribution in the upper 30 m of the photic zone in the southern Benguela/Agulhas ecosystem. S. Afr. J. Mar. Sci. 12 515-525. https://doi.org/10.2989/02577619209504722 [ Links ]
BROWN PC and HUTCHINGS L (1987) The development and decline of phytoplankton blooms in the southern Benguela upwelling system. I. Drogue movements, hydrography and bloom development. S. Afr. J. Mar. Sci. 5 (1) 357-391. https://doi.org/10.2989/025776187784522801 [ Links ]
CHAPMAN P and SHANNON LV (1985) The Benguela ecosystem Part ll. Chemistry and related processes. Oceanogr. Mar. Biol. Annu. Rev. 23 183-251. [ Links ]
CHRISTIE ND and MOLDAN A (1977) Effects of fish factory effluent on the benthic macrofauna of Saldanha Bay. Mar. Pollut. Bull. 8 (2) 41-45. https://doi.org/10.1016/0025-326X(77)90345-9 [ Links ]
CHURCH TM (1986) Biogeochemical factors influencing the residence time of microconstituents in a large tidal estuary, Delaware Bay. Mar. Chem. 18 393-406. https://doi.org/10.1016/0304-4203(86)90020-4 [ Links ]
CILLIERS GJ and ADAMS JB (2016) Development and implementation of a monitoring programme for South African estuaries. Water SA. 42 (2) 279-290. https://doi.org/10.4314/wsa.v42i2.12 [ Links ]
CLARK BM and RACTLIFFE G (2007) Berg River Baseline Monitoring Programme. Final Report - Volume 3: Estuary and Floodplain Environment. Report No. P WMA 19/G10/00/1907. Department of Water Affairs and Forestry, Pretoria. [ Links ]
CLARK BM, HUTCHINGS K and LAMBERTH SJ (2009) Long-term variations in composition and abundance of fish in the Berg Estuary, South Africa. Trans. R. Soc. S. Afr. 64 (2) 238-258. https://doi.org/10.1080/00359190909519255 [ Links ]
CULLIS JDS, GORGENS AHM and MARAIS C (2007) A strategic study of the impact of invasive alien plants in the high rainfall catchments and riparian zones of South Africa on total surface water yield. Water SA. 33 (1) 35-42. https://doi.org/10.4314/wsa.v33i1.47869 [ Links ]
CULLIS J, ALTON T, ARNDT C, CARTWRIGHT A, CHANG A, GABRIEL S, GEBRETSADIK Y, HARTLEY F, DE JAGER G, MAKRELOV K, ROBERTSON G, SCHLOSSER A, STRZEPEK K and THURLOW J (2015) An uncertainty approach to modelling climate change risk in South Africa. United Nations University World Institute for Development Economics Research. WIDER Working Paper 2015/045. UN-WIDER, Helsinki, Finland. https://doi.org/10.35188/UNU-WIDER/2015/934-3 [ Links ]
CULLIS JDS, HORN A, ROSSOUW N, FISHER-JEFFES L, KUNNEKE MM and HOFFMAN W (2019) Urbanisation, climate change and its impact on water quality and economic risks in a water scarce and rapidly urbanising catchment: case study of the Berg River catchment. H2Open J. 2 (1) 146-167. https://doi.org/10.2166/h2oj.2019.027. [ Links ]
DAY L (2007) Chapter 4: Water Chemistry. In: Ractliffe SG and Ewart-Smith J (eds): Berg River Baseline Monitoring Programme Final Report - Volume 1: Introduction to the Berg River Catchment; Groundwater and Riverine Environment. Anchor Environmental Consultants and Freshwater Consulting Group for the Department of Water Affairs, Pretoria. [ Links ]
DEADP (Department of Environmental Affairs and Development Planning, Western Cape) (2020) Environmental flows and the health and value of the Berg Estuary: Potential trade-offs between estuary value and regional water supply under a changing climate. DEA&DP, Cape Town. [ Links ]
DWA (Department of Water Affairs, South Africa) (2012a) Resource Directed Measures for protection of water resources: Methods for the determination of the ecological reserve for estuaries. Version 3. DWA, Pretoria. 133 pp. [ Links ]
DWA (Department of Water Affairs, South Africa) (2012b) Report No.1: Ecological Water Requirement Assessments. Volume 3 - Berg Estuary Environmental Water Requirements. Prepared by Western Cape Water Consultants Joint Venture, as part of the Pre-feasibility and Feasibility Studies for Augmentation of the Western Cape Water Supply System by Means of Further Surface Water Developments. Report PWMA19G10/00/2413/3. DWA, Pretoria. [ Links ]
DWA (Department of Water Affairs, South Africa) (2012c) Report No.1: Ecological Water Requirement Assessments. Volume 1 - Riverine Water Requirements. Prepared by Western Cape Water Consultants Joint Venture, as part of the Pre-feasibility and Feasibility Studies for Augmentation of the Western Cape Water Supply System by Means of Further Surface Water Developments. Report PWMA19G10/00/2413/1. DWA, South Africa. [ Links ]
DWAF (Department of Water Affairs and Forestry, South Africa) (2004) State of Rivers Report Berg River System - 2004 Summary. DWAF, Pretoria. [ Links ]
DWS (Department of Water and Sanitation, South Africa) (2018) Determination of Water Resources Classes and Resource Quality Objectives in the Berg Catchment: Evaluation of Scenarios Report. Report No: RDM/WMA9/00/CON/CLA/0417. Prepared by Aurecon South Africa (Pty) Ltd in sub-consultancy association with Southern Waters Ecological Research and Consulting, Anchor Environmental and Delta-H Water Systems Modelling. [ Links ]
DWS (Department of Water and Sanitation, South Africa) (2020) National Water Act. Act No. 36 of 1998. Determination of classes of water resource and associated resource quality objectives for the Berg Catchment. Government Gazette, 06 November 2020, No. 43872. 67-245. [ Links ]
DE VILLIERS S (2007) The deteriorating nutrient status of the Berg River, South Africa. Water SA. 33 (5) 659-664. https://doi.org/10.4314/wsa.v33i5.184087 [ Links ]
DE VILLIERS S and THIART C (2007) The nutrient status of South African rivers: concentrations, trends and fluxes from the 1970s to 2005. S. Afr. J. Sci. 103 343-351. [ Links ]
DOLLAR ESJ, NICOLSON CR, BROWN CA, TURPIE JK, JOUBERT AR, TURTON AR, GROBLER DF, PIENAAR HH, EWART-SMITH J and MANYAKA SM (2010) Development of the South African Water Resource Classification System (WRCS): a tool towards the sustainable, equitable and efficient use of water resources in a developing country. Water Polic. 12 479-499. https://doi.org/10.2166/wp.2009.213 [ Links ]
EAGLE GA and BARTLETT PD (1984) Preliminary chemical studies in four Cape estuaries. Report T/SEA 8307. CSIR, Stellenbosch. [ Links ]
ENGELBRECHT F, LANDMAN W, ENGELBRECHT C, LANDMAN S, BOPAPE M, ROUX G, MCGREGOR J and THATCHER M (2011) Multi-scale climate modelling over Southern Africa using a variable-resolution global model. Water SA. 37 647-658. https://doi.org/10.4314/wsa.v37i5.2 [ Links ]
EYRE B (2000) Regional evaluation, nutrient transformation and phytoplankton growth in nine river-dominated sub-tropical east Australian estuaries. Mar. Ecol. Progr. Ser. 205 61-83. https://doi.org/10.3354/meps205061 [ Links ]
FAIRBANKS DHK, THOMPSON MW, VINK DE, NEWBY TS, BERG VAN DEN HM and EVERARD DA (2000) The South African Land-Cover Characteristics Database: a synopsis of the landscape. S. Afr. J. Sci. 96 69-82. [ Links ]
FERGUSON AJP, EYRE BD and GAY J (2004) Nutrient cycling in the subtropical Brunswick estuary, Australia. Estuaries. 27 1-17. https://doi.org/10.1007/BF02803556 [ Links ]
FISHER TR, HARDING LW, STANLEY DW and WARD LG (1988) Phytoplankton, nutrients and turbidity in the Chesapeake, Delaware and Hudson estuaries. Estuar. Coast. Shelf Sci. 27 61-93. https://doi.org/10.1016/0272-7714(88)90032-7 [ Links ]
FOURIE JM and GORGENS AHM (1977) Mineralization studies of the Berg River (1974-1976). Report 334. CSIR, Pretoria. [ Links ]
HARRISON AD and ELSWORTH JF (1958) Hydrobiological studies on the Great Berg River Part 1 General description, chemical studies and main features of the flora and fauna. Trans. R. Soc. S. Afr. 35 (3) 125-226. https://doi.org/10.1080/00359195809520025 [ Links ]
HEWITSON BC and CRANE RG (2006) Consensus between GCM climate change projections with empirical downscaling: Precipitation downscaling over South Africa. Int. J. Climatol. 26 1315-1337. https://doi.org/10.1002/joc.1314 [ Links ]
JACKSON VA, PAULSE AN, STORMBROEK T, VAN ODENDAAL JP and KHAN W (2007) Investigation into metal contamination of the Berg River, Western Cape, South Africa. Water SA. 33 175-182. https://doi.org/10.4314/wsa.v33i2.49057 [ Links ]
KAISER G and MACLEOD N (2018) Cape Town - where we've been and where we want to go. Civ. Eng. 9 8-12. [ Links ]
LE MAITRE DC, FORSYTH GG, DZIKITI S and GUSH MB (2016) Estimates of the impacts of invasive alien plants on water flows in South Africa. Water SA. 42 659-672. https://doi.org/10.4314/wsa.v42i4.17 [ Links ]
MEYNECKE J-O, YIP LEE S, DUKE NC and WARNKEN J (2006) Effect of rainfall as a component of climate change on estuarine fish production in Queensland, Australia. Estuar. Coast. Shelf Sci. 69 491-504. https://doi.org/10.1016/j.ecss.2006.05.011 [ Links ]
MAGOBA RF (2018) Changes in the Berg River Basin over time. PhD thesis, Stellenbosch University. 216 pp. [ Links ]
MIDGLEY DC, PITMAN WV and MIDDLETON BJ (1994) Surface Water Resources of South Africa 1990. WRC Report Nos 298/1/94 to 298/62/94. Water Research Commission, Pretoria. [ Links ]
MIDGLEY SJE, DAVIES RAG and CHESTERNAN S (2011) Climate Risk and Vulnerability Mapping in Southern Africa: Status quo (2008) and future (2050) For the Regional Climate Change Programme for Southern Africa (RCCP) London and Cape Town: UK Department for International Development (DFID) and One World Sustainable Investments. [ Links ]
MITCHELL DT (1983) Section 3, nutrient cycling. In: Kruger FJ, Mitchell DT and Jarvis JUM (eds) Mediterranean Type Ecosystems. The Role of Nutrients. Ecological Studies 43. Springer, Berlin. 177-178. [ Links ]
MITCHELL DT, COLEY PGF, WEBB S and ALLSOPP N (1986) Litterfall and Decomposition Processes in the Coastal Fynbos Vegetation, South-Western Cape, South Africa. J. Ecol. 74 (4) 977-993. https://doi.org/10.2307/2260228 [ Links ]
MITCHELL DT and COLEY PGF (1987) Litter production and decompositions from shrubs of Protea repens growing in sand plain low land and mountain fynbos, south-western Cape. S. Afr. J. Bot. 53 25-31. https://doi.org/10.1016/S0254-6299(16)31468-5 [ Links ]
MONTEIRO PMS, ANDERSON RJ and WOODBOURNE S (1997) δ 15N as a tool to demonstrate the contribution of fish-waste-derived nitrogen to an Ulva bloom in Saldanha Bay, South Africa. S. Afr. J. Mar. Sci. 18 (1) 1-9. https://doi.org/10.2989/025776197784161199 [ Links ]
MUCINA L and RUTHERFORD MC (eds) (2006) The Vegetation of South Africa, Lesotho and Swaziland. South African National Biodiversity Institute, Pretoria. 789 pp. [ Links ]
MURRELL MC, HAGY JD, LORES EM and GREENE RM (2007) Phytoplankton production and nutrient distributions in a subtropical estuary: Importance of freshwater flow. Estuar. Coasts. 30 390-402. https://doi.org/10.1007/BF02819386 [ Links ]
ODOULAMI RC, WOLSKI P and NEW M (2020) A SOM-based analysis of the drivers of the 2015-2017 Western Cape drought in South Africa. Int. J. Climatol. 41 1-13. https://doi.org/10.1002/joc.6785 [ Links ]
OTTO FEL, WOLSKI P, LEHNER F, TEBALD C, JAN VAN OLDENBORGH G, HOGESTEEGER S, SINGH R, HOLDEN P, FUCKAR NS, ODOULAMI RC and NEW M (2018) Anthropogenic influence on the drivers of the Western Cape drought 2015-2017. Environ. Res. Lett. 13 (12) 1-10. https://doi.org/10.1088/1748-9326/aae9f9 [ Links ]
PAULSE AN, JACKSON VA and KHAN W (2007) Comparison of enumeration techniques for the investigation of bacterial pollution in the Berg River, Western Cape, South Africa. Water SA. 33 (2) 165-174. https://doi.org/10.4314/wsa.v33i2.49055 [ Links ]
RIDDLE MJ and SHIKAZE K (1973) Characterization and treatment of fish processing plant effluents in Canada In: Proceedings Fourth National Symposium on Food Processing Wastes, 26-28 March 1973, Syracuse, New York. 400-443. EPA -660 / 2-73-031. [ Links ]
SCHULZE RE (2011) A 2011 perspective on climate change and the South African water sector. WRC Report No. TT 518/12. Water Research Commission, Pretoria. [ Links ]
SLINGER JH and TALJAARD S (1994) Preliminary investigation of seasonality in the Great Berg Estuary. Water SA. 20 279-288. [ Links ]
SLINGER JH and TALJAARD S (1996) Water quality modelling of estuaries Field data collection for calibrating the Mike 11 water quality module on the Great Berg Estuary. Report EMAS-D 96002. CSIR, Stellenbosch. [ Links ]
SLINGER JH, TALJAARD S and VISSER E (1996) Water quality modelling of estuaries Field data collection for calibrating the Mike 11 water quality module on the Great Berg Estuary. Report EMAS-D 96004. CSIR, Stellenbosch. [ Links ]
SOUSA PM, BLAMEY RC, REASON CJC, RAMOS AM and TRIGO RM (2018) The 'Day Zero' Cape Town drought and the poleward migration of moisture corridors. Environ. Res. Lett. 13 (12) 124025. https://doi.org/10.1088/1748-9326/aaebc7 [ Links ]
SUN T, YANG ZF and CUI BS (2008) Critical environmental flows to support integrated ecological objectives for the Yellow River Estuary, China. Water Resour. Manage. 22 973-989. https://doi.org/10.1007/s11269-007-9205-9 [ Links ]
STRUYF E, BAL KD, BACKX H, VREBOS D, CASTELEYN A, DE DECKERE E, SCHOELYNCK J, BRENDONCK L, RAITT LM and MEIRE P (2012) Nitrogen, phosphorus and silicon in riparian ecosystems along the Berg River (South Africa): the effect of increasing human land use. Water SA. 38 (4) 597-606. https://doi.org/10.4314/wsa.v38i4.15 [ Links ]
TALJAARD S, SLINGER JH, SKIBBE E, FRICKE AH, KLOPPERS WS and HUIZINGA P (1992) Assessment of hydrodynamic and water quality aspects of the Berg Estuary - 1989/990. Report EMAS-D 92006. CSIR, Stellenbosch. [ Links ]
TURPIE JK, ADAMS JB, JOUBERT A, HARRISON TD, COLLOTY BM, MAREE RC, WHITFIELD AK, WOOLDRIDGE TH, LAMBERTH SJ, TALJAARD S and VAN NIEKERK L (2002) Assessment of the conservation priority status of South African estuaries for use in management and water allocation. Water SA. 28 191-206. https://doi.org/10.4314/wsa.v28i2.4885 [ Links ]
TURPIE J, CLARK BM, CULLIS J, DAWSON J, WRIGHT A, LETLEY G, DOBINSON L, GORGENS A and HUTCHINGS K (2020) Environmental flows and the health and value of The Berg Estuary: Potential trade-offs between estuary value and regional water supply under a changing climate. Report DEA&DP 5/2018. Department of Environmental Affairs and Development Planning, Cape Town. [ Links ]
TURPIE JK, TALJAARD S, VAN NIEKERK L, ADAMS J, WOOLDRIDGE T, CYRUS D, CLARK B and FORBES N (2012) The Estuary Health Index: a standardised metric for use in estuary management and the determination of ecological water requirements. WRC Report No. 1930/1/12. Water Research Commission, Pretoria. [ Links ]
VAN NIEKERK L, ADAMS JB, LAMBERTH SJ, MACKAY CF, TALJAARD S, TURPIE JK, WEERTS SP and RAIMONDO DC (eds) (2019) South African National Biodiversity Assessment 2018: Technical Report Volume 3: Estuarine Realm. CSIR Report Number CSIR/SPLA/EM/EXP/2019/0062/A. South African National Biodiversity Institute Report SANBI/NAT/NBA2018/2019/Vol3/A. CSIR/SANBI, Pretoria. http://hdlhandlenet/2050012143/6373 [ Links ]
WITKOWSKI ETF (1989) Effects of nutrient additions on litter production and nutrient return in a nutrient-poor Cape fynbos ecosystem. Plant Soil 117 227-235. https://doi.org/10.1007/BF02220716 [ Links ]
WITKOWSKI ETF (1991) Effects of invasive alien acacias on nutrient cycling in the coastal lowlands of the Cape fynbos. J. Appl. Ecol. 28 1-15. https://doi.org/10.2307/2404109 [ Links ]
WOLSKI P (2018) How severe is Cape Town's "Day Zero" drought? Significance. 2 24-27. https://doi.org/10.1111/j.1740-9713.2018.01127.x [ Links ]
 Correspondence:
Barry M Clark
Email: barry@anchorenvironmental.co.za
Received: 20 July 2021
Accepted: 30 March 2022

