


Servicios Personalizados
Articulo
 Inglés (pdf)
 Articulo en XML
 Referencias del artículo
Indicadores

Links relacionados
-
 Citado por Google
 -
 Similares en Google
Compartir

 Permalink
Water SA
versión On-line ISSN 1816-7950
versión impresa ISSN 0378-4738
Water SA vol.48 no.1 Pretoria ene. 2022
http://dx.doi.org/10.17159/wsa/2022.v48.i1.3883
RESEARCH PAPER
Deriving the maximum extent and hydroperiod of open water from Sentinel-2 imagery for global sustainability and biodiversity reporting for wetlands
Heidi van DeventerI, II; A LinströmIII; JF DurandIV; L NaidooV; MA ChoI, VI, VII
ICouncil for Scientific and Industrial Research (CSIR), PO Box 395, Pretoria 0001, South Africa
IIDepartment of Geography, Geoinformatics & Meteorology Geography, University of Pretoria, Pretoria 0083, South Africa
IIIWet Earth Eco Specs (Pty) Ltd, 58 Kerk Str, Lydenburg 1120, South Africa
IVDepartment of Zoology, University of Johannesburg, PO Box 524, Johannesburg 2006, South Africa
VGauteng City-Region Observatory (GCRO), a Partnership of the University of Johannesburg, the University of the Witwatersrand, the Gauteng Provincial Government and Organised Local Government in Gauteng (SALGA), Private Bag 3, Wits 2050, South Africa
VISchool of Agriculture, Earth and Environmental Sciences, University of KwaZulu-Natal, Private Bag X01, Scottsville 3209, South Africa
VIIPlant and Soil Sciences, University of Pretoria, Private Bag X20, Hatfield 0028, South Africa
ABSTRACT
The monitoring of wetland extent is a global imperative, considering loss of ecosystem services and conservation value. To date, the understanding of the variation in the extent of lacustrine (inundated) wetlands has been limited, based on intermittently available, coarse-scale imagery. The aim of this study was to assess the capabilities of the freely available Sentinel-2 sensor in monitoring inundated wetlands. In particular, to demonstrate the ability to determine the maximum extent of inundation for reporting on the Sustainable Development Goal (SDG) 6.6 (Clean Water and Sanitation) and SDG 15.1 (i.e., halting biodiversity loss), the functional diversity and the hydrological regime of depressions were explored in the Mpumalanga Lake District (MLD) of South Africa. Using the monthly inundation data derived from Sentinel-2 images between January 2016 and May 2018, the results showed that the maximum extent of open water can be successfully reported for SDG 6.6. Lacustrine wetlands constituted about 47 of the 416 (but 66% of the total areal extent of) depressions in the MLD, while others were predominantly palustrine (vegetated). The functional diversity varied from predominantly (61% of the extent of) inundated depressions to seasonally (3%) inundated depressions. The Sentinel-2 sensor was able to detect intra- and inter-annual variation of the extent of inundation, making it suitable to monitor these wetlands for global and climate change impacts.
Keywords: Aichi Target 11 hydrological regime lacustrine wetlands Mpumalanga Lake District (MLD) open water monitoring Sustainable Development Goal (SDG) 6.6 & 15.1
INTRODUCTION
The most recent global assessment of ecosystems reported by the Intergovernmental Science-Policy Platform on Biodiversity and Ecosystem Services (IPBES, 2019) indicates that >85% of wetlands that were present in the 1700s have been transformed, mirroring a declining trend in the quantity of freshwater ecosystems in the past 50 years (IPBES, 2019). Global and climate change pressures on inland aquatic ecosystems have resulted in a reduction or shift in their water availability and changes to their hydrological regime (Ross et al., 2018; Van Deventer et al., 2019). The hydrological regime is defined as the '...temporal sequence (frequency, duration and timing) of wetting and drying (hydroperiod; water regime) and flow events (flow regime) experienced by a freshwater ecosystem' (Rolls et al., 2018 p 973). The extent of inundation and the hydrological regime of inland aquatic ecosystems (rivers and wetlands) vary naturally as a result of precipitation, run-off, interflow and groundwater contributions (Cherry, 2011). Natural variability of the hydrological regime results in dynamic processes and diverse habitats and associated aquatic biodiversity at various scales (Rolls et al., 2018). Transformation within wetlands and their catchments has resulted in a negative influence on the hydrological regime of wetlands which, in return, negatively influences the functional processes, ecosystem services and species diversity of wetland ecosystems (Ross et al., 2018).
Importance of global reporting variation and changes in the hydrological regime
A number of international and national agreements require the monitoring and reporting of the extent of inundated parts of wetlands. One of the 17 Sustainable Development Goals (SDGs) identified in 2015 by the United Nations Development Programme to achieve targets set in the 2030 Agenda Resolution relates to the areal extent of wetlands; SDG 6.6 requires reporting of the extent of open water bodies for the protection and restoration of water-related ecosystems. For the first reporting of the SDG targets in 2020, SDG Target 6.6 stated 'By 2020, protect and restore water-related ecosystems, including mountains, forests, wetlands, rivers, aquifers and lakes, and a single indicator (6.6.1) is used to measure 'Change in the extent of water-related ecosystems over time' (UN, 2017). This SDG also aligns with Strategic Goal B of the Aichi targets of the Convention of Biological Diversity (CBD), which aims to 'Reduce the direct pressures on biodiversity and promote sustainable use' (Secretariat of the Convention on Biological Diversity, 2020). In the first SDG report of 2020, changes in the extent of lacustrine (open water) wetlands showed a decline globally, measured for every 5 years from the reference year of 2000. However, these changes do not take the natural variation in the hydrological regime into account, and may have measured changes from a maximum extent of inundation period, to a minimum period of inundation.
The hydroperiod or duration of inundation of wetlands influences the functional diversity of wetlands which influences diversity of organisms at local and landscape scales (Rolls et al., 2018). The hydroperiod correlates to available habitats for, and dispersal and migration patterns of, migratory waterbirds, invertebrates and amphibians (Evenson et al., 2018; Meyer-Milne and Mlambo, 2019; Meyer-Milne et al., 2020). Consequently, several global wetland classification systems distinguish two hydroperiod classes, namely, permanently and seasonally/intermittently inundated rivers and wetlands, to characterise their functional diversity and biodiversity (Keith et al., 2020; Ramsar, 1999). The conservation of ecosystem types is reported as part of Aichi Target 11, which aims to secure at least 17% of inland waters by 2020 (Secretariat of the Convention on Biological Diversity, 2020), and also reports to SDG 15.1 that states 'Conserve and restore terrestrial and freshwater ecosystems' (UN, 2020). To date, SDSG 15.1 only reports hotspot areas for freshwater ecosystems (UN, 2020), while the extent, distribution and changes in the functional diversity of wetlands based on their dominant hydroperiod class are not reported yet. Therefore, the ability to monitor inter- and intra-annual variation in the extent of inundation of wetlands, will improve our understanding of the natural inundation cycles of these wetlands, and provide a baseline for detecting any deviations as a result of global and climate change. These reporting processes ideally require monthly monitoring of the extent of the inundated parts of wetlands.
Methods to map and monitor the hydrological regime and hydroperiod
Historically, many countries used manual mapping to map the areal extent of wetlands and type their hydroperiod categories. More recently, advances in remote sensing have enabled improvement of the accuracy and frequency of mapping and reporting. The use of manual and remote-sensing mapping methods in South Africa is used to illustrate these developments in mapping wetland extent and hydroperiod classes. Globally, the use of remote-sensing methods for mapping wetlands has facilitated monitoring of changes in the extent of wetlands.
The former South African Department of Rural Development and Land Reform's Directorate of National Geo-Information (DRDLR:NGI) were responsible for the topographical mapping of rivers and wetlands in the country until May 2019, while the Department of Water and Sanitation (DWS) was responsible for the monitoring of water availability and quality. DWS has been monitoring river flow in situ as far back as 1904, using weirs and flow gauges, while the water levels of many estuaries and artificial waterbodies have been measured with gauge plates (Lewis, 1935). Historically, rivers and wetlands were mapped as part of the topographical data issued since the 1940s (DLA, 2000). Three categories were used by DRDLR:NGI to classify the hydroperiod of rivers and wetlands: perennial, non-perennial or dry, based on visual classification of available single- and multi-season imagery (definitions from DRDLR:NGI, 2019). The levels of resolution of such datasets were inadequate for SDG reporting on the extent of inundation of wetlands and their hydroperiod, biodiversity characterisation and description of the hydroperiod. South African aquatic ecosystem specialists have since used these three classes to infer the inundation period of open waterbodies: permanent, seasonally and intermittently inundated. These classes form part of the framework for typing the functional diversity and biodiversity of rivers and wetlands, i.e. the 'Classification system for wetlands and other aquatic ecosystems in South Africa' (Ollis et al., 2013, 2015). A refinement of the original DRDLR:NGI classes to these three classes would enable improved biodiversity typing of the inland aquatic ecosystems while setting a benchmark for measuring impact.
The current mapping of the inundated extent and typing of the classification of wetlands by the DRDLR:NGI in South Africa was done using visual classification from available aerial and satellite imagery at multiple dates between the 1940s and the early 2000s (Van Deventer et al., 2018a, b). Accurate classification of hydro-period classes was limited, since the imagery was often captured during the time of year with the least amount of cloud cover, which is during the dry period. This implies that only the minimum inundation extent of permanently inundated wetlands was mapped, and not the maximum extent of permanently, seasonally and intermittently inundated wetlands. Imagery was costly during this time, which restricted the amount of imagery from which hydroperiod classes could be inferred. Since 1 October 2008, the United States Geological Survey Earth Resources Observation and Science Centre has offered free access to archived Landsat and more recent Landsat 8 images (Wulder et al., 2016). Subsequently, the first time-series of wetland inundation has been published as a global surface water viewer using Landsat images (spatial resolution = 30 m), providing time-series data of inundation for the years 19842015 for individual pixels (Pekel et al., 2016). Most Landsat sensors, including the current Landsat 8's Operational Land Imager, have a low temporal resolution (revisit time periods) of 16 days (NASA, 2019). It is therefore rare to have contiguous cloud-free images over the tropics, which have a high frequency of clouds during the rainy season. Detailed classification of the hydroperiod as per the classification system for wetlands and other aquatic ecosystems in South Africa has not been done yet because monthly inundation information at the scale of individual wetlands was not available.
The European Space Agency launched the Sentinel-2A optical and space-borne sensor on 23 June 2015. Sentinel-2A has a spatial resolution of 10-20 m, thus providing greater capability for monitoring wetland inundation at a finer scale. The launch of the twin-satellite, Sentinel-2B, followed on 7 March 2017, which enabled an increased temporal resolution of 5 days at the equator (Li and Roy, 2017; ESA, 2019). Despite the availability of at least two images per month, cloud cover may obscure the area and limit monthly reporting. With the Sentinel-2 sensors in operation, the monthly extent of open waterbodies in South Africa were extracted by Thompson et al. (2018), using several thermal and vegetation indices as part of a decision-tree algorithm in the Google Earth Engine cloud-computing environment. These spatially explicit datasets of inundation, at a monthly interval and at a finer spatial resolution of 20 m, offer a new opportunity to determine methods to calculate the extent and hydroperiod of natural inland wetlands in South Africa.
The aim of this paper is to illustrate how monthly inundated extent and hydroperiod of wetlands can be derived from Sentinel-2 time-series images for SDG and biodiversity reporting. Depressions in the Mpumalanga Lake District (MLD) have been used as a case study for establishing monthly extents of inundated areas and hence the extent and hydroperiod of the wetlands. The objectives of this paper were to (i) ascertain the variation in, and maximum extent of, different types of depressions in the MLD based on the data derived from Sentinel-2 images in the Mzansi-Amanzi dataset and those mapped in NWM5; (ii) categorise the functional diversity of the predominantly inundated depressions based on hydroperiod information; (iii) assess the capability of the derived Sentinel-2 data for monitoring inundation over time at the catchment scale; and (iv) compare the results of the remote-sensing classification for four selected depressions of the MLD. The results from the proposed method could support calculation of the SDG 6.6 indicator (Van Deventer, 2021) and contribute to the typing of functional diversity and biodiversity types of wetland ecosystems globally for SDG 15.1 reporting, and the South African Inventory of Inland Aquatic Ecosystems (SAIIAE) (Van Deventer et al., 2018a, b), while informing Archi Target 11 at hydroperiod class level.
METHODS
Study area
One of the South African quaternary catchments as mapped by Weepener et al. (2012), coded W55A (located approximately 26°15'0"S, 30°15'0"E) and situated in the Mpumalanga Province of South Africa, has been selected as a case study area (Fig. 1). This catchment is known as the Mpumalanga Lakes District (MLD), with a total surface extent of 68 653 ha, and located on the south-eastern border of the larger African Panveld, which is predominantly arid to semi-arid, with mean annual evapotranspiration > 1 000 mm and mean annual precipitation (MAP) < 500 mm (Goudie and Thomas, 1985). The MLD is however geomorphologically unique, being the only part of the African Panveld where the post-African I surface (Partridge and Maud, 1987) was possibly preserved, because of less tilting and erosion compared to other parts of South Africa (McCarthy et al., 2008). In comparison to the rest of the Panveld, the MLD receives a higher amount (600-800 mm) of MAP and has a mean annual potential evapotranspiration of 1 400-1 500 mm (Bailey and Pitman, 2016).
Russell (2008) estimated that the MLD hosted approximately 300 depressions, locally known as 'pans' (Russell, 2008). The depressions formed as a result of the uplift of the continent and subsequent erosion of the Cretaceous African Surface, disconnecting the headwater drainage of the uSuthu River, located ±73 km downstream in a south-easterly direction from the eastern edge of the study area (Wellington, 1943; Partridge and Maud, 1987; Russell, 2008). The uplift and erosion led to the depressions being either perched or connected to the groundwater aquifer, resulting in different cover types and inundation or soil saturation regimes.
Hutchinson et al. (1932) document inter-annual variations in the inundation of the depressions, dating back to observations made in 1903. Some of the depressions are, however, covered predominantly with grass, sedge and reeds (Hutchinson et al., 1932; Russell, 2008). The focus of this study was on the depressions that are predominantly inundated, while other HGM types, such as the seeps and valley-bottom wetlands, are typically vegetated (personal field observation). The predominantly inundated depressions showed changes in the extent and type of cover between the dry (July-August) and wet (December-February) seasons.
Owing to the unique diversity of wetlands in the MLD, 60 203 ha (88% of the MLD) has been declared part of the Chrissiesmeer Protected Environment (The Province of Mpumalanga, 2014; MTPA, 2015) and considered for Ramsar nomination (Tarboton, 2009). In addition, it is listed as one of South Africa's Important Bird and Biodiversity Areas (IBAs; Barnes et al., 2001; Marnewick et al., 2015), and forms one of 1 248 IBAs in Africa (Fishpool and Evans, 2001; Donald et al., 2019). The MLD was identified as a river freshwater ecosystem priority area, fish sanctuary and wetland cluster in the National Freshwater Ecosystem Priority Areas project (Nel et al., 2011), and more recently also mapped as a surface water important Strategic Water Source Area (SWSA) of South Africa (Le Maitre et al., 2018; Lötter and Le Maitre, 2021). Characterising and monitoring changes in the extent and ecosystem types (through the hydroperiod classes) of these wetlands would be vital to inform the management of this highly biodiverse site.
According to the most recent National Wetland Map, version 5 (NWM5) (Van Deventer et al., 2020b), 694 polygons classified to 5 hydrogeomorphic (HGM) wetland units have been mapped for the MLD. These include the above-mentioned depressions, seeps, floodplains and channelled/ unchannelled valley-bottom wetlands, either inundated or vegetated. Of the total HGM units mapped in NWM5, 416 wetland polygons were mapped as depressions with a total area of 7 611 ha, constituting about 60% of the total number of HGM units in the MLD (Fig. 1). While NWM5 describes the biodiversity characteristics of these wetlands to Level 4A or the HGM unit of the classification system for wetlands and other aquatic ecosystems in South Africa (Ollis et al., 2013; 2015), information on the hydroperiod categories at Level 5 is not listed.
Calculating the total extent of inundated and other types of depressions at a catchment scale
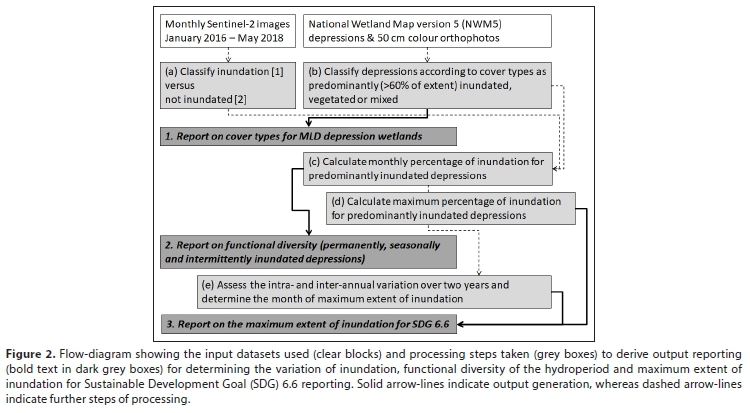
To enable reporting on the extent of the inundated parts of depressions in the MLD, predominantly inundated depressions were first distinguished from other depressions through a desktop visual inspection (Fig. 2). Historical experience from working in the MLD, and more recently fieldwork observations from 2017 and 2018 (Naidoo et al., 2019; Nondlazi et al., unpublished; Van Deventer et al., 2020a) provided a basis to inform the typing of the depressions based on areal extent, spectral and structural differences for the wetland vegetation relative to the inundated areas of the depressions. Depressions were classified as either being predominantly (>60% of the extent mapped in NWM5) inundated, vegetated, or containing a mixture of the two. Visual verification was done using 50 cm spatial resolution colour ortho-photographs served by the former DRDLR:NGI via the ArcGIS online Web Map Service for the period 2012-2013 and images from Google Earth Pro (Google LLC, 2020). The different sizes of the depression wetlands (obtained from NWM5) relative to their cover types (visual inspection of these electronic orthophotographs at a scale range of 1:2 000 - 1:5 000) were explored to understand the geographic variation in the areal extent of lacustrine (inundated) and palustrine (vegetated) wetlands, relative to the mapped extent of the wetland polygon, across the study area. Three categories were used: those that are predominantly (>60%) vegetated, or inundated, or a mixture of the two (Fig. 2). The assigned cover types were used as the baseline for describing the types of depressions, the extent of those which are predominantly inundated for SDG reporting, and typing of the hydroperiod categories related to their functional diversity.
To determine the temporal variation in the extent of the predominantly inundated depressions, their maximum extent of inundation for SDG 6.6 reporting, and hydroperiod categories (functional diversity) for the predominantly inundated depressions, the monthly extent of inundation was extracted and calculated as a percentage of the full extent of each depression wetland (Fig. 2). Depressions mapped in NWM5 included a mixture of cover types, even for the predominantly inundated depressions. The areal extent of inundation in the catchment was obtained from the Mzansi-Amanzi data, provided by GeoTerralmage (Pty) Ltd (GTI) as a free sample dataset at the time of the study (Thompson et al., 2018). This dataset was produced from a processing algorithm where Sentinel-2 images of South Africa were georeferenced, atmospherically corrected and cloud cover masked out as no data, before the decision-tree algorithm applied to map open water bodies for each month (Thompson et al., 2018). The resultant output image for each month had two categories, either inundated [1] or not inundated [0]. Images for each month between 1 January 2016 and 31 May 2018 were received as separate georeferenced tiff (geotiff) images (Thompson et al., 2018). For each of the predominantly inundated depression polygons, the total number of pixels inundated in a month was then summarised using ArcGIS 10.3's spatial analyst tool, Zonal Statistics as a Table (ESRI, 1999-2014). Thereafter, the total number of pixels for each month and depression was multiplied by the surface area of the pixels (20 x 20 m = 400 m2) converted to hectares by dividing the value by 10 000. The percentage of inundation for each month was calculated as a percentage of the total extent of the depression.
Determining functional diversity of depressions from hydroperiod classes using the monthly Mzansi-Amanzi data derived from Sentinel-2 images at a catchment scale
The predominantly inundated depressions were classified according to the hydroperiod categories of Ollis et al. (2013) to determine their functional diversity (Fig. 2): 'permanently inundated' if inundated >9 of the 12 months; 'seasonally inundated' if inundated for 3-9 months in a 12-month period; and 'intermittently inundated' if inundated for <3 months per 12-month period. The number of months of inundation was calculated in a spreadsheet over two 12-month periods, ranging from autumn to autumn for the first year (1 May 2016 to 30 April 2017) and the second year (1 May 2017 to 30 April 2018). The two 12-month period classifications were combined to classify each of the predominantly inundated depressions (n = 47) as either permanently, seasonally or intermittently inundated, or any combination of the three.
The output of the hydroperiod classification was then compared to the categories assigned by the former DRDLR:NGI, which for the MLD included only perennial and non-perennial pans. The comparison was done statistically using the number and extent of each class, and percentage of the total number and extent of all predominantly inundated depressions, to evaluate the similarities and differences to determine the geographic distribution and number of each functional type. In addition, visual overlay of the classes from DRDLR:NGI to the output of the analysis done in this study will inform the geographic distribution of the two products.
Determining maximum extent and comparing the variation in inundation of depressions at a catchment scale with the mean monthly rainfall statistics
The variation in the monthly percentage of inundation of the predominantly inundated depressions was assessed for a number of reasons. Firstly, the maximum extent of inundation across the hydrological regime of the MLD should be determined for reporting on SDG 6.6. This was done using the maximum extent recorded across the reporting period. Secondly, using the maximum extent, polygons of the NWM5 could be refined to separate the seep part of a polygon from the true extent of the depression that could likely be explained by the extent of inundation. Thirdly, the capabilities of Sentinel-2, with a spatial resolution of 20 m, should be evaluated for reporting monthly variation in inundation, to assess whether it can serve as a monitoring system for detecting deviations caused by global climate change. The data should therefore have a fine enough spatial resolution to detect the variation of inundation, while the temporal resolution should be adequate for detecting changes in extent over time. It should also be able to show variation of inundation in response to rainfall events. Therefore, the variations of the percentage inundation calculated for all the predominantly inundated depressions were mapped relative to the maximum rainfall measured per month at the Chrissiesmeer rainfall station of the South African Weather Service (SAWS).
Case study: Evaluation of the results for 4 depressions in the MLD
To specifically assess the variation of inundation at the individual depression level, the resultant variation in the maximum percentage of inundation over the reporting period was further investigated for 4 depressions: Chrissiesmeer, Eilandsmeer, Slangpan and Lake Banagher (Fig. 1). The purpose was to assess the capability of the Mzansi-Amanzi inundation data derived from Sentinel-2 to characterise individual depressions at a fine scale and evaluate the improvement in the classification of inundation. It was expected that the optical data may show omission errors where cloud cover obscures observations, which could result in no detection, incorrect observations of cover type or the hydroperiod.
RESULTS
Cover types of the MLD depressions
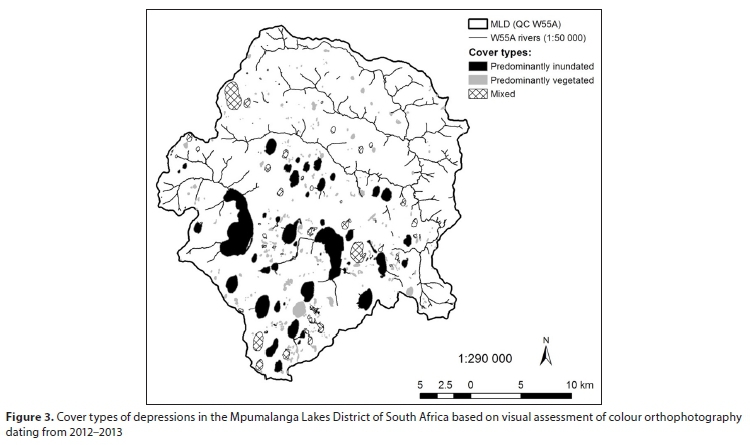
Of the 416 depressions (7 611 ha) found in the MLD, the visual categorisation of the NWM5 polygons based on the 2012-2013 images showed that 47 depressions were classified as predominantly inundated with water, constituting 11% of the total number and 66% of the total extent of depressions in the MLD, considering visual interpretation of the cover types using the 50 cm orthophotos (Table 1a; Fig. 3). In contrast, a larger number of depressions (306) were found to be predominantly vegetated, but only made up 15% of the total extent of depressions in the MLD. The remaining depressions contained both vegetated and inundated sections, and totalled only 19% of the extent of all depressions.
A visual inspection of the resultant inundation extent from the Mzansi-Amanzi data relative to the full extent of the depressions mapped in NWM5 against the DRDLR orthophotographs and images in Google Earth Pro (Google LLC, 2020), showed that the total extent of some polygons includes the seep HGM units with the depression HGM unit in one polygon. However, the wetlands that were predominantly inundated showed less of the seep area and vegetation compared to the other depressions and the image classification did detect a temporal variation in inundation in these wetlands. Approximately 41 depressions included reeds (likely Phragmites australis, see Hutchinson et al., 1932) of which 21 were classified as mixed, having a rim of water on the edge of the depression, while the remaining 20 were classified as being predominantly vegetated. In addition to the 21 mixed depressions that were dominated by reeds, another 42 depressions, that presumably have sedge and grass cover, were classified as mixed, although they had an inundated section in the deeper part, and are found in the more central region of the wetland. The majority of the vegetated depressions were dominated by grass and sedge cover, except for the 20 that included reeds and 3 with taller, more perennial vegetation.
Using the Mzansi-Amanzi data derived from the Sentinel-2 images, a maximum extent of inundation was calculated as 3 493 ha or 46% of the extent of depressions (Table 1b) and was less than the extent attributed to the NWM5 polygons using the 50 cm orthophotos. Therefore, the Mzansi-Amanzi inundation data derived from the Sentinel-2 images provide a refinement of the extent of inundation that should be reported to the SDG 6.6 compared to the information attributed to the NWM5 polygons from visual inspection of the orthophotos. This could be attributed partly to the seep zone being included in the NWM5 extent calculations for polygons of this class, as well as inundated areas <400 m2 (extent of a 20-m pixel size of the Mzansi-Amanzi data) not being detected, as a result of these being dominated by other spectral signatures such as mud or vegetation with a low reflectance. The discrepancy between the inundation extent and total extent of the depressions mapped was therefore 1 544 ha, which totals 31% of the predominantly inundated class of depressions.
The mixed depressions showed a maximum extent of inundation, derived from the Mzansi-Amanzi data, representing 6% of the extent of all depressions mapped in NWM5, while the latter mapped the extent as 20% of the total extent of all depressions (Table 1b). The Mzansi-Amanzi data also show that nearly 105 ha (or 10%) of the predominantly vegetated depressions reflects signs of inundation, which could be attributed to the low reflectance of mud or vegetation cover in these depressions.
The extent of inundation varied for the predominantly inundated class (Table 1b), with a minimum extent of 1 177 ha (23% of NWM5's depressions that are predominantly inundated) mapped for the dry season, ranging to nearly 70% of the extent of this class during the wet season. Again, a difference of about 30% could be attributed to the seep areas being included in the NWM5 polygons. Chrissiesmeer is the largest of all depressions (1 283 ha) and the Mzansi-Amanzi data showed that the extent of inundation for this polygon varied seasonally from 718 ha (56% of this lake) in the dry season to 965 ha (75%) of inundation in the wet season.
The predominantly inundated depressions were found largely in the central and southern sections of the MLD (Fig. 4), whereas the mixed cover depressions were interspersed between the predominantly inundated depressions. The smaller, predominantly vegetated depressions were found on the headlands between the river systems, as well as dispersed between the other two classes.
The depressions typed as predominantly inundated by visual inspection were approximately 3 to 1 220 ha in extent, with inundation ranges derived from the Mzansi-Amanzi data of 22-91% (Table 1; Fig. 4). Predominantly vegetated depressions were smaller than the predominantly inundated depressions, with extents < 150 ha and percentage inundation generally < 60%. The mixed depressions were < 320 ha with percentage inundation mostly < 50%. A comparison between the trendlines of the three cover types shows no strong correlation between the two variables of extent and percentage of inundation (Fig. 4). According to the trendline of the predominantly inundated cover type, the minimum is limited to ±25%, indicative of the limitation of the Sentinel-2 20 m spatial resolution in detecting smaller percentages of inundation.
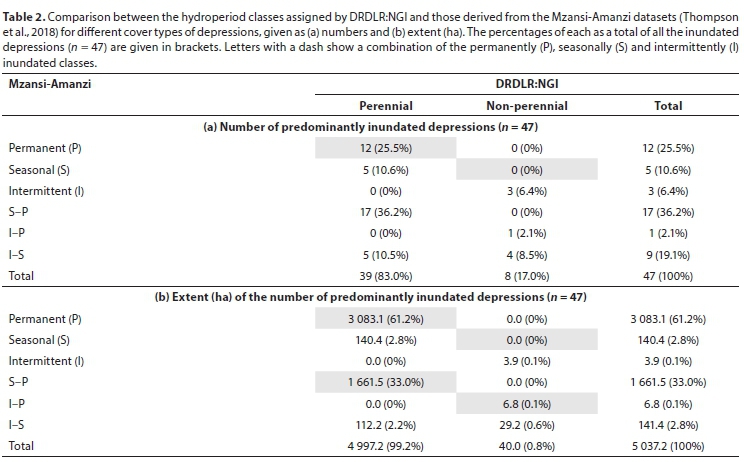
One quarter (25.5%) of the number of depressions with a 'permanently inundated' hydroperiod category (n = 47) corresponded with the DRDLR:NGI 'perennial' category (Table 2a), whereas 61% of the extent measured corresponds with these comparable categories (Table 2b). While the DRDLR:NGI categories showed that most (83% of the number and 99% of the extent) of the depressions were perennial (Table 2), the hydroperiod classification of Ollis et al. (2013, 2015) shows a wider range of inundation periods over the two years assessed. According to the hydroperiod classes, 61% of the extent of the depressions, or 25.5% in numbers, is permanently inundated, with very few being seasonally inundated (3% of extent and 11% in number) and only three depressions considered to be intermittently inundated. More than half of the depressions (57% of the number and 36% of the extent) had hydroperiod classes which varied between the two 12-month periods assessed.
The permanently inundated depressions were located predominantly in the centre of the catchment, south of the Majosie se Vlei River, with seasonally and intermittently inundated depressions interspersed between them (Fig. 5). Depressions that varied between seasonally inundated in the first 12-month period assessed, to permanently inundated in the second period, were visibly dispersed on the periphery of the permanently inundated depressions.
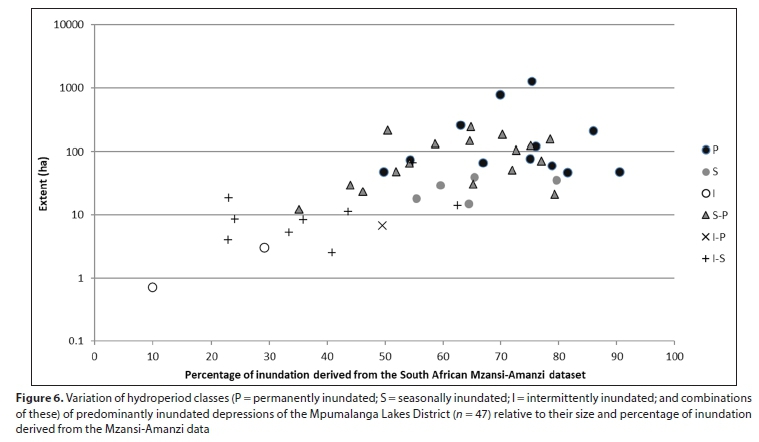
In the majority of cases, the permanently inundated and seasonal hydroperiod categories (or a combination of these), showed a larger areal extent compared to the other inundation categories of the depressions (Fig. 6).
Variation of inundation periods over time against mean monthly precipitation
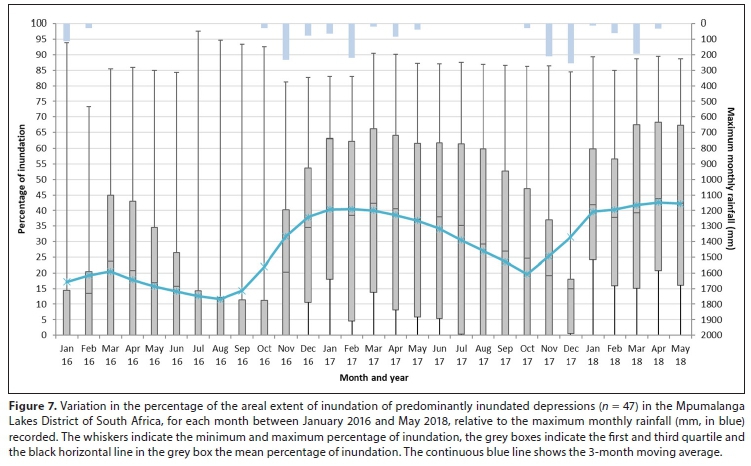
The percentage inundation extracted from the Mzansi-Amanzi data for the predominantly inundated depressions (n = 47) showed a clear seasonal variation of inundation between January 2016 and May 2018 (Fig. 7). The first year between January 2016 and October 2016 also showed a below-average inundation compared to 2017 and 2018, with no rainfall recorded between March and September of 2016. The number of images available in 2016 was limited to 10-day intervals, since only the Sentinel-2A sensor (launched October 2015) was available at that time.
The repeat-visit cycle halved with the launch of Sentinel-2B, the twin sensor, on 7 March 2017. Monthly rainfall increased in October 2016 and May 2017, with corresponding increases in the mean and maximum percentage of inundation recorded in the summer, despite the limitation ofhaving only Sentinel-2A in orbit. No rainfall was recorded between June and September 2017, with a corresponding decline in the mean percentage of inundation of the predominantly inundated depressions. In November and December 2017, 200-300 mm of rain fell, resulting in the largest increase of 27% in the average percentage of inundation in the period December 2017 to January 2018. These results show that the data derived from the Sentinel-2 sensor can detect monthly variation in the percentage of inundation and responds to rainfall events. The highest maximum percentage of inundation was recorded in March and April 2017, with a total of 90%.
In comparing three of the seasonal time periods (January-April 2016, May 2016-April 2017, and May 2017-April 2018), the maximum percentage of inundation varied by <4%. The mean percentage of inundation in the first period was, however, half of the mean in the last two periods, showing the effect of the end of 2015 and beginning of 2016 drought on the extent of inundation. The rainfall pattern of 2017 and 2018 shows seasonality ranging from October 2016 to May 2018 (Fig. 7). Similarly, the variation in the inundation of the predominantly inundated depressions follows the same seasonal pattern (see moving average across 3 months in Fig. 7). An increase in the percentage of inundation is visible in February 2016 following the mean average rainfall of January 2016 (29.5 mm), peaking in March 2016 and gradually declining again towards the October 2016 driest month (mean inundation at lowest 11.3%). Rainfall events commenced again in September and October 2016, with a corresponding increase in the mean percentage of inundation from October 2016 to 20.2% in November 2016, peaking in March 2017 (42.3%), and gradually declining towards the next minimum mean (15% inundated) and a gradual increase towards the next peak (mean maximum of 43.8%) in April 2018.
Results of the case study: variation of inundation for four depressions of the MLD
The maximum extent of inundation for the NWM5 polygons of the four predominantly inundated depressions of the MLD that were used as case studies showed differences in their maximum extent of inundation and continuity of data over the reporting period (Fig. 8). The two largest depressions, Chrissiesmeer and Eilandsmeer (Fig. 1), had ranges of inundation from 60% to 75% (of the extent of polygons mapped in NWM5, which included their seep zones). Both showed decreases in the percentage of inundation from January to February 2016 of 28% for Eilandsmeer and 13% for Chrissiesmeer, and from November to December 2017 decreasing by 16% for Eilandsmeer and 7% for Chrissiesmeer. An increase in the percentage of inundation was then observed from February to March 2016 (30%, 15%, respectively) and December 2017 to January 2018 (27%, 11%, respectively). These changes in the percentage of inundation differ from the average changes between months observed for Eilandsmeer of no more than 6% and for Chrissiesmeer of <1.2% over the 29-month analysis period.
Collectively, the 47 predominantly inundated depressions of the MLD showed no significant decreases (Welch two-sample t-test) either from January to February 2016, or from November to December 2017; however, the increase of the percentage of inundation from February to March 2016 was significantly higher (p < 0.05; at the 95% confidence interval), as was that from December 2017 to January 2018 (p < 0.01; at the 99% confidence interval). These two events show a clear decrease of the percentage of inundation extent for Eilandsmeer and Chrissiesmeer, followed by a sharp increase corresponding with a general decrease and increase in the mean percentage ofinundation of all predominantly inundated depressions (n = 47) from January to February 2016 (-1%) followed by an increase from February to March 2016 (10%), as well as from November to December 2017 (-4%), and then followed by an increase from December 2017 to January 2018 (27%) (Fig. 7). Closer inspection of the original images and the Mzansi-Amanzi classification suggested that cloud cover and classification errors may have contributed to the lower values of inundation reported.
The two smaller depressions, Lake Banagher and Slangpan, showed higher variability in the percentage of areal extent that was inundated, as recorded over the 29-month period (Fig. 8). Both pans showed several classification errors, particularly between May and November 2016, where the inundation appeared to be <5%. Visual inspection of the available Sentinel-2 L1C images in the Earth Observing System (EOS) LandViewer (https://eos.com/landviewer/) for these months showed predominantly cloud-free days (63% of the 78 scenes available have <25% cloud cover across the 7-month period), with a reduction in water levels in Blinkpan, directly west of Slangpan, that was well detected and classified during this period.
DISCUSSION
Our work shows that data derived from the Sentinel-2 images are key in the mapping and monitoring of inundated wetlands. In particular, the methods described in this study enable refined reporting of the changes in the extent of lacustrine wetlands for SDG 6.6.1a, and improved biodiversity typing of lacustrine wetlands for reporting on SDG 15.1 and Aichi Target 11. In addition, Sentinel-2 data refines the previous mapping and monitoring of lacustrine wetlands temporally and spatially. These findings have influences on fine-scale to country-wide and global scale reporting and management, described in more detail in subsequent sections.
Improved reporting of the mean maximum extent and hydroperiod important for global sustainable development and biodiversity reporting
Ideally, the periodicity of the natural variability in the mean maximum areal extent of lacustrine systems should be determined and used as a reference against which changes in the hydrological regime are reported for SDG 6.6.1a. The mean maximum areal extent oflacustrine systems is proposed as the most suitable metric for monitoring changes in inundation, to avoid the recording of changes against outlier events, such as irregular tropical storms or cyclones. Correspondence of the inundation periodicity of a catchment to rainfall patterns should be determined, to enable the identification of deviations from the natural cycle(s). Such reporting would be challenging, in that the interval may vary regionally, resulting in more detailed monitoring required globally or at a country-wide scale to report changes against such a reference. One policy consideration, at the CBD and SDG discussions for future headline indicator reporting, should be to report on the number of catchments which have retained their natural mean maximum extent in inundation, compared to catchments which show significant deviation from these within a decadal period.
The improved temporal monitoring of inundation extent enables the refinement of hydroperiod classes for the biodiversity typing of lacustrine wetland ecosystems globally and in South Africa, defining them as either permanently, seasonally or intermittently inundated (Keith et al., 2020; Ollis et al., 2013; 2015; Ramsar, 1999). These classes would facilitate refined assessments of the lacustrine wetland ecosystem types, while deviations from the natural hydrological regime (e.g., such as the interval between mean maxima) would inform on changes in the ecological condition of these wetlands. These refinements could influence the reporting of the ecosystem threat status of freshwater ecosystems for Aichi Target 11 of the CBD, using 30% of the extent of each hydroperiod class as target, and for SDG 15.1, reporting the extent, percentage and changes in the hydroperiod classes of wetlands. Further work would be required to initiate the reporting of the soil saturation phases and metrics associated with palustrine wetlands.
Sentinel-2 data improve the reporting of the areal extent and hydroperiod of lacustrine wetlands compared to Landsat data
Sentinel-2 data improves the representation of the maximum extent and hydroperiod of lacustrine wetlands compared to Landsat data
The freely available Sentinel-2 data enables monthly records of inundation of wetlands which can be used in monitoring these ecosystems under global and climate change. This study showed that the extent of inundation data derived from the Sentinel-2 sensor can improve the reporting of the maximum extent of open water or lacustrine wetlands for national and global reporting purposes. The Sentinel-2 sensor improved on the temporal frequency of the Landsat sensors, increasing the revisit time from 16 days to an average of 5 days at the equator (Li and Roy, 2017; ESA, 2019). This increases the chances of obtaining cloud-free imagery for deriving inundation extents of wetlands. Earlier methods of mapping inundation, such as those used by the former DRDLR:NGI for topographical feature mapping, limited the representation of inundation extent in sporadically available images that could not inform the hydrological regime of the wetlands, nor derive their maximum extent of inundation and functional diversity. The atmospherically corrected Sentinel-2 optical images are also available in Google Earth Engine environment and therefore easy to implement for monitoring, though may present more error in the classification of the areal extent of inundation, resulting from cloud cover.
Shortcomings of the Sentinel-2 data in mapping and monitoring inundation extent
The inundation data derived from Sentinel-2 for the year 2016 showed a larger number of omission errors in mapping the extent of inundation, particularly for smaller, predominantly inundated depressions, such as Slangpan and Lake Banagher. The percentage of inundation was recorded as zero for these two systems between May and November 2016, compared to continuous inundation of Chrissiesmeer and Eilandsmeer during the same period. These errors were attributed to the fact that only Sentinel-2A was in operation during 2016, providing an average revisit time of 10 days. After Sentinel-2B became operational on 7 March 2017, the revisit time increased in temporal frequency to 5 days, improving the chances of obtaining cloud-free data, thus reducing errors. Vegetation and algal growth are also prevalent in some of these depressions, such as in parts of Slangpan, while Lake Banagher could possibly be shallow and turbid, which may result in omission errors for these two depressions. Calculating the maximum extent of the inundated parts of the depressions from radar time-series data can reduce the omission errors prevalent in optical images (Chapman et al., 2016). Long-term, hydrological regime information for the wetlands, covering both wet (La Niña) and dry (El Niño) cycles, should be used to build up a record of the long-term maximum extent of inundation and to define the boundary between the depression and seep HGM units.
Many studies have also used Sentinel-1 radar data, or a fusion between the optical (Sentinel-2) and radar (Sentinel-1) images to overcome the omission errors associated with the optical data (e.g., Bioresita et al., 2019; Manakos et al., 2020; Muro et al., 2020). While the radar data overcomes the limitations of cloud cover, the associated speckle over inundated areas, particularly turbid waters, protruding vegetation and shallow depressions, may also contribute to an increase in error (Schumann and Moller, 2015). At the end of July 2021, GTI released the updated Mzansi-Amanzi version 2 free to the public, which derives the areal extent of inundated wetlands from the Sentinel-1 and Sentinel-2 sensors for the whole of S outh Africa, from January 2016 onwards (Thompson, 2021). This would provide South Africa with the opportunity to refine the reporting for lacustrine and palustrine wetlands, backdating improvements to the 2020 and future SDG 6.6.1a reporting. In addition, our ecosystem types could be refined for the next National Biodiversity Assessment, which ultimately influences the selection of Key Biodiversity Areas and the reporting for SDG 15.1.
Freely available Sentinel-2 data enables Tier 2 and refined level reporting of SDG 6.6.1a
In the SDG 6.6.1a reporting structure, countries are offered global statistics derived from the global surface water product (Pekel et al., 2016), which reports the areal extent of lacustrine wetlands as derived from the Landsat series and Sentinel-2 data since 1984 at Tier 1. With the freely available Sentinel-2 data and methods proposed in this paper, countries can derive their own statistics to report at Tier 2. Tier 2 reporting can facilitate improved representation of the areal extent of lacustrine wetlands, and the accuracy of changes between reporting years. For example, a comparison between the global surface data product used at Tier 1 and the areal extent of wetlands mapped in the latest South African NWM5, showed that 87% more wetlands can be reported at Tier 2 (Van Deventer, 2021; DWS, 2020).
Further refinement of the South African NWM5 polygons would however be necessary for future SDG 6.6.1a and Aichi target 11 reporting. Using the Mzansi-Amanzi data derived from the Sentinel-2 images, the maximum extent of inundation of lacustrine wetlands in the MLD was 3 493 ha, and more accurate to report compared to the coarser polygons of NWM5. In fact, this amount is 1 544 ha less, or 31% less compared to using the full extent of the NWM5 polygons (5 037 ha or 66% of the extent of NWM5 depressions in the MLD). Removing the seep extent of the NWM5 polygons, which occurs around the inundated part of the depression, is essential for reporting the maximum extent of inundated wetlands for the SDG 6.6 indicator.
Sentinel-2 data can contribute to the biodiversity typing of lacustrine wetlands
The Sentinel-2 images were able to provide biodiversity information for the wetlands that informed more on their origin, in comparison to the geology, cover types and hydrological regime of the predominantly inundated depressions of the MLD. The refinement of the MLD's depressions according to cover types and their hydroperiod can further the understanding of faunal biodiversity and potentially the impact of anthropogenic and climate change on these ecosystems. These aspects are discussed in more detail in the subsections that follow.
Geological origin of the geographic distribution and high prevalence of depressions relative to other wetlands in the MLD
The geographic distribution of the depressions and other wetlands of the MLD relative to the geological formations, showed that the majority of the depressions south of Majosie se Vlei coincide with the sandstones and shales ofthe Vryheid Formation (Pv) ofthe Ecca Group of the Karoo Supergroup. An extensive intrusion of dolerite occurs between the Majosie se Vlei and Mpulusi rivers, where valley-bottom wetlands dominate, and depressions are absent. There has been much speculation on the reason for the density of lakes and their nature in the MLD. The predominantly horizontal nature and porosity of the underlying Vryheid Formation and the proximity of dolerite dykes to these lakes have been mentioned as the primary causes of this phenomenon (Marshall and Harmse, 1992). This is a moot point seen in the light of the large areas of South Africa that are covered by Ecca Group rocks and feature dolerite dykes that do not have lacustrine wetlands of a similar density or nature. The fact that the MLD is found in one of the last remaining patches of the African Surface that was set down during the Cretaceous is often overlooked. Here, the African Surface was uplifted due to rifting and during the subsequent period of inundation and erosion ferricrete formed that capped the remaining African Surface sediments in this region (Partridge and Maud, 1987). This feature causes the lakes in the MLD to have differences in salinity - the lakes that are recharged mainly from the groundwater located within the Vryheid Formation are saline compared to those that are recharged from the perched aquifer underlain by ferricrete (Russell, 2008). The reason why the lakes that are permanently inundated are located in the south of the study area is probably because the lakes formed along the flow of an ancient river that cut through the African Surface and the underlying Vryheid Formation, flanked in the north by an erosion-resistant highland formed by the dolerite sill.
Diversity of, and variation in, cover types of the MLD depressions (n = 416)
A diversity of depressions is found in the MLD, with 47 of the 416 depressions typed as predominantly inundated. These constitute 11% of the number, but 66% of the extent of all depressions within the MLD using the extent of the NWM5 polygons. A larger number of depressions were typed as predominantly vegetated (306), but in extent made up only 15% of all depressions in NWM5, while the mixed depressions (64) comprised 19% of the extent of depressions mapped in NWM5. Vegetated depressions also varied in communities, ranging from grasses to sedges to reeds, as previously observed (Hutchinson et al., 1932; Russell, 2008). Further work is therefore essential for characterising the diversity of the depressions to Level 6 of the classification system for wetlands and other aquatic ecosystems in South Africa (Ollis et al., 2013, 2015), to obtain a more detailed inventory of the diversity of the depressions in this catchment.
The geology of the region determines the distribution and nature of the predominantly inundated depressions in the MLD. These depressions are more prevalent in the southern two-thirds of the study area, where drainage has been mostly disrupted, compared to the other parts of the MLD with depressions. These predominantly inundated depressions probably developed along an ancient river system that ran over the Cretaceous African Surface and cut its way through the underlying Vryheid Formation in the southern part of the study area, skirting the erosion-resistant dolerite sill to the north. These systems were found to be, on average, larger compared to the predominantly vegetated and mixed systems. Average percentage inundation values also suggest that these systems are likely to be ADE, since they varied less during the 2016 drought when compared with the highly seasonal varying vegetated systems. Understanding the functional diversity of these depressions not only contributes to understanding the diversity of wetland ecosystem types, but also to interpreting changes in the hydrological regime, whether through abstraction or climate change.
Deriving the hydrological regime from Sentinel-2 images for predominantly inundated depressions (n = 47) of the MLD
The monthly inundation data derived from the Sentinel-2 sensor enabled the classification of the functional diversity of the predominantly inundated depressions according to the hydroperiod classes of the 'Classification system for inland wetlands and other aquatic systems' (Ollis et al., 2013; 2015). More detailed time-series analysis allows the refinement and in some instances the correction of categories originally assigned by the DRDLR:NGI as perennial, non-perennial and dry pans. Further work is required to assess whether the periods chosen for permanently, seasonally and intermittently inundated classes of the classification system prevail across all catchments of South Africa.
The predominantly inundated depressions showed the hydro-logical regime to vary without any clear pattern visible during the period of reporting (January 2016-May 2018). A clearer seasonal signature is visible after December 2016, peaking in March 2017 in mean level of percentage inundation, and reaching the lowest percentage of inundation in December 2017. The mean percentage of inundation appears to respond to monthly rainfall recorded, with a lag effect of a month or two. The mean monthly precipitation during the 29-month study period showed a natural curve of seasonal precipitation, with higher rainfall in the summer months, compared to no rain in the winter months, and compares well with the 88-year average recorded between 1911 and 1999 (SAWB, 1911-1999). The study period followed the drought in South Africa, which showed below-average rainfall recorded for the last quarter of 2015 and beginning of 2016. A decline in the areal extent of wetlands between 2000 and 2015 was observed in the Witbank Dam Catchment of the Mpumalanga Province, using seasonal MODIS data (Nhamo et al., 2017). In contrast, the results of inundation of the MLD study area show the increase of areal wetland extent following the drought. Regardless of the improvement that Sentinel-2 offers for refined monitoring of the hydrological regime compared to the coarse-scale sensors, the results showed that errors still affect the monitoring of smaller and possibly shallower depressions (e.g. Slangpan and Lake Banagher), compared to the larger depressions (Chrissiesmeer and Eilandsmeer). Results of individual depressions should be used with caution and investigated in the field before drawing conclusions. The Sentinel-2 images have the potential to be used at scales ranging from individual depressions through catchment level to national level, for reporting variation in hydrological regimes, reporting the maximum extent, and detecting functional diversity of wetlands.
Understanding larger interannual hydrological cycles for Chrissiesmeer and other catchments in South Africa
It is also important to further understand the larger interannual hydrological cycles at a catchment level, not only for global reporting, but also management at a local scale. De Villiers (2008) mentioned that 80% of the depressions dry up during dry years when the MAP reaches <450 mm, whereas pans are more perennial in wet years, when the MAP exceeds 750 mm. He also observed that during the floods of 2000 (following Cyclone Eline) and 2002, the road running along Chrissiesmeer's eastern shore was flooded for a total of 18 months (De Villiers, 2008). Tarboton (2009), on the other hand, indicated that Chrissiesmeer has dried out 5 times in the past century, with the most recent occurrence recorded in 1993-94. Improved understanding of the natural hydrological regime cycles of the catchment would likely inform policy formulation, planning, management and the management of water use in the catchment. Improved understanding of larger interannual cycles of wetlands will likely also improve the choice of reference and reporting periods of wetlands for SDG 6.6.
CONCLUSION
Inundation data derived from the freely available Sentinel-2 sensor proved to be valuable for monitoring and reporting of inundated wetlands both globally, at a country-wide scale and locally. The more frequent revisit time and finer spatial resolution of the Sentinel-2 sensor and images compared to the temporal resolution of the Landsat sensors improve the ability to report the maximum extent of predominantly inundated wetlands for the SDG 6.6 indicator, and to inform functional diversity and typing of wetlands that, in return, are reported to the Aichi 11 target and SDG 15.1. In addition, monthly variation in inundation could potentially track deviations from the natural hydrological regime resulting from outside influences such as groundwater abstraction, global or climate change.
ACKNOWLEDGEMENTS
We appreciate the access to the Chrissiesmeer open water dataset provided by GeoTerraImage Pty Ltd, as one of four publicly available datasets. The Council for Scientific and Industrial Research (CSIR) and Wet Earth Eco Specs (Pty) Ltd undertook fieldwork for the improvement of the wetlands map funded by Water Research Commission (WRC) Project K5/2546 'Enabling more responsive policy and decision making in relation to wetlands through improving the quality of spatial wetland data in South Africa'. The analysis for this paper was done by the CSIR funded by the Council for Scientific and Industrial Research (CSIR) Parliamentary Grant for the Common Multi-Domain Development Platform (CMDP) to Realise National Value of the Sentinel Sensors (1 April 2016-31 July 2019). We are extremely grateful to landowners who supported the fieldwork teams in providing access. Dr Mike Silberbauer and Dr Mervyn Lötter provided an early review and suggested improvements to this manuscript. Two anonymous reviewers have also contributed constructive comments to the improvement of this manuscript, to whom we are tremendously thankful.
DECLARATION OF INTEREST
No potential conflict of interest was reported by the authors.
AUTHOR CONTRIBUTIONS
Heidi van Deventer - conceptualisation, data curation, formal analysis, funding acquisition, methodology, oversight and leadership, project administration, software, writing ofthe original draft, Writing (integration of comments; review and editing); Anton Linström - conceptualisation, fieldwork, expertise on the MLD pans, review; Francois Durand - conceptualisation, expert on the geology, contribution on the writing of this section, and review and editing; Laven Naidoo - conceptualisation, expertise on radar systems, writing (review and editing); Moses Cho -conceptualisation, writing (review and editing).
ORCIDS
Heidi van Deventer: https://orcid.org/0000-0002-7854-2155
JF Durand: https://orcid.org/0000-0003-2966-1163
L Naidoo: https://orcid.org/0000-0002-7091-0566
MA Cho: https://orcid.org/0000-0001-8278-2111
REFERENCES
BAILEY AK and PITMAN WV (2016) Water Resources of South Africa, 2012 Study (WR2012). Volume 3: Book of Maps. WRC Report No. TT 685/16. Water Research Commission, Pretoria. [ Links ]
BARNES KN, JOHNSON DJ, ANDERSON MD and TAYLOR PB (2001) South Africa. In: Fishpool LDC and Evans MI (eds) Important Bird Areas in Africa and Associated Islands: Priority Sites for Conservation. Birdlife International, Pisces Publications, Cambridge. URL: http://datazone.birdlife.org/info/ibasafr [ Links ]
BIORESITA F, PUISSANT A, STUMPF A and MALET J-P (2019) Fusion of Sentinel-1 and Sentinel-2 image time series for permanent and temporary surface water mapping. Int. J. Remote Sens. 40 (23) 9026-9049. https://dx.doi.org/10.1080/01431161.2019.1624869. [ Links ]
CHAPMAN B, HESS L and LUCAS R (2016) Remote sensing of water in wetlands: inundation patterns and extent. In: Finlayson C, Everard M, Irvine K, Mcinnes RJ, Middleton BA, Van Dam AA and Davidson NC (eds) The Wetland Book. Springer, Dordrecht. https://doi.org/10.1007/978-94-007-6172-8_317-1. [ Links ]
CHERRY JA (2011) Ecology of wetland ecosystems: water, substrate, and life. Nature Education Knowledge. 3 (10) 16. [ Links ]
DLA (Department of Land Affairs, South Africa) (2000) The Chief Directorate Surveys and Mapping. 80 Years Anniversary 19202000. DLA, Cape Town. [ Links ]
DRDLR:NGI (Department of Rural Development and Land Reform: National Geo-Information) (2019) Standard for the Capture of Topographical Data. Document Reference QLAS.SD.4TOPO. Version 4. http://www.ngi.gov.za/index.php/technical-information/standards-menu (Accessed 10 February 2020). [ Links ]
DWS (Department of Water and Sanitation, South Africa) (2020) Sustainable Development Goal 6: 2020 data drive. South African response to the United Nations Environment Programme. DWS, Pretoria. https://www.dws.gov.za/projects/sdg/Water%20related%20Indicator%20Reports.aspx (Accessed 29 July 2021). [ Links ]
DE VILLIERS (2008) Birdlife at Lake Chrissie. Mccarthy TS, Cairncross B, Huizenga J-M, and Batchelor A Conservation of the Mpumalanga Lakes District, Unpublished report, University of the Witwatersrand, Johannesburg, South Africa. [ Links ]
DONALD PF, FISHPOOL LDC, AJAGBE A, BENNUN LA, BUNTING G, BURFIELD IJ, BUTCHART SHM, CAPELLAN D, CROSBY MJ, DIAS MP and co-authors (2019) Important Bird and Biodiversity Areas (IBAs): the development and characteristics of a global inventory of key sites for biodiversity. Bird Conserv. Int. 29 (2) 177198. http://dx.doi.org/10.1017/S0959270918000102. [ Links ]
EVENSON GR, GOLDEN HE, LANE CR, McLAUGHLIN DL and D'AMICO ED (2018) Depressional wetlands affect watershed hydrological, biogeochemical, and ecological functions. Ecol. Appl. 28 (4) 953-966. http://dx.doi.org/10.1002/eap.1701. [ Links ]
ESRI (Environmental Systems Research Institute ) (1999-2014) ArcGIS 10.3 [software]. ESRI, Redlands, California. ESA (European Space Agency) (2019) Sentinel Online. Advance online publication. URL: https://sentinel.esa.int/web/sentinel/missions/sentinel-2/instrument-payload/resolution-and-swath (Accessed 10 February 2020). [ Links ]
FISHPOOL LDC and EVANS MI (eds) (2001) Important Bird Areas of Africa and Associated Islands: Priority Sites for Conservation. Pisces Publications/BirdLife International, Newbury/Cambridge. [ Links ]
GOOGLE LIMITED LIABILITY COMPANY (LLC) (2020) Google Earth Pro version 7.3.3.7786 [dataset]. Available from the server kh.google.com and online https://earth.google.com [ Links ]
GOUDIE AS and THOMAS DSG (1985) Pans in southern Africa with particular reference to South Africa and Zimbabwe. Z. Geomorph. N.F. 29 1-19. [ Links ]
HUTCHINSON GE, PICKFORD GE and SCHUURMAN JFM (1932) A contribution to the hydrobiology of pans and inland waters of South Africa. Arch. Hydrobiol. 24 1-154. [ Links ]
IPBES (Intergovernmental Science-Policy Platform on Biodiversity and Ecosystem Services) (2019) Summary for policymakers of the global assessment report on biodiversity and ecosystem services of the Intergovernmental Science-Policy Platform on Biodiversity and Ecosystem Services. Díaz S, Settele J, Brondízio ES, Ngo HT, Guèze M, Agard J, Arneth A, Balvanera P, Brauman KA, Butchart SHM, Chan KMA, Garibaldi LA, Ichii K, Liu J, Subramanian SM, Midgley GF, Miloslavich P, Molnár Z, Obura D, Pfaff A, Polasky S, Purvis A, Razzaque J, Reyers B, Chowdhury RR, Shin YJ, Visseren-Hamakers Ij, Willis KJ, And Zayas CN (eds). IPBES Secretariat, Bonn. 56 pp. https://doi.org/10.5281/zenodo.3553579 (Accessed 10 February 2020). [ Links ]
KEITH DA, FERRER JR, NICHOLSON E, BISHOP MJ, POLIDORO BA, RAMIREZ-LLODRA E, TOZER MG, NEL JL, MACNALLY R, GREGR EJ and co-authors (2020) The IUCN Global Ecosystem Typology v1.01: Descriptive profiles for Biomes and Ecosystem Functional Groups. https://iucnrle.org/static/media/uploads/references/research-development/keith_etal_iucnglobalecosystemtypology_v1.01.pdf (Accessed 25 February 2021). [ Links ]
LE MAITRE DC, SEYLER H, HOLLAND M, SMITH-ADAO L, NEL JA, MAHERRY A and WITTHÜSER K (2018) Identification, delineation and importance of the Strategic Water Source Areas of South Africa, Lesotho and Swaziland for surface water and groundwater. WRC Report No. TT 754/1/18. Water Research Commission, Pretoria. [ Links ]
LEWIS AD (1935) Hydrographic Survey Paper No. 4. Run-off summaries for 77 stations up to September 30th, 1935. Irrigation Department, Pietermaritzburg, Union of South Africa. 4 pp. [ Links ]
LÖTTER M and LE MAITRE D (2021) Fine-scale delineation of Strategic Water Source Areas for surface water in South Africa using empirical bayesian kriging regression prediction: Technical report. Prepared for the South African National Biodiversity Institute (SANBI), Pretoria. 33 pp. [ Links ]
LI J and ROY DJ (2017) A global analysis of Sentinel-2A, Sentinel-2B and Landsat-8 data revisit intervals and implications for terrestrial monitoring. Remote Sens. 9 902. http://dx.doi.org/10.3390/rs9090902 [ Links ]
MANAKOS I, KORDELAS GA and MARINI K (2020) Fusion of Sentinel-1 data with Sentinel-2 products to overcome non-favourable atmospheric conditions for the delineation of inundation maps. Eur. J. Remote Sens. 53 53-66. https://doi.org/10.1080/22797254.2019.1596757 [ Links ]
MARNEWICK MD, RETIEF EF, WRIGHT DR and THERON NT (2015) South Africa's Important Bird and Biodiversity Areas Status Report 2015. BirdLife South Africa, Johannesburg. URL: https://www.cepf.net/sites/default/files/iba-statusreport2015.pdf (Accessed 21 August 2021). [ Links ]
MARSHALL T and HARMSE JT (1992) A review of the origin and propagation of pans. S. Afr. Geogr. 19 9-21. [ Links ]
McCARTHY TS, CAIRNCROSS B, HUIZENGA J-M and BATCHELOR A (2008) Conservation of the Mpumalanga Lakes District. Unpublished report. University of the Witwatersrand, Johannesburg. [ Links ]
MEYER-MILNE E and MLAMBO MC (2019) A tale of records from Hakskeen Pan, the first record of Pumilibranchipus deserti Hamer and Brendonck, 1995 (Anostraca, Branchiopoda) from South Africa and the pursuit of a new world land speed record. Afr. J. Aquat. Sci. 44 (4) 409-413. https://doi.org/10.2989/16085914.2019.1671165 [ Links ]
MEYER-MILNE E, MLAMBO MC and ROGERS DC (2020) Distribution of Clam Shrimps (Crustacea: Laevicaudata and Spinicaudata) in South Africa, with new records from the Northern Cape Province. Zool. Stud. 59 e39. https://doi.org/10.6620/ZS.2020.59-39 [ Links ]
MTPA (Mpumalanga Tourism and Parks Association) (2015) Chrissiesmeer Protected Environment Five Year Management Plan 2015-2019. Unpublished report, Mpumalanga Tourism and Parks Agency, Nelspruit. 141 pp. [ Links ]
MURO J, VAREA A, STRAUCH A, GUELMAMI A, FITOKA E, THONFELD F, DIEKKRÜGER and WASKE B (2020) Multitemporal optical and radar metrics for wetland mapping at national level in Albania. Heliyon. 6 e04496. https://doi.org/10.1016/j.heliyon.2020.e04496 [ Links ]
NAIDOO L, VAN DEVENTER H, RAMOELOE A, MATHIEU R, NONDLAZI B and GANGAT R (2019) Estimating above ground biomass as an indicator of carbon storage in vegetated wetlands of the grassland biome of South Africa. Int. J. Appl. Earth Observ. Geoinf. 78 118-129. https://doi.org/10.1016/j.jag.2019.01.021 [ Links ]
NASA (National Aeronautics and Space Administration) (2019) Landsat Science. Advance online publication. URL: https://landsat.gsfc.nasa.gov/landsat-8/ (Accessed 10 February 2020). [ Links ]
NEL JL, MURRAY KM, MAHERRY AM, PETERSEN CP, ROUX DJ, DRIVER A, HILL L, VAN DEVENTER H, FUNKE N and SWARTZ ER and co-authors (2011) Technical Report: National Freshwater Ecosystem Priority Areas Project. WRC Report No. 1801/2/11. Water Research Commission, Pretoria. [ Links ]
NHAMO L, MAGIDI J and DICKENS C (2017) Determining wetland spatial extent and seasonal variations of the inundated area using multispectral remote sensing. Water SA. 43 (4) 543-552. [ Links ]
NONDLAZI BX, CHO MA, VAN DEVENTER H and SIEBEN EJJ (unpublished) Determining the wetland-dryland boundary of depressions using functional traits of littoral vegetation. [ Links ]
OLLIS DJ, EWART-SMITH JL, DAY JA, JOB NM, MACFARLANE DM, SNADDON CD, SIEBEN EJJ, DINI JA and MBONA N (2015) The development of a classification system for inland aquatic ecosystems in South Africa. Water SA 41 (5) 727-745. https://doi.org/10.4314/wsa.v41i5.16 [ Links ]
OLLIS DJ, SNADDON CD, JOB NM and MBONA N (2013) Classification System for wetlands and other aquatic ecosystems in South Africa. User Manual: Inland Systems. South African National Biodiversity Institute (SANBI) Biodiversity Series 22. SANBI, Pretoria. [ Links ]
PARTRIDGE TC and MAUD RR (1987) Geomorphic evolution of southern Africa since the Mesozoic. S. Afr. J. Geol. 90 179-208. [ Links ]
PEKEL J-F, COTTAM A, GORELICK N and BELWARD AS (2016) High-resolution mapping of global surface water and its long-term changes. Nature. 540 418-422. http://dx.doi.org/10.1038/nature20584 [ Links ]
RAMSAR (1999) Resolution VII.11 People and Wetlands: The Vital Link. 7th meeting of the conference of the contracting parties to the Convention on Wetlands (Ramsar, Iran, 1971), San José, Costa Rica, 10 - 10 May 1999. URL: https://www.ramsar.org/sites/default/files/documents/library/key_res_vii.11e.pdf (Accessed 21 August 2021). [ Links ]
ROLLS RJ, HEINO J, RYDER DS, CHESSMAN BC, GROWNS IO, THOMPSON RM and GIDO KB (2018) Scaling biodiversity responses to hydrological regimes. Biol. Rev. 93 971-995. https://doi.org/10.1111/brv.12381 [ Links ]
RUSSELL JL (2008) The inorganic chemistry and geochemical evolution of pans in the Mpumalanga Lakes District, South Africa. MSc thesis, University of Johannesburg. [ Links ]
SCHUMANN GJ-P and MOLLER DK (2015) Microwave remote sensing of flood inundation. Phys. Chem. Earth A/B/C. 83-84 84-95. https://doi.org/10.1016/j.pce.2015.05.002 [ Links ]
SECRETARIAT OF THE CONVENTION ON BIOLOGICAL DIVERSITY (2020) Global Biodiversity Outlook 5. Montreal, Canada. URL: https://www.cbd.int/gbo/gbo5/publication/gbo-5-en.pdf (Accessed 20 August 2021). [ Links ]
SAWS (South African Weather Service) (2018) Data showing the maximum monthly rainfall recorded for the Chrissiesmeer rainfall station in the Mpumalanga Province. SAWS, Pretoria, South Africa. [ Links ]
TARBOTON W (2009) Motivation for Ramsar Status for the Chrissiesmeer Panveld: Avifauna, Mpumalanga Tourism & Parks Association (MTPA), Nelspruit, South Africa. [ Links ]
THE PROVINCE OF MPUMALANGA (2014) Provincial Gazette Extraordinary 21 (2251). The Province of Mpumalanga, Nelspruit. [ Links ]
THOMPSON M (2021) Personal communication, 12 July 2021 (e-mail). The SANSA cloud-free water datasets [Mzansi Amanzi version 2] that will soon be available. Mr Mark Thompson. Director (Land & Water Resource Mapping), GeoTerraImage. [ Links ]
THOMPSON M, HIESTERMANN J, MOYO L and MPE T (2018) Cloud-based monitoring of SA's water resources. Position IT Magazine. March 38-41. [ Links ]
UN (United Nations) (2017) Integrated Monitoring Guide for SDG 6: Step-by-step monitoring methodology for indicator 6.6.1 on water-related ecosystems. Version 20 January 2017. URL: http://www.unwater.org/app/uploads/2017/05/Step-by-step-methodology-6-6-1_Revision-2017-01-20_Final-1.pdf (Accessed 17 July 2021). [ Links ]
UN (United Nations) (2020) The Sustainable Development Goals Report. https://unstats.un.org/sdgs/report/2020/The-Sustainable-Development-Goals-Report-2020.pdf (Accessed 20 August 2021). [ Links ]
VAN DEVENTER H (2021) Monitoring changes in South Africa's surface water extent for reporting Sustainable Development Goal sub-indicator 6.6.1.a. S. Afr. J. Sci. 117 (5/6) Art. #8806. https://doi.org/10.17159/sajs.2021/8806 [ Links ]
VAN DEVENTER H, LINSTRÖM A, NAIDOO L, JOB N, CHO MA and SIEBEN EJJ (unpublished) Comparison between Sentinel-2 and WorldView-3 sensors in mapping wetland vegetation groups communities for monitoring under climate change. [ Links ]
VAN DEVENTER H, NAIDOO L, CHO MA, JOB NM, LINSTRÖM A, SIEBEN E, SNADDON K and GANGAT R (2020a) Establishing remote sensing toolkits for monitoring freshwater ecosystems under global change. WRC Report No. 2545/1/19. Water Research Commission, Pretoria. http://wrcwebsite.azurewebsites.net/mdocs-posts/establishing-remote-sensing-toolkits-for-monitoring-freshwater-ecosystems-under-global-change/ (Accessed 8 December 2021). [ Links ]
VAN DEVENTER H, SMITH-ADAO L, COLLINS NB, GRENFELL M, GRUNDLING A, GRUNDLING P-L, IMPSON D, JOB N, LÖTTER M, OLLIS D and co-authors (2019) South African National Biodiversity Assessment 2018: Technical Report. Volume 2: Inland Aquatic (Freshwater) Component. Council for Scientific and Industrial Research (CSIR) and South African National Biodiversity Institute (SANBI), Pretoria, South Africa, Report Number: CSIR Report No. CSIR/NRE/ECOS/IR/2019/0004/A, SANBI handle: http://hdl.handle.net/20.500.12143/6230. [ Links ]
VAN DEVENTER H, SMITH-ADAO L, MBONA N, PETERSEN C, SKOWNO A, COLLINS NB, GRENFELL M, JOB N, LÖTTER M, OLLIS D and co-authors (2018a) South African Inventory of Inland Aquatic Ecosystems (SAIIAE). Council for Scientific and Industrial Research (CSIR) Report No. CSIR/NRE/ECOS/IR/2018/0001/A, South African National Biodiversity Institute (SANBI) Report No. http://hdl.handle.net/20.500.12143/5847. [ Links ]
VAN DEVENTER H, SMITH-ADAO L, PETERSEN C, MBONA N, SKOWNO A and NEL JL (2018b) Review of available data for a South African Inventory of Inland Aquatic Ecosystems (SAIIAE). Water SA. 44 (2) 184-199. http://dx.doi.org/10.4314/wsa.v44i2.05. [ Links ]
VAN DEVENTER H, VAN NIEKERK L, ADAMS J, DINALA MK, GANGAT R, LAMBERTH SJ, Lötter M, MBONA N, MACKAY F, NEL JL and co-authors (2020b) National Wetland Map 5 - An improved spatial extent and representation of inland aquatic and estuarine ecosystems in South Africa. Water SA. 46 (1) 66-79. https://doi.org/10.17159/wsa/2020.v46.i1.7887 [ Links ]
WEEPENER HL, VAN DEN BERG HM, METZ M and HAMANDAWANA H (2012) The development of a hydrologically improved digital elevation model and derived products for South Africa based on the SRTM DEM. WRC Report No. 1908/1/11. Water Research Commission, Pretoria. [ Links ]
WELLINGTON JH (1943) The Lake Chrissie Problem. S. Afr. Geogr. J. 25 50-64. https://doi.org/10.1080/03736245.1943.10559227 [ Links ]
WULDER MA, WHITE JA, LOVELAND TR, WOODCOCK CE, BELWARD AS, COHEN WB, FOSNIGHT EA, SHAW J, MASEK JG and ROY DP (2016) The global Landsat archive: Status, consolidation, and direction. Remote Sens. Environ. 185 271-283. https://doi.org/10.1016/j.rse.2015.11.032 [ Links ]
 Correspondence:
Heidi van Deventer
Email: HvDeventer@csir.co.za
Received: 22 February 2021
Accepted: 7 December 2021

