


Services on Demand
Article
 English (pdf)
 Article in xml format
 Article references
Indicators

Related links
-
 Cited by Google
 -
 Similars in Google
Share

 Permalink
Water SA
On-line version ISSN 1816-7950
Print version ISSN 0378-4738
Water SA vol.48 n.1 Pretoria Jan. 2022
http://dx.doi.org/10.17159/wsa/2022.v48.i1.3891
RESEARCH PAPER
Framework for implementation of the Pitman-WR2012 model in seasonal hydrological forecasting: a case study of Kraai River, South Africa
Sesethu Fikileni; Piotr Wolski
Climate System Analysis Group, University of Cape Town, Cape Town, South Africa
ABSTRACT
Hydrological forecasting becomes an important tool in water resources management in forecasting the future state of the water resources in a catchment. The need for a reliable seasonal hydrologic forecast is significant and is becoming even more urgent under future climate conditions, as the assimilation of seasonal forecast information in decision making becomes part of the short and long-term climate change adaptation strategies in a range of contexts, such as energy supply, water supply and management, rural-urban, agriculture, infrastructure and disaster preparedness and relief. This work deals with the framework for implementation of the Pitman-WR2012 model in a hydrological forecasting mode. The Pitman-WR2012 model was forced with 10-member ensemble seasonal climate forecast from Climate Forecast Systems v.2 (CFSv2), which is downscaled using the principal components regression (PCR) approach. The generated seasonal hydrological forecast focused on the summer season, in particular on the Dec-Jan-Feb (DJF) period, which is the rainy season in the studied catchment (Kraai River catchment in the Eastern Cape Province of South Africa). The hydrological forecast issued at the end of November showed skill in December and February (assessed through Receiver Operating Characteristic (ROC) and Ranked Probability Skill Score (RPSS)), with poorer skill in January. Importantly, the skill of streamflow forecast was better than that of rainfall forecast, which likely results from the influence of the initial conditions of the hydrological model. In conclusion Pitman-WR2012 model performed realistically when implemented in seasonal hydrological forecasts mode, and it is important that in that mode the model is run with near-real-time rainfall data in order to maximize forecast skill arising from initial conditions.
Keywords: hydrological forecasting, Pitman-WR2012 model, seasonal forecasting, WR2012 study
INTRODUCTION
In Southern Africa, where runoff coefficients, or the rate of conversion of mean annual precipitation to mean annual runoff, are less than 9% (FAO, 2003) and climate is highly seasonal, water is scarce and water availability is highly variable both spatially and temporally. Therefore, the hydro-climatological extremes (i.e. droughts, floods) and hydroclimatological variability in general pose many challenges in water resource management. In future, flooding and drought events are expected to become more commonplace in the changing climate (Davis-Reddy and Vincent, 2017).
In such a context, hydrological forecasting becomes an important tool in water resources management. The potential economic benefits of hydrological forecasts result from their potential to prevent extremes- (and in particular drought-) related crises, but also from improved management during 'ordinary' years. Yao and Georgakakos (2001) and Hamlet et al. (2002) have shown how hydropower revenues can be increased through the incorporation of climate information in hydrologic forecasts. Additionally, the use of hydrological forecasts may be an important adaptation to the non-stationary climate in the future (Pagano et al., 2001; Steinschneider and Brown, 2012). Seasonal hydrological forecasts may also improve reservoir operating procedures (Whateley, 2012).
Seasonal hydrological forecasting has the potential to impact decision making in water resource management, such as for agriculture and water supply. Hence, operational seasonal hydrological forecasts can be used to optimize water resources management and increase supply in different hydrological conditions (Chiew et al, 2003; Shamir, 2017). This is typical for applications that include long-term contingency planning for floods and droughts, water demands and allocation for irrigation or domestic/industrial water use, energy production forecasting (hydropower), environmental monitoring and climate adaptation. Seasonal hydrological forecasts over periods of weeks to months are particularly useful for water resource management, where future flows depend on storages such as snow accumulation or man-made reservoirs (Butts et al., 2017; Amnatsan et al., 2018; Etter et al., 2018).
Given the above-mentioned potential impact of seasonal hydrological forecasts there is a need for a framework on how to implement this in South Africa's context. Since in South Africa, water resource planning and management is based on the Pitman-WR2012 model (Seago, 2016; Pitman, 2011; Bailey, 2008), it is logical to develop such a framework using that model. The framework should allow implementation of the Pitman-WR2012 model in an operational mode (i.e. every month in 'near-real-time') and in evaluation mode (utilizing a set of retrospective forecasts). The Pitman-WR2012 model in its standard form is designed and set up for evaluation of water resources on an occasional, ad-hoc basis, and historically the country-wide model has been updated only 4 times (1990, 2000, 2005 and 2012). As a result, the framework has to include not just a way of linking the model with forecast climate data, but also a way to ingest near-real-time observational data. This is because the original WR2012 input dataset intended for model use in the water resources evaluation context is 'static', i.e. prepared for a certain period of time, and updated only every several years. The Pitman-WR2012 model is operated under the South African Government's national Department of Water and Sanitation (DWS) in collaboration with other stakeholders such as the Water Research Commission of South Africa and Royal Haskoning (DHV). The model is available online at https://waterresourceswr2012.co.za/.
There is limited knowledge in South Africa on the implementation of the Pitman-WR2012 model in operational hydrological forecasting, and there has there been no research on use of the model in retrospective forecast mode. The reasons for this limited application of the hydrological model in seasonal hydrological forecasting was explained by Wolski et al. (2017), who highlighted the following: (i) the fact that seasonal hydrological forecasts are generated within the science and practice domain which emanate from different disciplines (i.e., hydrology and climate science) -this has implications in terms or understanding and using the climate forecast by hydrologists and water managers; (ii) the low to fair predictive skill of seasonal climate forecasts which seasonal hydrological forecasts have to rely on to generate the hydrological forecasts. Furthermore, the low uptake of seasonal forecasts is often ascribed to water managers' tendency to act in a risk-averse manner, 'poor' forecast skill or scale, difficulty in integrating forecasts into existing decision support systems, lack of focus on specific user needs, anticipated shifts in the water sector in terms of development, management and political disincentives, individual and institutional inflexibility, behavioural effects, and informational constraints (Millner, 2009; Ziervogel et al., 2010).
Seasonal climate forecasting in South Africa
There are two multi-model seasonal forecasts that are globally available currently. These are North American Multi-Model Ensemble Project (NMME) and European Centre for Medium range Weather Forecast hosted by Copernicus Programme (Copernicus@ECMWF). Both systems regularly publish seasonal climate forecast products based on data from state-of-the-art seasonal prediction systems or models. The number of available forecast models changes as new models are added and old versions are upgraded. Currently (end of 2021) there are 6 models available in each of the two ensembles, out of which one model is shared.
Seasonal forecasts in South Africa have evolved from a simple statistical model to forecasts based on the AGCMs and statistical downscaling, fully coupled GCMs and integrated within a multimodel approach (Landman, 2014). The South African Weather Service (SAWS) is the country's official meteorological service that currently operates a fully interactive coupled modelling system, named the SAWS Coupled Model (SCM), the first of its kind in both South Africa and the region (SAWS, 2018). Each month its scientists produce a 3-month rainfall and temperature outlook using a multi-tiered forecast system consisting of a dynamic modelling process, combined with a statistical approach and a consensus discussion (Landman et al., 2001; Johnston et al., 2004).
Until a few years ago, apart from SAWS, two additional institutions in South Africa generated and produced numerical seasonal climate forecasts which were then made available online (at www.gfcsa.net) every month. These were the Council for Scientific and Industrial Research (CSIR) and the Climate System Analysis Group (CSAG) of the University of Cape Town. For a number of institutional and human resources factors, the CSIR initiative has been merged with that of SAWS, the CSAG's forecast was discontinued in 2016 due to concerns around the poor quality of the forecast and ethical concerns around the consequences of its poor skill for decisions that might be taken based on it, in agricultural, water management and other contexts.
In terms of research, there are many published studies that address the issue of implementation and skill of seasonal climate forecasts in South Africa. For instance, Landman et al. (2012) and Landman and Beraki (2012) evaluated the skill of forecasting the mid-summer rainfall in South Africa. The skill was assessed over a 22-year retroactive test period (1980/1981 to 2001/2002) by considering multi-model ensembles consisting of downscaled forecasts. Results indicated that the multi-model forecasts outperform the single model forecasts, that the two multi-model schemes produce about equally skillful forecasts, and that the forecasts perform better during El Niño and La Niña seasons than during neutral years, suggesting that further improvement in operational seasonal rainfall forecast skill for South Africa is still achievable.
Engelbrecht et al. (2017) in turn focused on skill in predicting intra-seasonal characteristics of synoptic-type occurrence at the seasonal time-scale over the all-year rainfall region, by utilizing an ensemble of simulations performed using GloSea5 coupled ocean-atmosphere model. Results showed that deterministic and probabilistic assessment of synoptic-type frequency forecasts indicates that intra-seasonal circulation variability over the Cape south coast region is marginally predictable at seasonal time scales, more so during Sep-Oct-Nov (S0N) than Dec-Jan-Feb (DJF). Furthermore, results indicated that there is potential for the skillful seasonal prediction of the anomalous frequency of occurrence of high-impact rainfall events associated with cut-off lows within SON seasons.
The use of seasonal climate forecasts in South Africa is becoming a more established part of the climate information landscape. These seasonal climate forecasts have potential uses in the agricultural sector (planning planting dates, irrigation, and crop type) and in the water management sector (Klopper et al., 2006; Winsemius et al., 2014). For instance, Kgakati and Rautenbach (2014) examined the use of seasonal climate forecast information in the agricultural sector in South Africa, mainly looking at dissemination of early warnings to reduce risks faced by farmers. The study assessed the channels through which the seasonal climate forecast information is disseminated to end-users. The results showed that improved channels and structures that are reliable, and timely seasonal climate forecast information that can serve as early warnings, should be developed. However, the integration of seasonal climate forecast information by smallholder farmers into their farm planning has been poor because of the lack of forecast skill, communication and inability to see the relevance of seasonal climate forecasts for specific farming decisions (Chisadza et al., 2020).
Among other studies on seasonal climate forecasts in South Africa, has been a study of the use of seasonal climate forecasts in the health sector as an early warning system for malaria (Kim et al., 2019). The study used well-organised malaria surveillance and high-quality climate forecasts to sustain a malaria early-warning system in conjunction with an effective malaria prediction model. A weather-based malaria prediction model was developed using weekly time-series data including temperature, precipitation and malaria cases from 1998-2015 in Vhembe, Limpopo, South Africa, and was applied to seasonal climate forecasts. The results showed that the developed weather-based malaria prediction model could be applicable in practice, together with skillful seasonal climate forecasts and existing malaria surveillance data.
Seasonal hydrological forecasting in South Africa
Seasonal hydrological forecasting activities in South Africa are limited. There appears to be no operational seasonal forecast where a hydrological model is linked to a seasonal climate forecast, although recently there have been efforts at SAWS in linking a land surface model with the operational seasonal climate forecast (De Wit et al., 2019).
One of the earlier works on seasonal hydrological forecasting in South Africa was done by Landman et al. (2001). The forecasts were categorical (i.e. above-normal near-normal and below-normal) and were issued for Tugela and Vaal rivers. These forecasts were based on a statistical downscaling of GCM fields directly to streamflow at a catchment exit. These forecasts were made for the summer season (DJF) over an 8-year independent period from 1987/1988 to 1994/1995.
In another initiative, SAWS initiated implementation of the ACRU model linked with a coupled climate model, which was aimed at creating an earth systems model-like configuration to be used in a seasonal hydrological forecasting context. However, the system appears to no longer be functional, as the generated forecasts were last updated in June 2011. These forecasts are available online through the South African Risk and Vulnerability Atlas (https://sarva.saeon.ac.za/atlas/).
River flow prediction based on rainfall forecasts from a coupled general circulation model over South Africa was implemented by Olivier et al. (2013). The ACRU model was selected for the purpose of the daily time step. Observed river-flow data were obtained from the Hydrological Information System (HIS) and the Department of Water and Sanitation (DWS). A multiple-program multiple-data procedure (Beraki et al., 2013) was applied to provide large-scale predictors to be downscaled. A downscaling process was done retroactively by applying the CCA option of Climate Predictability Tool to the CGCM seasonal output and river-flow measurements.
In a study conducted by Malherbe et al. (2013), the SINTEX-F coupled model was used to forecast maize yield and streamflow in Limpopo Province, South Africa. SINTEX-F hindcasts of DJF 850 hPa geopotential height fields were statistically downscaled to yields at 4 agricultural districts and to flows at 6 river flow gauges using a Model Output Statistics (MOS) (Wilks, 2011) approach. Results suggested the potential for a commodity-orientated forecast system for application in agriculture in an operational environment. Therefore, the study serves as a baseline study for runoff models using GCM output data towards estimating potential yields and streamflows of a particular catchment.
A recent work by Wolski et al. (2017) used the so-called land surface model (VIC) rather than a traditional hydrological model, targeting the relative importance of initial and boundary conditions. The experiments involved running the land surface model multiple times in retrospective forecast mode, with individual simulations differing in both initial and boundary condition in the ensemble streamflow prediction set-up described by Wood and Lettenmeier (2006). The results obtained from that study showed that at small spatial scales (~2 500 km2) there is a very low sensitivity to initial conditions.
This study stems from the above-described landscape of seasonal hydrological forecasting and aimed to describe a framework to implement the Pitman-WR2012 model, which is the basis for water resources management in South Africa, in the seasonal hydrological forecasting mode for both operational use and in retrospective forecast.
Case study area
The Kraai River catchment in the Eastern Cape was used as a case study because it is one of the catchments in South Africa that has no significant water or land use development, and relatively stable long term mean annual precipitation (MAP) with relatively low interannual variability. This catchment thus provides a good testbed for seasonal hydrological forecasting where the quality of the forecast and hydrological simulation in general is influenced by very few factors that are unrelated to the forecast itself, such as quality of data on water abstractions and land use changes.
The Kraai River catchment, with an area approximately 9 354 km2, is called D13 tertiary catchment and falls in the Orange Water Management Area. The catchment is located at 30°51'9"S 27°46'40"E in the northeast of the Orange Water Management Area and at the southernmost end of the Drakensberg, south of Lesotho, in the magisterial district of Barkly East in the Eastern Cape Province, South Africa. The Kraai catchment starts at altitudes of up to 3 000 m on the basaltic rocks of the watershed that forms the boundary between South Africa and Lesotho.
Rainfall in Kraai River catchment is predominantly delivered by summer thunderstorms. Annual precipitation rates are variable, with the east of the catchment receiving approximately 1 000 mm/a and the west as little as 200 mm/a.
METHODS AND DATA COLLECTION
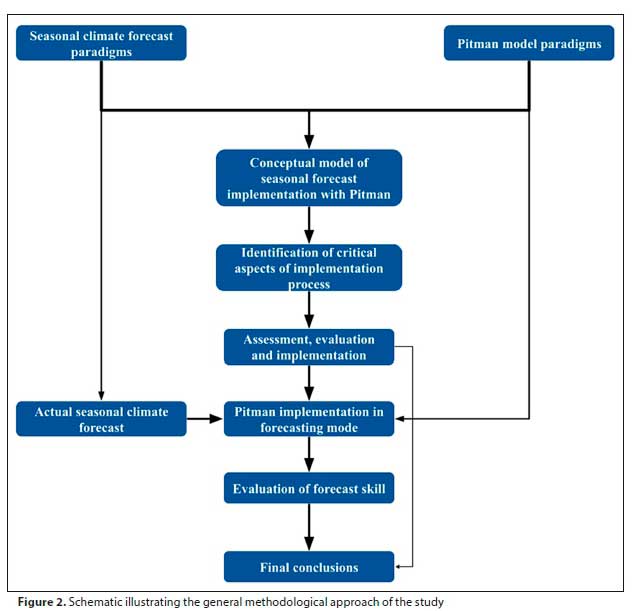
The methodological approach of this work was based on three major steps:
1. Description and review of (i) the Pitman model, its configuration and implementation from the perspective of data flow, and (ii) the typical process of issuing a seasonal climate forecast from the perspective of data flow. That process leads to the identification of critical steps that have to be executed in order to be able to link the seasonal climate forecast with the Pitman model.
2. Setting up the Pitman model in the seasonal forecasting mode, including analyses and processing of data within the critical steps identified in the first step.
3. Implementation of seasonal hydrological forecast based on retrospective forecasts from a selected forecasting system, and evaluation of results.
Hydrological modelling with Pitman-WR2012 model
Hydrological modelling is one of the most important steps in seasonal hydrological forecasting. Therefore, setting up the model for the Kraai River catchment was the first step in running the Pitman-WR2012 model. The process of setting up a hydrological model for a catchment requires a number of steps such as conceptualization of the catchment. The following are the generic steps that are required to set up the model:
• Conceptualization of the catchment processes: development of the so-called 'conceptual model'
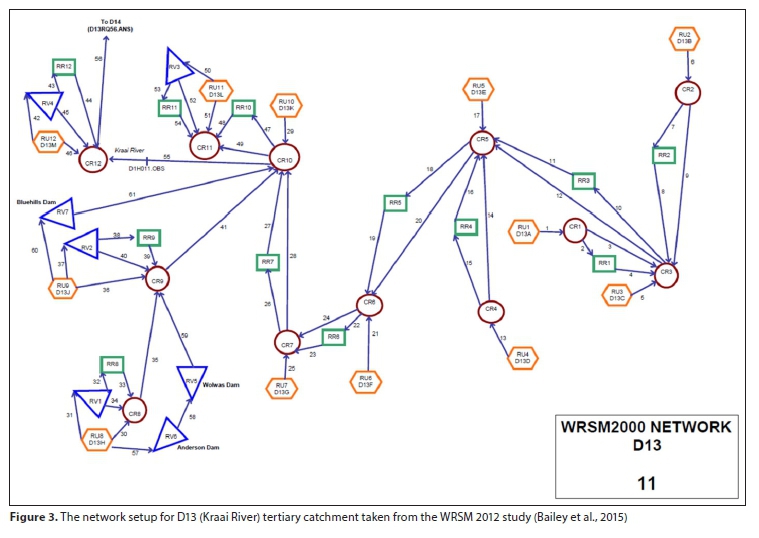
• Determination and implementation of model structure that reflects the conceptual model (Fig. 3)
• Preparation of input and observed response datasets
• A-priori determination of model parameters (if possible)
• Calibration of model parameters
• Model evaluation (sensitivity analyses)
• Application of the model for intended purpose
The Pitman model is a continuous simulation rainfall-runoff model (Fig. 4). As such it simulates the catchment runoff over a period of time with prescribed start and end points. Input data have to be available for the entire simulation period. The main input data in Pitman-WR2012 model are rainfall and evaporation data. Only rainfall is provided as a time series. Evaporation is represented as a climatology, i.e., with 12 monthly values. Both are provided at the quaternary catchment level. The evaporation data are Symons-pan evaporation, and not the more widely used Class A Pan evaporation. In a typical application for water resource assessment, the Pitman model is implemented in the following way: The model in this setting is run continuously with historical rainfall data of at least 25 years to produce continuous simulations. The Pitman-WR2012 model does not have the option to start from a particular initial condition, which means initial conditions are not explicitly needed as the model is initialized internally. There is therefore no option to re-initialize the model from the initial conditions obtained through an earlier continuous model run.
Data
Forecast data
This research utilizes seasonal forecast data generated by Climate Forecasting System v.2, (CFS) (https://www.cpc.ncep.noaa.gov/products/CFSv2/CFSv2_body.html). The CFS system is a medium-and long-range numerical weather prediction and climate model which is operated by the National Centres for Environmental Prediction (NCEP) and based on initial conditions of the last 30 days, with 4 runs from each day (Saha et al., 2014). The re-forecast spans the period of December 1981 to March 2011, with the period of April 2011 to date covered by archived operational seasonal climate forecasts.
For the purposes of this research, re-forecast and operational data for the period of 1982-2016 were downloaded from http://www.cpc.ncep.noaa.gov. The data included 10 members of the forecast ensemble issued in the beginning of December and covering the period of Dec-Jan-Feb of each year.
Downscaling of the forecast
The downscaling of the forecast was done using the principal component regression (PCR) approach. This approach utilizes forecast fields of geopotential height at 850 mb that are subject to principal component decomposition as predictor variable, and WR2012 data as predictand, to develop the regression relationship.
To derive the predictor variable, monthly means of retrospective forecast fields, covering the perio d of1982-2017 over the following domain: 45 S-0 S 0 E-55 E, were subject to dimensionality reduction using principal component (PC) analysis. This domain and predictor variable are typically used in MOS downscaling of forecasts over South Africa (Landman and Goddard, 2002; Malherbe et al., 2014). The only significant PC components are retained and used as variables in multiple regression. The multiple regression equation is established for each month of forecast and for each lead time up to 3 months ahead of the forecast month (i.e., there will be 3 equations for forecast issued in November and forecasting November, December and January rainfall, and subsequently 3 equations for forecast issued in December forecasting December, January and February rainfall, etc.)
The advantage of this method of downscaling is that it generates data that are by design bias-free, and directly compatible with the input to the hydrological model. Lack of bias is achieved because the predictors in the PCR model are actual forecasts rather than observations (which contrasts this approach with what is known as a 'perfect prognosis' approach where predictors are taken from observations or climate reanalysis and the forecast is assumed to 'perfectly simulate' those predictors), and in this way, systematic bias of forecast is removed. The compatibility with the hydrological model is achieved through the fact that the input observational data from hydrological models are actually used as a predictand in the PCR regression model, and so the predicted values do not have to be processed in any way. It has to be noted that the process of downloading, processing and downscaling of CFSv2 forecast data was not carried out specifically in this project. Instead, downscaled data were used that are generated by a system of routine processing of climate forecast data on the Climate System Analysis Group (CSAG) computing cluster, created within the framework of Water Research Commission Projects K5-2436 and K5-2746 (Wolski et al., 2017), and subsequently available through https://cip.csag.uct.ac.za/forecast/.
Rainfall andstreamflow data
Rainfall is one of the primary inputs in a hydrological model that is to be run in hydrological forecasting mode. In this study, the principal rainfall dataset is the catchment rainfall generated in the WR2012 study (waterresourceswr2012.co.za). That dataset covers the period 1920-2009 only, and in order to enable implementation of the Pitman-WR2012 model in the seasonal forecasting mode that dataset has to be extended to near-real-time. The WR2012 catchment-level rainfall data were originally created from data from stations operated by SAWS. While it is possible to extend the WR2012 data with post-2009 SAWS data, we decided to use a satellite-based rainfall dataset - CHIRPS. This is because, firstly, institutional constraints make timely (and free) access to SAWS data difficult and, secondly, evaluation of historical data (not shown) indicated that the CHIRPS dataset was superior in replicating WR2012 data over the period of 1981-2009 compared to raw station data from SAWS. A detailed analysis that compares the two candidate datasets will be presented in a future publication.
WR2012 Streamflow data is on a monthly timescale, and the WR2012 data is a compilation of quality-controlled data measured by the DWS at their river gauge network. The extended streamflow data for D1H011 Station (located at the outlet of Kraai River catchment) was downloaded from the DWS online database (www.dwa.gov.za > hydrology). The data cover the period 1965-present. These data are processed and verified at DWS.
Forecast skill assessment
There are various ways to assess the skill of a forecast, depending on the forecaster's interest and the nature of the forecast produced. Two methods were used to assess the skill of the forecasts for this study: Relative Operating Characteristic (ROC) with ROC skill score and Ranked Probability Score (RPS) together with Ranked Probability Skill Score (RPSS) as extracted from RPS. In this study, the forecast skill assessment is done considering that the implemented forecast is probabilistic in nature. The probabilistic forecasts give a probability of an event occurring with a value between 0 and 1 or 0 and 100%. Skill scores were calculated for streamflow forecast, but also for the downscaled rainfall forecast used to force the Pitman-WR2012 model.
Ranked Probability Skill Score (RPSS) is a skill score that is based on the Rank Probability Score (RPS) values. Rank Probability Score (RPS) measures the sum of squared differences in cumulative probability space for a multi-category probabilistic forecast. This method penalises forecasts more severely when their probabilities are further from the actual outcome. This method uses a range of 0 to 1, with 0 being a perfect score. The equation for calculation of RPS:
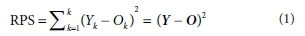
where Ykand Okdenote the kth component of cumulative forecast and observation vectors Y and O, respectively. Yk = Σk= yi, with y being the probabilistic forecast for the event to happen in category i and Ok = Σk=1k O¡ with O¡ = 1 if the observation falls into a category j ^ i.
The above equation for the RPS is for a given probabilistic forecast-observation pair.
RPSS is then defined as follows:

where RPSreference is the RPS of a reference forecast. The most commonly used reference forecasts are persistence and climatology. The RPSS is a favourable skill score in that it considers both shape and overall tendency of the forecast, where 0 indicates no skill when compared to reference forecast and 1 being a perfect score.
Receiver Operating Characteristic (ROC) method originates from the quality control and signal detection theory where the quality of performance is assessed by relations between the hit and false alarm rates. The ROC curve gives a total description of the skill of the model forecasts at all probability thresholds. A model having its ROC curve lying above and to the left of the diagonal line ((0; 0) to (1; 1), is considered to have a good skill, while a model with ROC curve below the diagonal has no skill, i.e., it is worse than a climatological guess. The ROC score evaluates the model forecast by examining the relative performance of hit and false alarm rates across the entire range of probability thresholds; integrated measurement of the curve can provide the score that is independent of the threshold probability level chosen to transform probability forecast to binary form.
ROC score is defined as the area under the ROC curve. This skill score is equal to 1 for the perfect forecast and 0.5 for no skill (Kharin and Zwiers, 2003). The ROC scores are, therefore, given with this equation:

where SROC is the ROC score and AROC the area under the ROC curve.
Analysis
Climate forecasts were implemented in the unmodified version of the Pitman-WR2012 model to produce streamflow forecasts for the Kraai River catchment. The outputs were processed using an R statistical programming tool for visualization.
RESULTS
Implementation of the Pitman-WR2012 model in seasonal hydrological forecast
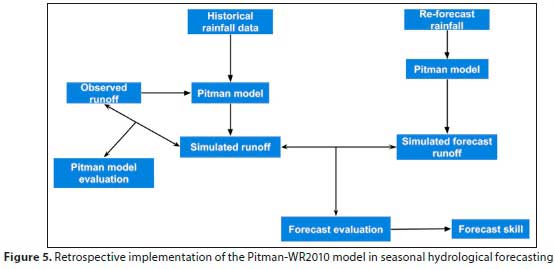
There are two phases ofPitman-WR2012 model implementation in seasonal hydrological forecasts that have to be distinguished. The first is implementation of Pitman-WR2012 model in retrospective forecasts (or re-forecast) for the purpose of evaluation of skill of hydrological forecast (Fig. 5). This is done only once.
The second is the operational forecast, which is an ongoing, regular process (Fig. 6).

Running the Pitman-WR2012 model in seasonal hydrological forecasting
There are steps that are followed in order to implement the
Pitman-WR2012 model in both re-forecast and actual operational hydrological forecasting mode.
In practice this was implemented in the following way:
• Downscaled rainfall for a given forecast and for a given rainfall zone was substituted for the original rainfall for the forecast period in the Pitman model rainfall file (with WR2012-CHIRPS data) for that zone
• The model was executed for the entire WR2012-CHIRPS data period, i.e. 1920-2016
• Results of runoff simulations for the period of forecast were extracted for further analyses, and data after that period were discarded
• Steps 1-3 were repeated for each year and for each ensemble member
Figure 7 shows the selected conditions of years for seasonal hydrological forecast for DJF season. However, Figs 8-11 show streamflow forecasts during selected years of wet, dry and average years in the 1982-2016 period, in order to illustrate how the Pitman-WR20102 hydrological forecast looks across a range of conditions. These forecasts of streamflow at the D1H011 Gauge were produced by forcing the Pitman-WR2012 model with 10 ensemble members of seasonal climate forecasts for the DJF season. For each of the wet, dry and average years, 4 years were selected by examining the observed streamflow of the Kraai River catchment.
During the wet years most ensemble forecasts are not distributed around the observed and simulated streamflow in all the selected years (Fig. 8). However, in average and dry years the ensemble member forecasts are mostly distributed around the observed and simulated streamflow (Figs 8-10), except in dry year 1994. The differences between selected dry and wet years might indicate differences in forecast climate model skill that is conditional on the strength of regional climate forcing, as explained by Landman and Beraki (2012). The exploration of this is, however, beyond the scope of this study.

Skill assessment of the hydrological forecasts
For the purpose of assessment of hydrological forecast skill, a series of historical forecasts, or re-forecasts, was implemented. Each re-forecast covered a period of 3 months. Although in an operational setting forecasts could be issued every month, the focus here is on forecasting the core of the rainy season, i.e., the months of DJF. The re-forecasts implemented here spanned the period of 1982-2016, i.e., there was a forecast issued starting at each December in that period. Each forecast was based on 10 member ensembles of climate forecast.
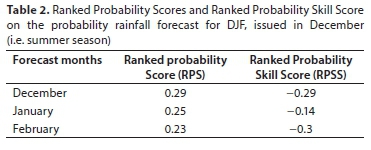
RPS and RPSS
Tables 1 and 2 show the results of RPS and RPSS for both streamflow and rainfall forecasts for DJF. The RPSS showed skill in streamflow forecast in December but not in January and February (Table 1). There is no skill for the rainfall forecast in any of the months (Table 2). The RPSS values are higher for streamflow than rainfall forecasts.

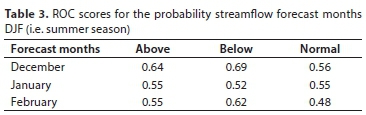
ROC score and ROC curve
Figure 11 shows ROC curves for all the categories (above, below and normal) of streamflow forecast at D1H011 in the Kraai River catchment for each month of forecast. For the December and February months in all the categories the forecasts are mostly above the 1:1 line, except for February (normal), where the forecast is below and above the 1:1 line. For the month of January in all the categories the forecasts are mostly below the 1:1 line.
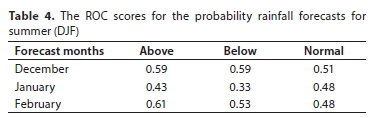
Tables 3 and 4 show ROC skill scores of the forecast of streamflow and rainfall for the summer season (DJF). Tables 3 and 4 distinguish skill for the probabilistic forecast of above, below and normal streamflow for each of the months during the summer season (DJF). Generally, the forecasts are skillful, as most of the scores are above the no-skill values of 0.5 for all the months, apart from February for normal conditions (Table 3). The skill is generally higher for above and below normal runoff than for normal runoff. The skill is generally better for December and February than January. There is a similar pattern of skill for the rainfall forecast (Table 4) and streamflow forecast (Table 3). Importantly, the skill of streamflow forecast is considerably better than the skill of rainfall forecast.
DISCUSSION
Framework for implementation of seasonal hydrological forecasting
The choice of data source (i.e rainfall, climate forecast, stream flow, etc.) for a hydrological forecasting system is crucial for the real-time operational hydrological forecasting system. Hence, the skill of the forecast is mostly affected by the quality of the data used to generate the forecasts. In this paper, seasonal climate forecast 10 ensemble members (i.e., rainfall) from CFS v2 were used as an input to the Pitman-WR2012 model to produce seasonal hydrological forecasts for the Kraai River catchment. This approach, i.e., using a hydrological model linked to seasonal climate forecast to produce seasonal hydrological forecasts, is often used in research and operational settings (Yuan et al., 2015; Wolski et al., 2018; Liu et al., 2019).
In this study, updating the WR2012 rainfall data to near-real-time is a critical step in implementing the Pitman-WR2012 model in seasonal hydrological forecasting mode and operational or skill evaluation of the forecasts. Therefore, the CHIRPS dataset was chosen to update the WR2012 to near-real-time for the purposes of this study. The statement of adequacy of CHIRPS rainfall data as input into hydrological models applies to the Kraai River catchment only. It was indicated by Funk et al. (2015) that the CHIRPS rainfall data can be used to support effective hydrological forecasts. Tou et al. (2016) also used the CHIRPS rainfall data as input into the SWAT model and the streamflow results were satisfactory. However, the use of CHIRPS rainfall data as input into a hydrological model must be done with caution, as this data might not be accurate in some regions. For example, Maswanganye (2018) found that CHIRPS tends to overestimate rainfall along the west coast of South Africa's Western Cape Province and underestimate rainfall in the eastern part of the province.
Therefore, hydrological modelling is the first important step for an operational hydrological forecasting system. In this study the Pitman-WR2012 model was selected for the primary reason that it is the commonly used model in Southern Africa for water resource management and runoff simulations.
The nature of the Pitman-WR2012 model required developing a specific framework for this application. That main aspects of this framework are:
• Historical rainfall data as input to run the model and this data must be updated to near-real-time as the WR2012 data
ends in 2009
• Downscaled forecasts are used to force the model to run with seasonal climate forecast ahead of time when the climate forecast was issued
• The model run generates forecasted streamflow and other hydrological variables that contribute to hydrological forecast
• In the retrospective forecast setting, the above are repeated for the entire period for which forecast data are available, and individual forecasts are compared to simulated streamflow; this comparison enables calculation of forecast skill measures
Skill of seasonal hydrological forecasts
The produced seasonal hydrological forecasts were verified using two forecast verification methods for probabilistic categorical forecast, i.e., for the forecast of probabilities of above-normal, below-normal and normal conditions. These methods are as follows: RPSS and ROC methods for probabilistic forecast verification. The skill of the forecast is not consistent across different measures of skill, which is not unexpected, as they measure various aspects of the forecast quality. For example, the ROC skill score method measures the ability of the forecast to discriminate between two alternative outcomes. However, the RPSS method measures the improvement of the multi-category probabilistic forecast relative to a reference forecast. This method takes climatological frequency into account.
In general, however, both the RPSS and the ROC method showed that the seasonal hydrological forecast is generally more skillful than the rainfall forecasts used in this study. The best skill is achieved for December, is weaker for January and then skill increases for February. Also, the skill is better for above- and below-normal conditions than for normal conditions.
The finding that the skill of the hydrological forecast is better than that of rainfall forecast is of profound importance. This illustrates that the hydrological forecast, as implemented in the framework, improves on the skill ofthe seasonal rainfall forecast. This is in fact surprising because hydrological forecast involves a hydrological model that has an inherent model error, and as a result one would expect reduction of skill of simulations. However, this effect of improvement in skill is likely to be caused by the initial condition of the hydrological model.
CONCLUSION
The aim of the study was to illustrate a framework for implementation of the Pitman-WR2012 model in the operational and retrospective seasonal forecast mode. Therefore, it is important that the data required for the model to be extended to near-real-time. Hence, the CHIRPS data were used to extend the WR2012 data to near-real-time and the CHIRPS data is useful in the Kraai River catchment. The reasons for choosing the CHIRPS data for this study is that the data is free and readily available for use and avoids the bureaucracy of obtaining data from SAWS and other sources of rainfall in South Africa with many missing values. A detailed analysis that compares the two (SAWS and CHIRPS) candidate datasets will be presented in a future work. However, it must be noted that CHIRPS data must be used with caution as input data in hydrological practices such as hydrological modelling and forecasting.
It can also be concluded that the Pitman-WR2012 model can perform realistically when implemented in seasonal hydrological forecasts mode through forcing the model with seasonal climate forecast (MOS-downscaled CFSv2) for the Kraai River catchment for different selected states of DJF season, i.e, wet, dry and average years of the observed streamflow. This is also supported by the considerably improved skill of the streamflow forecast, even though it is not perfect, compared to that of the rainfall forecast, which is generally low. The improvement of the skill between rainfall forecast and streamflow might arise from the initial condition. Therefore, the Pitman-WR2012 model can be used for seasonal hydrological forecasting for both operational and retrospective forecasting in South Africa.
It has to be highlighted that this study, by its nature and context, is not an exhaustive, comprehensive study of seasonal hydrological forecasting, and the forecast it is based on is not directly applicable to water resource management in the studied catchment. Rather, this study has to be treated as a 'proof-of-concept' for the framework for implementation of the Pitman-WR2012 model in seasonal hydrological forecasting. The main limitations of the study that prevent it from being operationalized are as follows:
• Only one climate forecasting system is used (CFSv2), while it is known that better forecast quality can be obtained from an ensemble of forecasting systems, as for example presented in the https://cip.csag.uct.ac.za/forecast page.
• Results in terms of forecast skill are specific to the studied catchment and analysed forecast, and skill of forecast in any other catchment has to be investigated separately.
This study was focused on a tertiary catchment with a low level of development of water resources, low level of transformation of land cover, and relatively simple hydrology. Seasonal hydrological forecasting testing should be done in larger catchments with complex hydrological systems, and catchments with high abstraction of water from the stream and groundwater abstraction. It is recommended that the forecast should also be produced for other seasons to see if the skill of the forecast will improve from the skill for the summer season (DJF).
ACKNOWLEDGEMENTS
The financial assistance of the Department of Science and Technology (DST), through a National Research Foundation (NRF) scholarship, towards this research is hereby acknowledged.
A special word of thanks goes out to the data providers such as the Department of Water and Sanitation, for streamflow data, the online Water Resource Study 2012 (Dr Allan Bailey) for assistance in the Pitman Model, South African Weather Service (SAWS) for the rainfall data, Water Research Commission Projects K5-2436 and K5-2746 and Climate System Analysis Group (CSAG) for CHIRPS data and downscaled climate (rainfall) forecasts.
ORCIDS
Sesethu Fikileni: https://orcid.org/0000-0002-8371-7044
Piotr Wolski: https://orcid.org/0000-0002-6120-6593
REFERENCES
AMNATSAN S, YOSHIKAWA S and KANAE S (2018) Improved forecasting of extreme monthly reservoir inflow using an analogue-based forecasting method: a case study ofthe Sirikit Dam in Thailand. Water. 10 (11) 1614 1-22. https://doi.org/10.3390/w10111614 [ Links ]
BAILEY AK and PITMAN WV (2015) Water Resources of South Africa 2012 study (WR2012). WR2012 Study User's Guide. Version 1. WRC Report No. K5/2143/1. Water Research Commission, Pretoria. [ Links ]
BAILEY A (2008) Water resources simulation model for Windows, Theory Document PWMA 04/000/00/6107. DWAF, WRC, SSI. WRC Report No. K5/2143/1. Water Research Commission, Pretoria. [ Links ]
BERAKI AF, LANDMAN WA, DEWITT DG, OLIVIER C, MATHOLE K and NDARANA T (2013) Modelled sea-surface temperature scenario considerations and Southern African seasonal rainfall and temperature predictability. WRC Report No. 1913/1/12. Water Research Commission, Pretoria. [ Links ]
BUTTS M, JENSEN R, LARSEN J, MUELLER H, RICHAUD B, LARSEN P, BARRERA MÁC, DRAW B and LASARTE AE (2017) Seasonal forecasting of reservoir inflows and their uncertainties. Proceedings of the 37th IAHR World Congress, 13-18 August 2017, Kuala Lumpur, Malaysia. [ Links ]
CHIEW FHS, ZHOU SL and MCMAHON TA (2003) Use of seasonal streamflow forecasts in water resources management. J. Hydrol. 270 (1-2) 135-144. https://doi.org/10.1016/S0022-1694(02)00292-5 [ Links ]
CHISADZA B, MUSHUNJE A, NHUNDU K and PHIRI EE (2020) Opportunities and challenges for seasonal climate forecasts to more effectively assist smallholder farming decisions. S. Afr. J. Sci. 116 (1/2) 1-5. https://doi.org/10.17159/sajs.2020/4649 [ Links ]
DAVIS-REDDY CL and VINCENT K (2017) Climate Risk and Vulnerability: A Handbook for Southern Africa (2nd edn). CSIR, Pretoria. URL: http://hdl.handle.net/10204/10066 [ Links ]
DE WIT J, BOTAI CM, BOTAI J and LETSHWITI K (2019) Towards implementing a mesoscale hydrological model at SAWS: Initial results. Proceedings of the 35th annual South Africa Society for Atmospheric Sciences (SASAS) Conference, 8-9 October 2019, Vanderbijlpark. [ Links ]
DOBLAS-REYES FJ, GARCÍA-SERRANO J, LIENERT F, BIESCAS AP and RODRIGUES LRL (2013) Seasonal climate predictability and forecasting: status and prospects. WIREs Clim Change. 4 245-268. https://doi.org/10.1002/wcc.217 [ Links ]
DOBLAS-REYES FJ, WEISHEIMER A, D'EQU'E M, KEENLYSIDE N, MCVEAN M, MURPHY JM, ROGEL P, SMITH D and PALMER TN (2009) Addressing model uncertainty in seasonal and annual dynamical ensemble forecasts. Q. J. R. Meteorol. Soc. 135 1538-1559. https://doi.org/10.1002/qj.464 [ Links ]
ENGELBRECHT CJ, LANDMAN, WA, GRAHAM R and MCLEAN P (2017) The seasonal predictive skill of intra-seasonal synoptic type variability over the Cape south coast of South Africa by making use of the Met Office Global Seasonal Forecast System 5. Int. J. Climatol. 37 (4) 1998-2012 https://doi.org/10.1002/joc.4830 [ Links ]
ETTER S, STROBL B, SEIBERT J and VAN MEERVELD HJI (2018) Value of uncertain streamflow observations for hydrological modelling, Hydrol. Earth Syst. Sci. 22 5243-5257. https://doi.org/10.5194/hess-22-5243-2018 [ Links ]
FUNK C, PETERSON P, LANDSFELD M, PEDREROS D, VERDIN J, SHUKLA S, HUSAK G, ROWLAND J, HARRISON L and HOELL A (2015) The climate hazards infrared precipitation with stations -a new environmental record for monitoring extremes. Sci. Data. 2 150066. https://doi.org/10.1038/sdata.2015.66 [ Links ]
GIVATI A, HOUSH M, LEVI Y, PAZ D, CARMONA I and BECKER E (2017) The advantage of using International Multimodel Ensemble for seasonal precipitation forecast over Israel. Adv. Meteorol. 2017 1-11. https://doi.org/10.1155/2017/9204081 [ Links ]
HAMLET AF, HUPPERT D and LETTENMAIER DP (2002) Economic value of long-lead streamflow forecasts for the Columbia River hydropower. J. Water Resour. Plann. Manage. 128 (2) 91-101. https://doi.org/10.1061/(ASCE)0733-9496(2002)128:2(91) [ Links ]
JOHNSTON PA, ARCHER ERM, VOGEL CH, BEZUIDENHOUT CN, TENNANT WJ and KUSCHKE R (2004) Review of seasonal forecasting in South Africa: producer to end user. Clim. Res. 28 6782. https://doi.org/10.3354/cr028067 [ Links ]
KGAKATSI IB and RAUTENBACH CJ deW (2014) The contribution of seasonal climate forecasts to the management of agricultural disaster-risk in South Africa. Int. J. Disaster Risk Reduct. 8 100-113. https://doi.org/10.1016/j.ijdrr.2014.01.002 [ Links ]
KHARIN VV and ZWIERS FW (2003) Improved seasonal probability forecasts. J. Clim. 16 (11) 1684-1701. https://doi.org/10.1175/1520-0442(2003)016<1684:ISPF>2.0.CO;2 [ Links ]
KIM Y, RATNAM JV, DOI T, MORIOKA Y, BEHERA S, TSUZUKI A, MINAKAWA N, SWEIJD N, KRUGER P, MAHARAJ R, IMAI CC, SHENG NG CF, CHUNG Y and HASHIZUME M (2019) Malaria predictions based on seasonal climate forecasts in South Africa: A time series distributed lag nonlinear model. Sci. Rep. 9 (17882) 1-10. https://doi.org/10.1038/s41598-019-53838-3 [ Links ]
KLOPPER E, VOGEL CH and LANDMAN WA (2006) Seasonal climate forecasts - potential agricultural-risk management tools? Clim. Change. 76 (1) 73-90. https://doi.org/10.1007/s10584-005-9019-9 [ Links ]
LANDMAN WA (2014) How the International Research Institute for Climate and Society has contributed towards seasonal climate forecast modelling and operations in South Africa. Earth Perspect. 1 (22) 1-13. https://doi.org/10.1186/2194-6434-1-22 [ Links ]
LANDMAN WA, DEWITT D, LEE DE, BERAKI A and LÖTTER D (2012) Seasonal rainfall prediction skill over South Africa: one-versus two-tiered forecasting systems. Weather Forecasting. 27 (2) 489-501. https://doi.org/10.1175/WAF-D-11-00078.1 [ Links ]
LANDMAN WA and BERAKI A (2012) Multi-model forecast skill for mid-summer rainfall over southern Africa. Int. J. Climatol. 32 (2) 303-314. https://doi.org/10.1002/joc.2273 [ Links ]
LANDMAN WA, DEWITT D and BERAKI A (2011) The highresolution global SST forecast set of the CSIR. Proceedings of the 27th Annual Conference of the South African Society for Atmospheric Sciences, 22-23 September 2011, Hartbeespoort. ISBN 978-0-62050849-0. [ Links ]
LANDMAN WA and GODDARD L (2002) Statistical recalibration of GCM forecasts over Southern Africa using Model Output Statistics. J. Clim. 15 2038-2055. https://doi.org/10.1175/1520-0442(2002)015<2038:SROGFO>2.0.CO;2 [ Links ]
LANDMAN WA, MASON SJ, TYSON P and TENNANT WJ (2001) Retroactive skill of multi-tiered forecasts of summer rainfall over southern Africa. Int. J. Climatol. 21 (1) 1-19. https://doi.org/10.1002/joc.592 [ Links ]
LANDMAN WA, MASON SJ, TYSON P and TENNANT WJ (2001) Statistical downscaling of GCM simulations to stream flow. J. Hydrol. 252 (1-4) 221-236. https://doi.org/10.1016/S0022-1694(01)00457-7 [ Links ]
LIU L, XIAO C, DU L, ZHANG P and WANG G (2019) Extended-range runoff forecasting using a one-way coupled climate-hydrological model: Case studies of the Yiluo and Beijiang Rivers in China. Water. 11 (6) 1-12. https://doi.org/10.3390/w11061150 [ Links ]
MALHERBE J, LANDMAN WA, OLIVIER C, SAKUMA H and LUO JJ (2014) Seasonal forecasts of the SINTEX-F coupled model applied to maize yield and streamflow estimates over north-eastern South Africa. Meteorol. Appl. 21 733-742. https://doi.org/10.1002/met.1402 [ Links ]
MASWANGANYE SE (2018) A comparison of remotely sensed precipitation estimates with observed data from rain gauges in the Western Cape, South Africa. Master's thesis, University of the Western Cape. http://etd.uwc.ac.za/ [ Links ]
MILLNER A (2009) What is the true value of forecasts? Weather Clim. Soc. 1 22-37. https://doi.org/10.1175/2009WCAS100L1 [ Links ]
PAGANO T, HARTMANN H and SOROOSHIAN S (2001) Using climate forecasts for water management: Arizona and the 1997-1998 El Niño. J. Am. Water Resour. Assoc. 37 (5) 1139-1153. https://doi.org/10.1111/j.1752-1688.2001.tb03628.x [ Links ]
PAGANO TC, GAREN DC and SOROOSHIAN S (2004) Evaluation of official western U.S. seasonal water supply outlooks, 19222002. J. Hydrometeorol. 5 896-909. https://doi.org/10.1175/1525-7541(2004)005<0896:EOOWUS>2.0.CO;2 [ Links ]
PITMAN VW (2011) Overview of water resource assessment in South Africa: current state and future challenges. Water SA. 37 (5) 659664. https://doi.org/10.4314/wsa.v37i5.3 [ Links ]
SAHA S, MOORTHI S, WU X, WANG J, NADIGA S, TRIPP P, BEHRINGER D, HOU YT, CHUANG H, IREDELL M, EK M, MENG J, YANG R, MENDEZ MP, VAN DEN DOOL H, ZHANG Q, WANG W, CHEN M and BECKER E (2014) The NCEP Climate Forecast System Version 2. J. Clim. 27 2185-2208. https://doi.org/10.1175/JCLI-D-12-00823.1 [ Links ]
SEAGO CJ (2016) A Comparison of the South African approach to water resource management and planning with four international countries. WRC Project No. K8/1078 WRC Report No. KV 341/15. Water Research Commission, Pretoria. [ Links ]
SHAMIR E (2017) The value and skill of seasonal forecasts for water resources management in the Upper Santa Cruz River basin, southern Arizona. J. Arid Environ. 137 35-45. https://doi.org/10.1016/j.jaridenv.2016.10.011 [ Links ]
STEINSCHNEIDER S and BROWN C (2012) Dynamic reservoir management with real options risk hedging as a robust adaptation to nonstationary climate. Water Resour.Res. 48 (5):5524 http://dx.doi.org/10.1029/2011WR011540 [ Links ]
TUO Y, DUAN Z, DISSE M and CHIOGNA G (2016) Evaluation of precipitation input for SWAT modeling in Alpine catchment. A case study in the Adige river basin. Sci. Total. Environ. 573 66-82. https://doi.org/10.1016/j.scitotenv.2016.08.034 , [ Links ]
WILKS DS (2011) Statistical Methods in the Atmospheric Sciences (3rd edn). Academic Press, Amsterdam. https://doi.org/10.1016/B978-0-12-385022-5.00001-4 [ Links ]
WINSENIUS HC, DURTA E, ENGELBRECHT FA, VAN GARDESEN EA, WETTERHALL F, PAPPENBERGER F and WERNER MGF (2014) The potential value of seasonal forecasts in a changing climate in southern Africa. Hydrol. Earth. Syst. Sci. 18 (4) 1525-1538. https://doi.org/10.5194/hess-18-1525-2014. [ Links ]
WHATELEY S (2012) Hydrologic forecasts and adaptation to climate change in the Northeast water sector. Unpublished MSc dissertation, University of Massachusetts Amherst [ Links ]
WOLSKI P, LENNARD C, JACK C and TADROSS M (2018) Seasonal hydrological forecasting- current state of play: Water Research Commission. The Water Wheel. 16 (5) 30-33. URL: https://hdl.handle.net/10520/EJC-ab1dc63e8 [ Links ]
WOLSKI P (2017) How severe is this drought, really? URL: http://www.csag.uct.ac.za/2017/08/28/how-severe-is-this-drought-really/ (Accessed 2019). [ Links ]
WOOD AW and LETTENMAIER DP (2006) A test bed for new seasonal hydrologic forecasting approaches in the Western United States. Bull. Am. Meteorol. Soc. 87 1699-1712. https://doi.org/10.1175/BAMS-87-12-1699 [ Links ]
YAO H and GEORGAKAKOS AP (2001) Assessment of Folsom Lake response to historical and potential future climate scenarios, 2. Reservoir management. J. Hydrol. 249 176-196. https://doi.org/10.1016/S0022-1694(01)00418-8 [ Links ]
YUAN X, WOOD EF and MA Z (2015) A review on climate-model-based seasonal hydrologic forecasting: physical understanding and system development. WIREs Water. 2 523-536. https://doi.org/10.1002/wat2.1088 [ Links ]
ZIERVOGEL G, JOHNSTON P, MATTHEW M and MUKHEIBIR P (2010) Using climate information for supporting climate change adaptation in water resource management in South Africa. Clim. Change. 103 (3-4) 537-544. https://doi.org/10.1007/s10584-009-9771-3 [ Links ]
 Correspondence:
Sesethu Fikileni
Email: 3142270@myuwc.ac.za
Received: 15 March 2021
Accepted: 12 January 2022

