


Services on Demand
Article
 English (pdf)
 Article in xml format
 Article references
Indicators

Related links
-
 Cited by Google
 -
 Similars in Google
Share

 Permalink
Water SA
On-line version ISSN 1816-7950
Print version ISSN 0378-4738
Water SA vol.48 n.1 Pretoria Jan. 2022
http://dx.doi.org/10.17159/wsa/2022.v48.i1.3322
RESEARCH PAPER
Integration of complete elemental mass-balanced stoichiometry and aqueousphase chemistry for bioprocess modelling of liquid and solid waste treatment systems -Part 4: Aligning the modelled and measured aqueous phases
GA EkamaI; CJ BrouckaertII; BM BrouckaertII
IWater Research Group, Department of Civil Engineering, University of Cape Town, Rondebosch 7700, Cape Town, South Africa
IIWater, Sanitation and Health Research and Development Centre, School of Chemical Engineering, University of KwaZulu-Natal, Durban, South Africa
ABSTRACT
Completely mass-balanced biological, physical and chemical process stoichiometry ensures that the CHONPS material and charge content entering and exiting bioprocess system models is conserved, which is a requirement for pH prediction in integrated physical, chemical and biological process models. Bioprocesses transform the material content from reactants to products, exchanging material between the aqueous, gaseous and solid phases, which cause pH changes in the aqueous phase. By measuring the material content of the aqueous phase, the progress of bioprocesses can be monitored. Alkalinity is an important aqueous-phase property that can be used to track aqueous-phase changes caused by physical, chemical and biological processes. Alkalinity is a stoichiometry property of the components in solution (i.e., a linear function of the amounts present). Its uptake from, and release to, the aqueous phase can both be modelled with bioprocess stoichiometry, and measured in physical bioprocess systems, and so aid in linking the modelled and measured aqueous-phase compositions. Changes in the concentrations of components containing the elements C, H, O, N, P and S result in changes in six weak acid/bases systems in the aqueous phase, all of which affect the total alkalinity. These are: inorganic carbon (IC), ortho-phosphate (OP), free and saline ammonia (FSA), volatile fatty acids (VFA), free and saline sulphide (FSS) and the water itself. Characterization of the aqueous phase to quantify the material content of the aqueous phase containing these six weak acid/base systems using the 5-point titration method is described. While several alkalinity titration based methods are available for anaerobic digestion bioprocess monitoring, only the 5-point titration is sufficiently accurate for aqueous-phase characterization to quantify the aqueous-material content for pH prediction in bioprocess models.
Keywords: aquatic chemistry, alkalinity, bioprocess modelling, measurement, stoichiometry, wastewater treatment, 5-point titration
INTRODUCTION
In Part 3 (Ekama and Brouckaert, 2022) of this series, the alignment of the modelling and measurement frameworks for biochemical processes was discussed in terms of element balances and model components. Components are model constructs that represent material content in the system, but not necessarily the physical forms which the material takes in the system, which is, in turn, represented by species. As pointed out in Part 1 (Brouckaert et al., 2021a), the rate at which biochemical transformations occur typically depends on the species present, both in terms of the availability of reactant species and the presence of inhibitory species. For example, acetogenic methanogenesis (Bioprocess 1 in Table 1 of Part 2 - Brouckaert et al., 2021b) in anaerobic digestion is highly sensitive to pH, which is in turn dependent on all the dissolved aqueous species present in the aqueous phase. Note that in this series of papers, species are italicised (e.g. CO32-), while their corresponding components are not (e.g. CO32-).
This paper, Part 4, discusses the measurements needed to characterize the aqueous phase for modelling purposes, and how to interpret these measurements in terms of components and species. Central to the discussion is the measurement of alkalinity, which was introduced from a modelling perspective in Part 1 (Brouckaert et al., 2021a).
As discussed in Part 1, speciation modelling, which determines dissolved species concentrations from component concentrations, is very well established. Speciation algorithms are discussed in Part 5 (Brouckaert et al., 2022).
In broad conceptual terms, the problem to be addressed is that the composition of a solution is best expressed in terms of components for modelling purposes, but not all available measurements are directly related to components. Specifically, pH and electrical conductivity (which can be used to infer ionic strength) are related to the composition in terms of species. The speciated composition is completely determined by the component composition; however, to translate component concentrations into species concentrations requires a speciation model. The same speciation model can therefore be used to map a combination of component-related and species-related measurements into a complete specification of the composition, which includes all the component concentrations and all the species concentrations.
The weak acid/base system components are CO32-, NH4+, PO43-, HS- and Ac- (CH3COO-). (The interactions of other VFAs are so similar to acetate that they cannot be distinguished by titration.) The corresponding measurements are IC, FSA, OrthoP, FSS and VFA. Total hydrogen ions cannot be measured directly. OrthoP and FSA are standard measurements at treatment plants. FSS measurements are less common, but can be obtained using standard titrimetric methods. Direct measurement of VFA requires gas chromatography (GC), while direct IC measurement also requires an expensive inorganic carbon analyser, with which it is difficult to prevent errors due to CO2 loss. In practice, alkalinity measurements, along with pH, can be used in combination with other analytic measurements to characterise the weak acid/base content of the aqueous phase fully.
Alkalinity
Alkalinity has the following useful characteristics:
• It is easy to measure.
• It is a summary property that is a linear function of all the weak acid/base components present. It can also be simply expressed as a linear function of the weak acid/base component concentrations (Eqs 19a and 19b in Part 1 -Brouckaert et al., 2021a).
• As discussed in Parts 1 and 2, the changes in aqueous-phase alkalinity as a specific reaction proceeds can be calculated directly from the reaction stoichiometry. Alkalinity measurements can therefore be used to link the modelling and measurement frameworks at specific points in time, as well as to track changes in the aqueous phase over time.
• Since alkalinity is also related to pH buffer capacity, it has direct application as a control parameter for pH-sensitive processes such as anaerobic digestion.
Bioprocesses change the protonated states of aqueous species
The energy change resulting from e- transfer between the e- donor and e- acceptor drives the bioprocess. The changes in e- donating capacity (EDC) of bioprocess reactants and products also result in changes in the number of protons associated with some of the components, which affects the speciation of the aqueous phase and hence the pH. For example, in autotrophic denitrification (Bioprocess 5a in Table 1 of Part 2 - Brouckaert et al., 2021b), sulphide is the e- donor, and is transformed to sulphate; and nitrate is the e- acceptor, and is transformed to nitrogen gas. Sulphate and nitrate are strong acids, and so are almost completely dissociated in the aqueous phase - almost all are in the un-protonated NO3 or SO42-form. The free (H2S) and saline (HS-, S2-) sulphide (FSS) and free (NH3) and saline (NH4+) ammonia (FSA) are weak acid/ bases and so are partially dissociated. Hence, fully protonated (NH4+, H2S) and partially protonated (HS-, S2-, NH3) forms coexist in the aqueous phase. Because each of these species has a different protonated state, bioprocesses such as sulphate reduction (sulphate to sulphide), nitrification (ammonia to nitrate) and autotrophic denitrification (sulphide to sulphate and nitrate to nitrogen gas), cause a change in the aqueous H+ concentration and hence pH. In integrated biological, chemical and physical process modelling, these changes in H+ concentration are tracked, so that pH can be calculated.
Aqueous-phase concentrations have a non-linear effect on speciation and pH
To predict pH within bioprocess models, completely element-balanced stoichiometry is necessary. This requires modelling both the bioprocesses and the speciation of the aqueous phase in which they take place. Bioprocess kinetics are generally dependent on the concentration of the biomass that mediates the bioprocess - doubling the biomass concentrations approximately doubles the reaction rates. A reaction rate is largely dependent on the concentrations of just those species that take part in the specific reaction, whereas equilibrium reactions are affected, to a greater or lesser extent, by all species present in the solution. Thus, how a reaction affects something like pH depends on the whole solution composition, not just the species taking part in that reaction. Therefore, not only do the bioprocesses themselves affect the pH, but the bulk liquid concentrations at which they take place also affect the aqueous-phase speciation, and hence pH.
Aqueous-phase equilibrium reactions are modelled with algebraic equations
The relative concentrations of the different protonated states of the species of a weak acid/base are determined by the dissociation equilibrium constant(s) (Kd) of the weak acid/base. Because the dissociation and association rates are extremely fast, they reach equilibrium virtually instantaneously relative to the bioprocess rates. Equilibrium states are determined by reaction equilibrium constants (Kd), rather than reaction rates. Two advantages arise: (i) equilibrium reactions seldom require calibration, because equilibrium constant values are well known (unlike the bioprocesses, which are usually held in a non-equilibrium state by kinetic factors which require calibration for different reactor conditions), and (ii) they can be represented by a set of algebraic equations. This avoids combining very fast aqueous speciation reactions with the much slower bioprocess and physico-chemical process reactions (gas stripping and mineral precipitation), which leads to greater numerical stability and shorter simulation times for the integrated biological, chemical and physical process models (Batstone et al., 2002; Brouckaert et al., 2010; Ikumi et al., 2011; Lizarralde et al., 2015; Part 5 - Brouckaert et al., 2022).
Measuring and modelling the aqueous-phases concentrations
Bioprocesses change the organic and inorganic component concentrations representing the material content entering a bioprocess system from one form (reactants) to another (products) without changing the material content leaving the system in the solid, aqueous or gaseous phases. This means that, if the correct measurements can be made to quantify the material entering and leaving the system, the progress and performance of the bioprocess(es) can be monitored. In Part 3 (Ekama and Brouckaert, 2022) this flux/mass balance principle was applied to characterise the influent electron (e-) donor organics and biomass. In this paper, the characterisation of the aqueous phase through measuring the material content entering and exiting bioprocesses, and inferring solution composition in terms of model components, is considered.
LINKING THE MODELLING AND MEASUREMENT FRAMEWORKS
To predict pH correctly, the entire ionic composition in which the bioprocesses take place needs to be established. This is because the ionic strength, often estimated from electrical conductivity (EC) or total dissolved solids (TDS), affects the speciation of the aqueous phase. To measure and model all the ions in the aqueous phase of biological treatment systems is neither practically feasible nor computationally efficient. Therefore, the ions that have the greatest impact on the speciation of the aqueous phase and pH are selected for modelling (Part 1 - Brouckaert et al., 2021a,) and require measurement. These are the ions of (i) the weak acid/bases that change as a result of the reactions of the bioprocesses, (ii) the minerals that can precipitate or dissolve, and (iii) the ion-pairs that can form to significant extents. The ionic strength resulting from the selected (or modelled), and therefore measured, ions is usually lower than the ionic strength calculated from measured concentrations. To make up the ionic strength deficit, Na+ and Cl- can be added to the modelled aqueous-phase composition to represent the unmeasured ions in the solution. Na+ and Cl- are usually present and have particularly weak interactions with other ions, so normally do not need to be accurately reflected in the model. Details of the component selection is outlined in Part 5 (Brouckaert et al., 2022). The measurement of the weak acid/bases, in particular the inorganic carbon (IC) system via the H2CO3alkalinity, aligned with determining the material content of the aqueous phase and the calculation procedure for converting the measured aqueous concentrations to model components, are considered below.
CHARACTERIZING THE AQUEOUS PHASE: MEASUREMENT OF ALKALINITY IN MIXED WEAK ACID/BASE ENVIRONMENTS
As mentioned in Part 1 (Brouckaert et al., 2021a), alkalinity is the remaining capacity of weak acid anions in a solution to bind protons, and is measured by titration with a strong acid. Where there are number of weak acids, it is possible to divide the overall solution alkalinity into contributions from each weak acid/base system, which we term the speciated alkalinities. Thus, we will refer to carbonate alkalinity (H2CO3 alk), phosphate alkalinity (H2PO4- alk), sulphide alkalinity (H2S alk), etc. Note that H2CO3, H2PO4~ H2S are the reference species of their respective systems, as discussed in Part 1 (Brouckaert et al., 2021a). Although the speciated alkalinities sum to the total alkalinity, which is a linear function of component concentrations, they are complex nonlinear functions of the solution pH, and cannot be easily related to measurements without a speciation model of the solution. This means that they have limited practical application in solution models, although they can be useful concepts for explaining solution phenomena (as in the following sections).
Characterizing mixed weak acid/base samples
In aqueous samples with a mixture of n (say 6) weak acid/bases (including water), n (6) measurements are required to characterize it, one for each weak acid/base system, including the water itself. Characterization here means to quantify all individual component concentrations of all the weak acid/base systems. So in a water sample with a mixture of six weak acid/bases, viz.
(i) IC, (ii) FSA, (iii) OP, (iv) FSS, (v) VFA (represented as acetic acid HAc) and (vi) the water itself, at least six measurements are required to characterize it. These six measurements could be (i) the pH and the total concentrations of the (ii) FSA (NT), (iii) OP (PT), (iv) FSS (ST), (v) VFA (AT) and (vi) IC (CT). As discussed in the introduction, direct measurements of inorganic carbon (IC) and VFA are not available in many wastewater laboratories, and direct measurement of H+ is not possible at all. However, it is possible to change the H+ concentration by a known amount by adding a strong acid or strong base. Titration can therefore be used, together with some form of speciation model, to infer the unmeasured concentrations. This is an unusually complex version of the 'standard addition method', used in analytic chemistry to compensate for matrix effects that influence the measurement of concentration. The response of the measurement to the addition of known amounts of the substance in question provides information for establishing its concentration in the original sample. The usual case is that there is a single substance of interest, the measurement response is assumed linear, and no specific information about the matrix is sought. In the titration methods described here, the response is decidedly non-linear, and some form of speciation model is required to interpret it. The availability of detailed and accurate models of solution behaviour also make it possible to infer the concentrations of substances other than H+, in particular, carbonate and acetate.
There are three ways that titration with acid has been used to estimate the carbonate alkalinity, and hence the carbonate concentration (CT):
• Determining the total alkalinity from a single titration to a pH endpoint, which can be either a fixed value of 3.7, or to the point of minimum buffer capacity, which will deviate slightly from 3.7 depending on the solution composition. H2CO3 alk is then determined by subtracting the alkalinity contributions of other weak acid components, which have to be analysed separately (including VFA).
• A two-point titration with pH end-points 5.75 and 4.3, to measure the partial alkalinity (PA) and total alkalinity (TA). This provides approximate values of the CT and VFA concentrations; other weak acid concentrations have to be analysed separately.
• The 5-point titration that provides more accurate values for the CTand VFA concentrations; the other weak acid components still have to be analysed independently.
The following sections describe and compare these three procedures, using the solution specified in Table 1 as an example.
Speciated alkalinity and buffer capacity vs. pH curves for the solution in Table 1 appear in Figs 1, 2a and 2b. The loss of volatile components during the preparation of the sample for titration is an inevitable complication. Its effect on the alkalinities is shown in Fig. 1.


Figures 2a and b represent the subsequent titration. The right-hand axis of Fig. 2a gives the H+ added, showing how alkalinity is directly related to H+. The units customarily applied to alkalinity (mg/L as CaCO3) can be misleading, since alkalinity is not necessarily related to CaCO3, or even to CO32-; however, it is always related negatively to H+. The pH end-points for the various titration methods are shown for reference.
Titrating to the minimum buffer capacity pH point
When the IC system is the only weak acid/base present in a water sample or the contribution of other weak acid/base systems is very small, as is the case in most natural waters (Stumm and Morgan, 1996), total alkalinity AlkT ~ Alkt ~ H2CO3 alk and can be determined by titrating to the H2CO3equivalent solution at pH of around 4.5. However, in mixed weak acid/base systems such as anaerobic digestate, the other weak acids/bases not only bind protons, contributing to the alkalinity, but also affect the end-point of the titration. This is illustrated in Figs 2a and 2b, which show that zero alkalinity and minimum buffer capacity (ßmin) occur at pH ~ 3.7.
Figure 3 shows that titration to the minimum ß at around pH 3.7 excludes the first pKp1 of the phosphate system. This is because, although H2PO4and HPO42-are weak acids, H3PO4is a strong acid. Its buffer capacity is masked by the buffer capacity of H2O for pH below 3. Therefore, while all the weak acid/bases have been titrated to their most protonated state at the pH of the minimum ß, the OP system has not. At the pH for minimum ß, the OP system is mostly in its H2PO4form; therefore, H2PO4is the appropriate reference species. Thus, the alkalinity obtained by titrating to the minimum ß at pH~3.7 is approximately the Alk, defined by Eq. 19b in Part 1 (Brouckaert et al., 2021a), i.e., the H2CO3/NH4+/HPO4-/H2S/HAc alkalinity.

With the H2CO3/NH4+/HPO4/H2S/HAc alkalinity (Alkt) determined by titrating to the minimum ß, the H2CO3alkalinity for the sample can be calculated by subtracting the subsystem alkalinities from Alk.,, i.e.:

where the subsystem alkalinities can be calculated from the sample 'in-situ' pH (7.00 in Table 1) and the measured total species concentrations of the FSA, OP, FSS and VFA weak acid/ base systems (Loewenthal et al., 1989, 1991).
The pH at the minimum ß in the alkalinity titration changes with H2CO3 alk (or CT), decreasing as CTincreases but, from a theoretical sensitivity analysis, the error in the H2CO3 alk due to this change is quite small (Moosbrugger et al., 1993). Fig. 4a shows the pH of the minimum ß versus theoretical H2CO3alk corresponding to solution compositions with the same PT, ST, AT and NT as the example AD liquor in Table 1 before gas loss but with varying CT. Fig. 4b shows the % error with respect to the theoretical H2CO3 alk of the measured H2CO3 alk, as determined by titration to the minimum ß, or titration to fixed pH of 3.7. From Fig. 4b, if the H2CO3 alk is more than 50% of the Alk the error in H2CO3 alk is less than 0.5% ((from Table 1, Alkt= 4 862 mg/L as CaCO3 and does not change if CTis added or removed as H2CO3).


Partial (PA) and total (TA) alkalinity titration
A titration method developed by Ripley et al. (1986) for control of ADs yields the partial (PA), intermediate (IA) and total (TA) alkalinities. A detailed review of alkalinity measurement in AD liquor is given by Moosbrugger et al. (1993a, b). The PA is obtained by titrating a sample from the in-situ pH to 5.75 and the TA was obtained by titrating further to 4.30. The PA and IA are proxies for the H2CO3 alkalinity and VFA concentrations, respectively, where IA = TA - PA. Ripley et al. (1986) used the IA/PA ratio, which has become known as the Ripley ratio, as an indication of approaching AD failure - a ratio > 0.30 means that the VFA concentration is too high relative to the H2CO3 alk concentration. The advantage of the PA and IA is that, aside from in-situ AD pH, no other measurements are required to assess that AD operating condition. However, the PA and IA are only approximate proxies for the actual H2CO3alk and VFA concentrations.
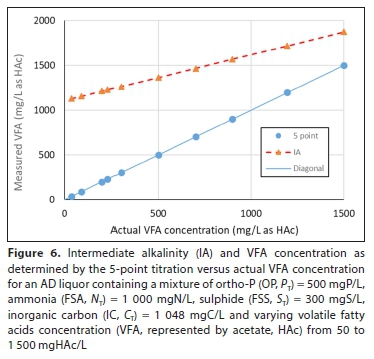
Figure 5 shows the PA versus the actual H2CO3 alk concentration from 50 to 4 400 mg/L as CaCO3 (CT from 140 to 1 250 mgC/L) with PT, ST, AT and NTas given in Table 1 (before gas loss), while Fig. 6 shows the IA versus the actual VFA concentration (Fig. 6) for fixed CT = 1 048 mgC/L and varying VFA from 50 to 1 500 mgHAc/L. Therefore, while the PA and IA are useful control parameters for AD, they cannot be used for characterizing the aqueous phase of mixed weak acid/base systems for modelling purposes. Modelling the AD system with pH prediction requires accurate characterization of the AD influent and liquor (effluent) aqueous phases.

THE 5-POINT TITRATION METHOD
The five-pH-point titration method of Moosbrugger et al. (1992, 1993a,b) (Lahav and Loewenthal, 2002; Lahav et al., 2002; Lahav and Morgan, 2004; Vannecke et al., 2015) is a better method, not only for control of ADs, but also for characterizing water samples with mixtures of weak acid/bases for aqueous-phase modelling and pH prediction purposes. This method can be applied to water samples containing the five (six counting water) weak acid/bases mentioned above (IC, FSA, OP, FSS, HAc, or [CO32-], [NH4+], PO33-], [HS-], [Ac-]) and requires component species concentrations for the FSA, OP and FSS ([NH4+], PO33-], [HS-]) to be known. It gives as output the H2CO3 alk (in mg/L as CaCO3) and the VFA concentration as HAc (in mgHAc/L). The five pH points of the titration are the sample 'in-situ' pH, two pH points centred around the pKc1(=6.3) of the IC system, i.e., pH = 6.3 + 0.4 = 6.7 and 6.3 - 0.4 = 5.9 and two pH points centred around the pKa (=4.8) of the HAc system, i.e., pH = 4.8 + 0.5 = 5.2 and 4.8 - 0.5 = 4.3 (see Fig. 2b). These four pH points do not have to be titrated to exactly - however, the cumulative volume added and the actual pH points reached for the volume added near to the four pH points have to recorded as accurately and precisely as possible and entered into the 5-point titration companion computer programs (available from https://washcentre.ukzn.ac.za/bio-process-models/). Also entered are the measured NT, PT and ST concentrations and temperature and electrical conductivity (EC, mS/m, in lieu of ionic strength, IS) for pK value correction. For the inputted data, the program searches for the best CTand AT concentrations to account for the measured buffer capacity represented by the volume of acid added from the 'in-situ' pH to the four pH points (Moosbrugger et al., 1993a,b).
5-point titration programmes
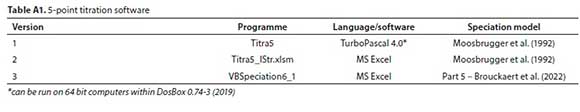
The 5-point titration method requires the measured data to be fitted to a speciation model, which includes all the relevant weak acid/base systems, in order to be able to extract the VFA and carbonate concentrations. Moosbrugger et al. (1992) developed the original algorithm. Equations for the differences in speciated composition at the titration points (see Fig. 2b) are solved simultaneously for the un-measured component concentrations, i.e. [CO32-], [Ac-], [H+] The equations are formulated in terms of speciated alkalinities, and use a simplified speciation model, which accounts for non-ideal activity coefficients, but not ion pairs. This allows an analytic solution to the equations. Because the original programme was written in Turbo-Pascal, which is no longer supported by modern computers, a number of other versions have been published that implement the same algorithm in different programming languages (see Appendix).
The above description does not exactly reflect the original approach of Moosbrugger et al. (1993a), but is a re-interpretation in terms of the concepts advanced in this series of papers: specifically, the distinction between components and species. The key concept linking components and species is provided by 'Duhem's theorem', discussed in Part 1 (Brouckaert et al., 2021a). Its implication is that a solution's composition in terms of species is completely specified by its composition in terms of components (together with temperature and pressure). A speciation routine, such as the one described in Part 5 (Brouckaert et al., 2022), simulates the effect of Duhem's theorem by calculating the species concentrations that correspond to the specified component concentrations. Having such a routine available suggests an alternative algorithm for solving the 5-point titration system that is conceptually (but not computationally) simpler. This involves setting up the compositions of initial solution and the titration points in terms of components (i.e. [PO33-], [NH4+], [HS-] plus estimates of [CO32-], [Ac-], [H+]), and using the speciation routine to calculate the corresponding pH values. The unknown component concentrations ([CO32-], [Ac-], [H+]) are then adjusted to obtain the closest fit to the measured pH values. This approach has been implemented in Microsoft Excel as VBSpeciation6_1.xlsm, with the speciation routine programmed as a spreadsheet function using Visual Basic, and the component adjustments effected using the Excel Solver (see Appendix). All the complex computations are hidden in the speciation function and the solver, leaving only the very straightforward material balance calculations to complete the application. This makes the program very flexible - for example, it is easy to add more titration points, or fit more unknown components (although any such extension should be subjected to an error analysis similar to the one described in the next sections). The speciation spreadsheet has many other uses beside the 5-point titration; for example, it was used to prepare Figs 1, 2a and 2b.
Errors in 5-point titration results
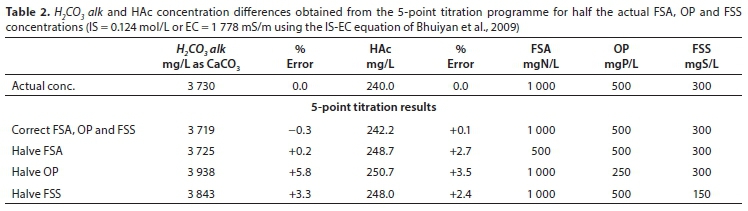
Any error in the NT, PTand STconcentrations entered into the 5-point titration programme will be assigned to the H2CO3 alk and HAc (AT) concentrations, resulting in errors in these concentrations (Poinapen et al., 2009). However, the relative impact of errors in NT, PTand STdepends on the solution conditions. If the pH of the AD liquor is <7.5, the alkalinity of the ammonia system is very low (see Table 1), and zero or an estimated concentration could be entered for FSA (NT) with low error in the H2CO3 alk and HAc concentrations. Also, if the FSS (ST) and OP (PT) concentrations are low, their contribution to the Alk, is low, and zeros or estimated concentrations could also be entered into the programme for these concentrations. For example, if in the case of the AD liquor in Table 1 before gas loss (pH = 7.0), half the actual FSA, OP and FSS concentrations were separately entered into the programme, then the maximum errors in the H2CO3alk and HAc concentrations are +5.8% and +3.5%, respectively (Table 2). This arises because in AD liquor, with the high partial pressure of CO2 in the AD head space, the H2CO3 alk makes up the greater part (>50%) of the Alkt.
The 5-point titration for AD control
Unlike the PA and TA titration method, the 5-point titration programme requires input values for NT, PTand ST, and errors in these values will result in errors in the calculated H2CO3 alk and HAc concentrations and the Ripley ratio. However, for AD control even quite large errors may be tolerable. Figures 5 and 6 show the 5-point titration is much more accurate for predicting the H2CO3 alk (Fig. 5) and especially HAc (Fig. 6) concentrations compared to the IA/TA method. Furthermore, Table 2 shows that relatively large errors (50%) in NT, PTor SThave a relatively small impact on the calculated H2CO3 alk and HAc concentrations (<6%) for low sulphide liquors. Therefore, for AD control, the 5-point titration requires no more effort than the PA and TA, and can be automated, provided that reasonable estimates of FSA, OP and FSS concentrations are entered into the programme.
The 5-point titration for aqueous-phase characterization
The 5-point titration is also a good method for aqueous-phase characterization for mass-balanced modelling purposes, and organic composition determination (Part 3 - Ekama and Brouckaert, 2022); however, in this case accurate determination of NT, PT and ST is essential. The aqueous OP and FSA usually are quite stable because transfer to gas or solid phases is negligible at the neutral pH of bio-systems - no P gas can form and the pH is too low for significant mineral precipitation and ammonia gas evolution. This is not the case for the sulphide - sulphide readily escapes to the gas phase at neutral pH. Entering inaccurate total sulphide species concentration into the 5-point titration programme results in inaccurate H2CO3alk (and hence CT) and HAc concentrations and hence incorrect characterization of the water sample (Poinapen et al., 2009).
The 5-point titration method for sample with pH < 6.7
If the AD sample has a pH below the pH of the first pH titration point <6.7, then an appropriate quantity of NaOH can be added to the sample to raise the pH, after which the 5-point titration is conducted as usual. Although the addition of the strong base increases the total alkalinity of the sample, it does not change the CT, AT, NT, PTand ST total species concentrations. Therefore, the same CT and AT results are obtained.
Effect of H2S and CO2 loss on 5-point titration results
Loss of CO2 and H2S from the sample do not change the Alk, (see Fig. 1). This can be explained by noting that they leave the solution in their reference forms, which contribute zero alkalinity, or by considering the evolution reactions, for which A Alktvalues are zero, i.e.
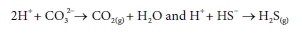
However, these reactions do cause the sample pH to increase due to the loss of acid species. In the case of a pure carbonate or sulphide system, the loss of CO2 or H2S from the original solution can be calculated from the change in pH. However, in a mixed system, from which both gases are escaping, one must be measured directly in order to calculate the other.
Poinapen et al. (2009) investigated the loss of sulphide from samples between collection and analysis and different methods to prevent it, and recommended the following: (i) measuring the in-situ pH, i.e. directly in the reactor (rather than in samples extracted from the reactor, from which gases can readily escape); and (ii) taking two samples from the reactor, one as is, the other collected with 2 drops of 1 N NaOH to immediately raise its pH above 11. This second sample can be filtered without loss of H2S (even using vacuum), and the FSS determined by difference between COD tests on samples with organics and FSS and organics only (sulphide removed by precipitation with ZnSO4 and filtration). The first sample is used for FSA and OP determination and for the 5-point titration. The FSA, OP, FSS obtained from the COD tests, and in-situ pH are used as inputs to the 5-point titration programme, as are the volumes of acid added to reach the four pH points. This procedure provided accurate H2CO3 alk and mixed weak acid/base speciation results, from which good C balances could be obtained over sulphidogenic systems fed primary sewage sludge; (see also the discussion of sulphidogenesis in Part 2 -Brouckaert et al., 2021b).
The 5-point titration has been demonstrated in several studies to be an accurate method for determining the H2CO3 alk and VFA concentrations in mixed weak acid/base samples (Lahav et al., 2002; Hey et al., 2013; Vannecke et al., 2015). It is convenient because it does not require the VFA (AT) total species concentration, which requires a gas chromatograph for its measurement. The 5-point titration is therefore a simple and useful test not only for monitoring ADs via the VFA/Alk ratio (Moosbrugger et al., 1993a,b) but also for characterizing the aqueous phase for complete mass modelling.
CALCULATION OF COMPONENT CONCENTRATIONS FOR MODEL INPUT
The characterization of the aqueous-phase composition in terms of components is required in order to be able to model and track changes in the aqueous phase due to bioprocesses. The measurements that are used in the 5-point titration methodology, pH and electrical conductivity, reflect species concentrations, which must be translated to the component concentrations required for modelling. This translation is essentially what the 5-point titration program does; however, the output of TITRA5.exe, the original Moosbrugger version, did not provide the component concentrations (although they figured in the internal calculations). This required a post-calculation to reconstruct the concentrations of H+ and the weak acid anions, using the speciation equations of Loewenthal et al. (1991), which are the same as used by TITRA5.exe. This is not an issue with subsequent implementations of the algorithm, which include these component concentrations in the output (see Appendix).
However, there are components that are considered implicitly, but not explicitly, by the algorithm, and a bioprocess model needs these as inputs also. The following section explains how these can be estimated.
Aligning modelled and measured ionic strength
To predict pH correctly, the entire ionic composition in which the bioprocesses take place needs to be established. This is because the ionic strength, a measure of the total concentration of charged species in solution, affects the speciation of the aqueous phase. The ionic strength is given by:

where Zjand Cjare the charge and concentrations in mol/kg of ionic species i.
To measure and model all the ions in the aqueous phase of biological treatment systems is neither practically feasible nor computationally efficient. Therefore, the ions that have the greatest impact on the speciation of the aqueous phase and pH are selected for modelling (Part 1 - Brouckaert et al., 2021a) and require measurement. These are the ions of (i) the weak acid/bases that change as a result of the reactions of the bioprocesses, i.e., the IC, VFA, OP, FSA and sulphide systems as well as H+, (ii) the ions involved in bioprocesses, especially nutrient removal, and mineral precipitation, which include Ca2+, Mg2+, K+, Fe3+, Fe2+, NO3-, NO2-and SO42-, and (iii) any ion-pairs that can form to significant extents such that they affect (i) and (ii). The sum of contributions of the selected (or modelled), and therefore measured, ions is typically lower than the total ionic strength which may include less important, unmeasured ionic species.
Furthermore, the total ionic strength of a wastewater sample cannot be measured directly and is calculated instead from measurements of either electrical conductivity (EC) or total dissolved solids (TDS). For example, the later versions of the 5-point titration program listed in the Appendix calculate ISmeas using the equation of Bhuiyan et al. (2009):

where ECT is the EC at T °C in mS/m and T = temperature in °C.
In real wastewaters, ISmeas calculated using Eq. 3 is usually significantly higher than IS calculated from Eq. 2 using available direct and indirect measurements of specific species. To make up the deficit in ionic strength (IS), Na+ and Cl- can be added as components in the speciation model, such that (i) the IS of the positively charged ions (IS+ve) and negatively charged ions (IS-ve) are equal and (ii) add up to the measured ISmeas obtained from the ECT (Eq. 3). Na+ and Cl- are typically used to represent the unmeasured ions in the aqueous phase because they are ubiquitous in aqueous environments, have particularly weak interactions with other ions and are not involved in the bioprocesses typically modelled, so normally do not need to be accurately reflected in the model.
Ionic strength is a function of all the charged species in solution while most of the available measurements, e.g., CT, NT, PT, ST, and AT, represent total component concentrations (discussed in Part 1 - Brouckaert et al., 2021a); therefore a speciation model is required to relate the available measurements to the total ionic strength.
To determine all the measured species concentrations requires the pH, the total species concentrations (CT, NT, PT, ST, and AT in mol/kg), and the dissociation constants corrected for ionic strength (pK'. The activity coefficients (ym, yd, yt for monovalent, divalent and trivalent ions respectively) used for pK correction are calculated using the Davies equation with ISmeas (Eq. 3) and temperature (T°C) (Loewenthal et al., 1989). The IS+ve is the ionic strength contribution of all the cationic species, such as Ca2+, Mg1*, K+, NH4+ and H+ (where [H+] = 10-pH/ym), and IS-ve is the ionic strength contribution of all the anions, such as HCOf and HPO4-.
Hence, IS+ve and IS-ve are calculated from:

where m and n are the number of measured cations and anions, respectively, and Ziand Ciand Z¡ and Cj the charge and concentrations in mol/kg of the cation i and anion j.
With IS+ve and IS-ve known, the concentrations of Na+ and Cl- in mol/L to be included in the aqueous phase to achieve the ISmeas are obtained from:

CONCLUSIONS
To predict pH with bioprocess models requires (i) complete integration of biological, chemical and physical processes, (ii) complete CHONPS element mass- and charge-balanced stoichiometry, and (iii) complete aqueous-phase ionic speciation. Integrating biological, chemical and physical processes and including complete CHONPS element mass- and charge-balanced bioprocess stoichiometry pose little difficulty, but modelling the entire aqueous-phase ionic content is both inefficient computationally and impractical analytically. To obviate this, only the components that have a significant influence on the aqueous-phase speciation and pH are measured and modelled. Depending on the selection of the bioprocesses to be modelled, these are the two virtually completely dissociated strong acids H2SO4 and HNO3 (and any other strong acids that may be necessary for the particular model), the six partially dissociated weak acids and bases, viz. the inorganic carbon (IC), ortho-phosphate (OP), free and saline ammonia (FSA), volatile fatty acids (VFA, represented by acetate HAc), free and saline sulphide (FSS) and the water itself, and ions like Ca2+, Mg2+, Na+ and K+ that are involved in the physical, chemical and biological processes of interest in the model such as precipitation and ion pairing.
The aqueous-phase ionic strength (IS) of these modelled and measured total species and ion concentrations is lower than the ionic strength calculated from electrical conductivity measurements ISmeas. To adjust the modelled IS to match ISmeas, Na+ and Cl- are added to the modelled aqueous mix. This ensures that the ionic strength of the aqueous phase is correct, so that the dissociation constants (pK) of the weak acids and bases are correctly adjusted for ionic strength.
Any changes to the aqueous-phase ion mix, including the [H+] or pH, due to the biological, chemical or physical processes, are calculated by the model relative to this initial state. This approach requires accurate speciation of the initial and final aqueous phases, which in turn requires accurate measurement of the total species concentrations of the five weak acids and bases arising from the CHONPS element content of the electron donor. Accurate speciation can be accomplished with the in-situ pH, FSA, OP and FSS analyses, and the 5-point titration for measuring the VFA and carbonate component concentrations (AT and CT).
The papers in this series frequently refer to speciated alkalinities for two reasons: to aid understanding of the complex interactions between solution species, and when referring to previously published results that used them (e.g. Loewenthal et al., 1989; Moosbrugger et al., 1993b; Poinapen et al., 2009). However, we do not recommend their use in practice. Referring to Fig. 1, only the total alkalinity/pH curve is measurable - all the others are derived from a speciation model. It is a recurring theme of this series of papers that component concentrations provide a more compact and efficient representation of solution composition, given that the species concentrations can always be obtained from the component concentrations via a speciation model.
ABBREVIATIONS
alk alkalinity
COD chemical oxygen demand
EC electrical conductivity
EDC electron donating capacity
FSA free and saline ammonia
FSS free and saline sulphide
HAc acetic acid (CH3COOH)
IC inorganic carbon
IS ionic strength
mol moles
OP ortho-phosphate
pH negative log of the hydrogen ion activity
TDS total dissolved solids
VFA volatile fatty acids
SYMBOLS
AT total acetate species concentration (mgHAc/L)
AlkTtotal alkalinity referenced to H2CO3/H3PO4/NH4+/H2S/HAc
Alk, total alkalinity referenced to H2CO3/H2PO4-/NH4+/ H2S/HAc
C carbon
CT total inorganic carbon species concentration (mgC/L)
e- electron
H hydrogen
IS ionic strength
ISmeas ionic strength estimated from the measured electrical conductivity (EC)
IS+ve ionic strength contributed by positive ions
IS-ve ionic strength contributed by negative ions
Kd dissociation constant
L litre
m milli (10-3) or metre
N nitrogen
NT total ammonia species concentration (mgN/L)
O oxygen
P phosphorus
pK negative log of dissociation constant. Subscripts a, c1, c2, n, p1, p2, p3, s1 and s2 refer to the dissociation constants of the acetate, inorganic carbon, ammonia, 1st 2nd and 3rd ortho-phosphate and the sulphide weak acid/base systems respectively. 1,2,3 refer to the number if protons lost relative to the most protonated species.
PT total ortho phosphate species concentration (mgP/L)
S sulphide or Siemens
ST total sulphide species concentration (mgS/L)
ß buffer capacity [mol/(L-pH)]
ym activity coefficient for monovalent ions, divalent and trivalent ions respectively
yd activity coefficient for divalent ions
yt activity coefficient for trivalent ions
REFERENCES
ANDREWS JF and GRAEF SP (1971) Dynamic modelling of the anaerobic digestion process. Anaerobic biological treatment processes. Advances in Chemistry Series No. 105. 126-162. American Chemical Society, Washington D.C. https://doi.org/10.1021/ba-1971-0105.ch008 [ Links ]
BATSTONE DJ, KELLER J, ANGELIDAKI I, KALYUZHNYI SV, PAVLOSTATHIS SG, ROZZI A, SANDERS WTM, SIEGRIST H and VAVILIN VA (2002) Anaerobic digestion model No 1 (ADM1). Scientific and Technical Report No 9. International Water Association (IWA), London. https://doi.org/10.2166/wst.2002.0292 [ Links ]
BHUIYAN IH, MAVINIC DS and BECKIE RD (2009) Determination of temperature dependence of electrical conductivity and its relationship with ionic strength of anaerobic digester supernatant for struvite precipitation. J. Environ. Eng. 135 1221-1226. https://doi.org/10.1061/(ASCE)0733-9372(2009)135:11(1221) [ Links ]
BROUCKAERT CJ, IKUMI DS and EKAMA GA (2010) A 3 phase anaerobic digestion model. 12th IWA AD Conference, Guadalajara, Mexico, 30 Oct-4 Nov 2010. [ Links ]
BROUCKAERT CJ, BROUCKAERT BM and EKAMA GA (2021a) Integration of complete elemental mass-balanced stoichiometry and aqueous-phase chemistry for bioprocess modelling of liquid and solid waste treatment systems - Part 1: The physico-chemical framework. Water SA. 47 (3) 276-288. https://doi.org/10.17159/wsa/2021.v47.i3.11857 [ Links ]
BROUCKAERT CJ, EKAMA GA and BROUCKAERT BM (2021b) Integration of complete elemental mass-balanced stoichiometry and aqueous-phase chemistry for bioprocess modelling of liquid and solid waste treatment systems - Part 2: Bioprocess stoichiometry. Water SA. 47 (3) 289-308. https://doi.org/10.17159/wsa/2021.v47.i3.11858 [ Links ]
BROUCKAERT CJ, BROUCKAERT BM and EKAMA GA (2022) Integration of complete elemental mass-balanced stoichiometry and aqueous-phase chemistry for bioprocess modelling of liquid and solid waste treatment systems: Part 5 - Aqueous-phase speciation. Water SA. 48 (1) 32-39. https://doi.org/10.17159/wsa/2022.v48.i1.3738 [ Links ]
CAPRI MG and MARAIS GvR (1975) pH adjustment in anaerobic digestion. Water Res. (3) 307-314. https://doi.org/10.1016/0043-1354(75)90052-4 [ Links ]
EKAMA GA and BROUCKAERT CJ (2022) Integration of complete elemental mass-balanced stoichiometry and aqueous-phase chemistry for bioprocess modelling of liquid and solid waste treatment systems: Part 3 - Measuring the organics composition. Water SA. 48 (1) 1-20. https://doi.org/10.17159/wsa/2022.v48.i1.3321 [ Links ]
HARDING TH, IKUMI DS and EKAMA GA (2011) Incorporating phosphorus into plant wide wastewater treatment plant modelling - Anaerobic digestion. 8th IWA Watermatex Conference, San Sebastian, Spain, 20-22 June 2011. [ Links ]
HEY T, SANDSTRÖM D, IBRAHIM V and JÖNSSON K (2013) Evaluating 5 and 8 pH-point titrations for measuring VFA in full-scale primary sludge hydrolysate. Water SA. 39 (1) 17-22. https://doi.org/10.4314/wsa.v39i1.3 [ Links ]
IKUMI DS, BROUCKAERT CJ and EKAMA GA (2011) A 3 phase anaerobic digestion model. 8th IWA Watermatex Conference, San Sebastian, Spain, 20-22 June 2011. [ Links ]
LAHAV O and LOEWENTHAL RE (2000) Measurement of VFA in anaerobic digestion: The 5 point titration method revisited. Water SA. 26 (3) 389-392. [ Links ]
LAHAV O, MORGAN BE and LOEWENTHAL RE (2002) Rapid, simple, and accurate method for measurement of VFA and carbonate alkalinity in anaerobic reactors. Environ. Sci. Technol. 36 (12) 2736-2741. https://doi.org/10.1021/es011169v [ Links ]
LAHAV O and MORGAN BE (2004) Titration methodologies for monitoring of anaerobic digestion in developing countries - a review. J. Chem. Technol. Biotechnol. 79 (17) 1331-1341. https://doi.org/10.1002/jctb.1143 [ Links ]
LIZARRALDE I, BROUCKAERT CJ, VANROLLEGHEM P, IKUMI D, EKAMA GA, AYESA E and GRAU P (2015) A general methodology for incorporating physical-chemical transformations into multiphase wastewater treatment process models. Water Res. 74 239-256. https://doi.org/10.1016/j.watres.2015.01.031 [ Links ]
LOEWENTHAL RE and MARAIS GvR (1976) Carbonate Chemistry of Aquatic Systems: Theory and Applications. Ann Arbor Science Publishers Inc, Ann Arbor, Michigan. [ Links ]
LOEWENTHAL RE, EKAMA GA and MARAIS GvR (1989) Mixed weak acid/base systems Part I - Mixture characterization. Water SA. 15 (1) 3-24. [ Links ]
LOEWENTHAL RE, WENTZEL MC, EKAMA GA and MARAIS GvR (1991) Mixed weak acid/base systems Part II: Dosing estimation, aqueous phase. Water SA. 17 (2) 107-122. [ Links ]
McCARTY PL (1974) Anaerobic processes. Presented at: International Association for Water Pollution Research (IAWPR, now IWA) short course on "Design aspects of biological treatment", Birmingham, UK, 18 Sept 1974. [ Links ]
MOOSBRUGGER RE, WENTZEL MC, EKAMA GA and MARAIS GvR (1992) Simple titration procedures to determine H2CO3*alkalinity and short chain fatty acids in aqueous solutions containing known concentrations of ammonium, phosphate and sulphide weak acid bases. WRC Report No. TT 57/92, Water Research Commission, Pretoria. ISBN 1 874858 54 3. [ Links ]
MOOSBRUGGER RE, WENTZEL MC, LOEWENTHAL RE, EKAMA GA and MARAIS GvR (1993a) Alkalinity measurement: Part 3 - A 5 pH point titration method to determine the carbonate and SCFA weak acid/bases in aqueous solution containing also known concentrations of other weak acid/bases. Water SA. 19 (1) 29-40. [ Links ]
MOOSBRUGGER RE, WENTZEL MC, EKAMA GA and MARAIS GvR (1993b) A 5 pH point titration method for determining the carbonate and SCFA weak acid bases in anaerobic systems. Water Sci. Technol. 28 (2) 237-245. https://doi.org/10.2166/wst.1993.0112 [ Links ]
MUSVOTO EV, WENTZEL MC, LOEWENTHAL RE and EKAMA GA (1997) Kinetic based model for mixed weak acid/base systems. Water SA. 23 (4) 311-321. [ Links ]
MUSVOTO EV, EKAMA GA, WENTZEL MC and LOEWENTHAL RE (2000) Extension and application of the three phase weak acid/ base kinetic model to the aeration treatment of anaerobic digester liquors. Water SA. 26 (4) 417-438. [ Links ]
POINAPEN J, EKAMA GA and WENTZEL MC (2009) Biological sulphate reduction using primary sewage sludge in a upflow anaerobic sludge bed reactor - Part 2: Modification of simple wet chemistry analytical procedures to achieve COD and S mass balances. Water SA. 35 (5) 535-542. https://doi.org/10.4314/wsa.v35i5.49179 [ Links ]
RIPLEY LE, BOYLE JC and CONVERSE JC (1986) Improved alkalimetric monitoring for anaerobic digestion of high-strength wastes. J. WPCF. 58 406-411. [ Links ]
SÖTEMANN SW, RISTOW NE, WENTZEL MC and EKAMA GA (2005) A steady-state model for anaerobic digestion of sewage sludges. Water SA. 31 (4) 511-527. https://doi.org/10.4314/wsa.v31i4.5143 [ Links ]
STUMM W and MORGAN J (1996) Aquatic Chemistry (3rd edn). Wiley, New York. ISBN 9781118591482 [ Links ]
TAIT S, SOLON K, VOLCKE EIP and BATSTONE DJ (2012) A unified approach to modelling wastewater Chemistry: Model Corrections. [ Links ]
Proc. WWTmod2012 Conference, Mont-Sainte-Anne, Quebec, Canada, 26-28 February 2012. [ Links ]
VANNECKE TPW, LAMPENS D, EKAMA GA and VOLCKE EIP (2015) Evaluation of the 5 and 8 pH point titration methods for monitoring alkalinity and VFA in anaerobic digesters treating solid waste. Environ. Technol. 36 (7) 681-869. https://doi.org/10.1080/09593330.2014.964334 [ Links ]
VAN ZYL PJ, WENTZEL MC, EKAMA GA and RIEDEL K-H (2008) Design and start up of a high rate anaerobic membrane bio-reactor for the treatment of a low pH, high strength dissolved organic wastewater. Water Sci. Technol. 57 (2) 291-295. https://doi.org/10.2166/wst.2008.083 [ Links ]
 Correspondence:
CJ Brouckaert
Email: brouckae@ukzn.ac.za
Received: 22 February 2016
Accepted: 29 December 2021
APPENDIX
5-point titration software
The programs listed in Table A1 can be downloaded from https://washcentre.ukzn.ac.za/bio-process-models/
In the 5-point titration method, it is recommended to dilute the sample to CTless than 500 mg/L as CaCO3 to avoid undue loss of CO2 during titration (Moosbrugger et al., 1992). As a result, the titration takes place at lower ionic strengths than if the sample was undiluted. Version 1 does not account for this, and uses the undiluted sample ionic strength to calculate the pK corrections resulting in a small error in the H2CO3alk and HAc concentrations calculated from the 5-point titration. This is corrected in Version 2 which calculates the pKs at the diluted ionic strengths.
A minor improvement introduced in Version 2 concerns the calculation of the ionic strength from the measured conductivity. The earlier version used a general correlation for natural waters; this was replaced by the correlation of Bhuiyan et al. (2009), which was developed for AD liquors.
The simplified speciation model used in Versions 1 and 2 does not include ion-pairing, however, the difference between including and excluding ion-pairing is very small provided the ionic strength is <0.2 mol/L (EC = 2 770 mS/m) (Tait et al., 2012).
Version 3 uses the more rigorous approach to speciation modelling outlined in Part 5 (Brouckaert et al., 2022) and includes ion-pairing in the speciation calculations. The Microsoft Excel-based VBSpeciation6_1.xlsm has a set of ionic speciation routines, implemented as spreadsheet functions that take their inputs from ranges of cells. It includes a worksheet that implements the 5-point titration concept. For the 5-point titration, the solution concentrations corresponding to the five titration points are calculated by mass balance using standard Excel formulae, from which the corresponding pH values are calculated using the speciation functions. The calculated pH values are then fitted to the measured values in the least-squares sense by adjusting the H+, CO32- and Ac- component concentrations in the initial solution composition (i.e. before titrant addition), using the Excel Solver. The Na+ and Cl- concentration in the initial solution can optionally be adjusted to match ionic strength and charge balance. This version has the advantages that the differences between all the calculated and measured pH values are visible to the user, ion pairing is taken into account, and other ion measurements that might influence the pH calculations (such as SO3- or Ac-) can be entered where available. It is also straightforward to insert further titration points if desired.

