


Servicios Personalizados
Articulo
 Inglés (pdf)
 Articulo en XML
 Referencias del artículo
Indicadores

Links relacionados
-
 Citado por Google
 -
 Similares en Google
Compartir

 Permalink
Water SA
versión On-line ISSN 1816-7950
versión impresa ISSN 0378-4738
Water SA vol.48 no.1 Pretoria ene. 2022
http://dx.doi.org/10.17159/wsa/2022.v48.i1.3321
RESEARCH PAPER
Integration of complete elemental mass-balanced stoichiometry and aqueous-phase chemistry for bioprocess modelling of liquid and solid waste treatment systems -Part 3: Measuring the organics composition
GA EkamaI; CJ BrouckaertII
IWater Research Group, Dept of Civil Engineering, University of Cape Town, Rondebosch 7700, Cape Town, South Africa
IIPollution Research group, School of Chemical Engineering, University of KwaZulu-Natal, Durban, South Africa
ABSTRACT
Bioprocesses transform the components of the material entering single or multiple reactor systems from one kind to another without a change in total material exiting the system(s) in the solid, aqueous or gas phases. Provided that the correct measurements are made that can quantify the material content of the bioprocess products (outputs), the material content of the bioprocess reactants (inputs) can be determined from the bioprocess products via stoichiometry. Based on this principle of mass conservation, the augmented biomethane (AugBMP) and biosulphide (AugBSP) potential test procedures are proposed, which change the BMP from a stand-alone test to a bio-reactor on which a range of additional tests are made to determine the composition of biodegradable organics. The AugBSP, which is based on biological sulphate reduction, can replace the inaccurate gas measurements in the BMP with the more accurate aqueous sulphate and sulphide measurements. The suitability of these two procedures is evaluated from a theoretical and modelling perspective. The analytical tests required to determine the composition of influent organics, expressed as QHyOzNaPbSc, are identified. Examples of the calculation procedure from the test results are given. It is concluded that the augmented BMP (AugBMP) and BSP (AugBSP) test procedures, supplemented by anaerobic digestion dynamic modelling, are as accurate as the analytical measurements for determining the composition of biodegradable organics, and also allow the hydrolysis rate of the biodegradable organics and the unbiodegradable fraction of the organics to be determined. Knowing these characteristics of organics fed to anaerobic digesters is important to predict the anaerobic digester performance and stability.
Keywords: bioprocess modelling, stoichiometry, anaerobic digestion, biomethane potential, biosulphide potential, integrated modelling
INTRODUCTION
The material content flux of the reactants in the influent for a continuous system, or the initial mass of reactants for a batch system, completely specifies the material content of the bioprocess products in the effluent of a flow process, or at a point in time for a batch process. The bioprocesses transform the components contained in the material entering bioreactor systems from one set of chemical components to another, without a change in total material flux exiting the system(s) in the solid, aqueous or gas phases. Similarly, in a batch reactor system, the bioprocesses transform the components contained in the material content at time zero from one set to another without a change in total material content of the products in the aqueous, gaseous or solid phases with time. This means that, provided that the correct measurements are made so that the material content of the bioprocess products (outputs) can be quantified, the material content of the bioprocess reactants (inputs, e.g., biodegradable organics) can be determined from the bioprocess products via stoichiometry. The paper presents the characterisation of the influent organics using this principle.
MUNICIPAL WASTEWATER CHARACTERIZATION
Municipal influent wastewater can be fractionated into seven organics groups, distinguished by their physical and biodegradable characteristics (Fig. 1).
There are three dissolved groups: volatile fatty acids (VFA) represented by acetate, fermentable biodegradable soluble organics (FBSO) and unbiodegradable soluble organics (USO); and four particulate groups: biodegradable particulate organics (BPO) and unbiodegradable particulate organics (UPO), each of which are subdivided into non-settleable and settleable fractions. A stoichiometric composition is assigned to each of these seven organics groups, as x, y, z, a, b and c values in CxHyOzNaPbSc. Adding influent free and saline ammonia (FSA) and ortho phosphate (OP), the elemental contents of which are known, the wastewater constituents are completely characterized for both raw wastewater (all seven constituents), settled wastewater (the three dissolved and two non-settleable constituents) and primary sludge (all 5 non-settleable in the water flow plus the two concentrated settleable constituents). Then, adding elemental compositions for activated sludge (AS) and anaerobic digester (AD) biomass and endogenous residue, as k, l, m, n, p and s values in CkHlOmNnPpSs, the seven wastewater organics and FSA and OP, and the products generated from them via the biological processes, can be tracked through the water and resource recovery facility (WRRF) comprising both aerobic and anaerobic unit operations (Ekama, 2009; Ikumi et al., 2015). This approach of characterising the municipal wastewater organics is feasible because Ikumi et al. (2014) showed that the influent and endogenously generated unbiodegradable particulate organics, as defined by aerobic (AS) conditions, and without anaerobic digester (AD) fed sludge pre-treatment, are also unbiodegradable under anaerobic digester (AD) conditions. Details of isolation and composition measurement of these organic components will be considered in a future paper.
This approach to characterising the influent organics can also be applied to stand-alone bioreactors, such as methanogenic ADs and biological sulphate reduction (BSR) systems and can be aligned with that of Anaerobic Digestion Model No 1 (ADM1, Batstone et al., 2002). The proportion and composition of fats, carbohydrates and lipids in each of the FBSO, non-settleable BPO and settleable BPO groups can be assigned such that the chemical oxygen demand (COD), carbon (C), nitrogen (N), phosphorus (P) and sulphur (S) match the CxHyOZNaPbSccomposition of the group. We adopt the general approach of assigning a single composition to each group for characterising the influent organics to ADs in plant-wide models or as stand-alone ADs, because (i) it aligns with municipal wastewater characterization, (ii) is sufficiently general to include industrial wastewater, the organic fraction of municipal solid waste (OFMSW) and many other bio-system applications, and (iii) employs as many as possible measurement methods routinely used at municipal and industrial water and resource recovery facilities (WRRF), which are included in Standard Methods (1998).
ELECTRON DONOR ORGANICS COMPOSITION
The general organics composition CxHyOzNaPbScch can be written in various equivalent forms, e.g.:
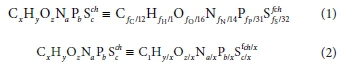
where fC, fH, fO, fN, f and f are the six mass ratios (g element/g component) of the organics (volatile suspended solids, VSS if particulate) and the right-hand-side of Eq. 1 gives the stoichiometric composition of 1 g of the e- donor organics. The organics composition mass balance is given by the sum of its mass ratios, viz.:

The mass ratios fC, fH, fO, fN, fP and fSare identical to the aNjand awof Grau et al. (2007) and Volcke et al. (2006), were the i refers to the different organic groups. While the formula masses of these three different forms of expressing the compositions of each organic group are different, the relative masses of the composition elements are the same in each form.
For many industrial wastewaters, the charge and composition of the e- donor are known because they originate from reasonably well-defined industrial processes and operations, e.g., synthesis reaction product water (Van Zyl et al., 2008). If the influent organics have a charge, this can be detected by pH-titration curves over the 4-10 pH range to see if there are additional weak acid/base systems present to the usual inorganic carbon (IC), volatile fatty acids (VFA), OP, FSA and free (H2S) and saline (HS-) sulphide (FSS) (Westergreen et al., 2012).
Aside from the VFA, which are measured separately (by gas chromatography or 5-point titration: Moosbrugger et al., 1993; Vannecke et al., 2015; see also Part 4 of this series - Ekama et al., 2022) and can be represented by acetate, the elemental composition of municipal wastewater organics, the organic fraction of municipal solid waste (OFMSW) and food waste organics are not known and can vary on a daily or feed batch basis. The dynamic response of bioprocess systems, like methanogenesis, biological sulphate reduction (BSR), and even activated sludge (AS), cannot be modelled unless the composition of the various most significant organics groups is known. For aerated AS open to the atmosphere, knowledge of the elemental compositions of the organics groups is not necessary - the mass (VSS), COD, N and P content of each are sufficient because most CO2 produced from C content of the organics is stripped out to the atmosphere by the aeration system. However, closed bioreactors, such as methanogenic AD, are profoundly affected by varying composition of the feed organics, even where the feed rate is constant because varying organics composition affects the gas and aqueous phases, and hence the aqueous pH (Brouckaert et al., 2021b). So, measurement of the organics elemental composition before they are fed to AD systems is very important to predict the system's response, the main reason for which is to avoid biosystem upset or failure. Accordingly, completely mass-balanced, three phase (aqueous-solid-gas) plant-wide bioprocess models are written in a general way, which requires the composition parameters of the various organics groups, including the AD biomass, as inputs to the models (Brouckaert et al., 2010; Ikumi et al., 2011; Brouckaert et al., 2021b).
Accepting that the charge (ch) of municipal wastewater organics, the organic fraction of municipal solid waste (OFMSW) and food waste is zero, there are six unknowns in Eqs 1 to 3, either x, y, z, a, b and c or fC, fH, fO, fN, fPand fS. So six measurements are required to define the composition. This paper proposes measurement and calculation methods for determining the composition of the different organics groups.
CALCULATING ORGANICS AND BIOMASS ELEMENTAL COMPOSITIONS
In the bioprocess stoichiometry, the elemental composition of all but two components are known, i.e., the organics and the biomass. Actually, it is the composition of these two components that affect the concentrations of all the other components of known composition in the aqueous and gas phases involved in the bioprocesses. Therefore, the changes in the aqueous and gas phase concentrations caused by these two components can be used to determine their composition. Sometimes, for autotrophic and anaerobic processes, an approximate biomass composition can be assumed (like C1H14O04N02, or the better known C5H7O2N, Porges and Hoover, 1952) because the net biomass yield (E) is very low, usually <10% of the electron (e-) donating capacity (EDC) utilized, but for aerobic processes where the net yield is high (>40%), reasonably accurate estimates of the biomass composition are required to accurately calculate (with steady state or dynamic models) the bioprocess reactants (nitrate and oxygen consumption) and products (sludge production).
Ideally, the measurements required to define the composition should be the six associated with the six mass ratios because they are directly connected to the molar compositions via Eq. 1, i.e., the volatile suspended solids (VSS), total organic carbon (TOC), total organic hydrogen (TOH), total organic oxygen (TOO), total organic nitrogen (TON), total organic phosphorus (TOP) and total organic sulphur (TOS). However, these are not equally amenable to direct or indirect measurement, and furthermore the different organics groups are difficult to isolate and measure without the interfering presence of some of the other organics groups. So COD is added to the list, where the COD is the electron (e-) donating capacity (EDC) of the organics expressed as oxygen used if all the donated e- were accepted by oxygen.
Accepting for the moment that the different organics groups can be isolated and measured independently, then for particulate organics (BPO and UPO), four of the seven parameters can be measured with routine wet chemical analysis, i.e., VSS, COD, TON and TOP, where TON and TOP are obtained from the total
Kjeldahl nitrogen (TKN), FSA, total phosphorus (TP) and OP tests, i.e., TON = TKN - FSA and TOP = TP - OP. From these four measurements (actually six, two each for the TON and TOP), the three mass ratios fcv (gCOD/gVSS), fN(gTON/gVSS) and fP (gTOP/gVSS) can be determined. The remaining three mass ratios can be obtained by elemental analysis, viz., fC, fH and fS (details below). This leaves the TOO/VSS (fO), which is replaced by the COD/VSS mass ratio (fcv). Also, sometimes one of the mass ratios is not measured but calculated from the remaining five measured mass ratios and the mass balance (Eq. 3). Therefore, equations are required based on mass balance from which the non-measured mass ratios (e.g. fO and/or fH) can be calculated from the five (or four) measured mass ratios. For dissolved organics, it is not possible to do a mass concentration measurement (like VSS for particulate). So one of the mass ratios needs to be assumed, e.g. fcvgCOD/g or fCgC/g and the mass determined from it and one of the COD or TOC concentration measurements.
MASS RATIO EQUATIONS INCLUDING THE COD/ VSS MASS RATIO AND MASS BALANCE
The elemental composition of the e- donor organics (Eqs 1 or 2) (and biomass k, l, m, n, p, and s in CkHOmNnPpSs if this is to be determined), requires all six element mass ratios to be known. If, for example, fOand fHare not measured and replaced by the COD/VSS ratio (fcv) and mass balance, i.e. fH = 1 - fC + fO + fN + fP + fS, then equations for fO and fH can be derived in terms of the five measured mass ratios (fcv, fC, fN, fP, fS), by considering the element and charge balances for the overall reaction of the COD test. Selecting the standard aquatic chemistry components that represent the products of the COD test (i.e. CO32-, H2O, NH4+, PO43-, SO42-, which all have an EDC relative to COD of zero as in Eqs 10 and 11 in Brouckaert et al., 2021b (Part 2), yields:
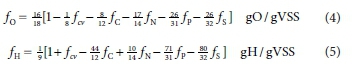
Details of the derivation of Eqs 4 and 5 are given in the Appendix. Equations 4 and 5 have been set up to maintain the mass balance when one or more of the mass ratios are set to zero. With all six mass ratios known (some zero), the molar composition of the organics (or biomass) can be determined from Eq. 1. Then with Eq. 2, this molar composition for 1 g organics can by scaled to any desired molar mass or composition. For example, the mass ratios fcv = 1.416 gCOD/gVSS, fC = 0.531 gC/gVSS and fN = 0.124 gN/gVSS (with fP and fS = 0) yield fO = 0.283 gO/gVSS and fH = 0.0619 gH/gVSS from Eqs 4 and 5. Then from Eq. 1 the molar
composition for 1 gVSS is C0.04425H0.06195O0.01769N000886. This can be scaled to a C1 basis by multiplying the molar values by 1/0.004425 = 22.60 gVSS/mol and yields C1.0H1.4O0.4N0.2, which is equivalent to the well known C5H7O2N for biomass grown on milk protein (casein) first measured by Porges and Hoover (1952).
Equations 4 and 5 are general and apply not only to organics but also to any uncharged e- donor, such as H2S, H2S2O3 and CH3COOH, provided the appropriate mass ratios are substituted into them for the particular e- donor. For example, taking H2S2O3 for which fC = fN = fP = 0, = 64/114 gCOD/g, fS = 64/114 gS/g, then fO = 16/18{1 - 1/8 x 64/114 - 0 - 0 - 0 - 26/32 x 64/114} = 48/114 and fH = 1/9{1 + 64/114 - 0 + 0 - 0 - 80/32 x 64/114} = 2/114, which are correct from the known composition of H2S2O3.
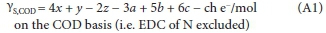
The coefficients in Eqs 4 and 5 have been retained in fraction form because they conform to specific rules, which are explained in the Appendix. These rules reveal a remarkably consistent order -there is always much beauty when creation reveals its secrets. This order means that Eqs 4 and 5 apply irrespective of the e- donor products selected for an e- donor reaction, such as COD (EDC of ammonia excluded) or total oxygen demand (TOD, EDC of ammonia included) which is demonstrated in the Appendix.
All of the discussion above on the calculation of the composition of the organics applies equally to the calculation of the composition of the biomass, because in bioprocess stoichiometry the biomass is simply a different type of organic compound.
MEASUREMENT ERROR IN ORGANICS COMPOSITION DETERMINATION
The advantage of basing the fH and fO mass ratio equations on the mass balance is that any of the mass ratios can be set to zero if deemed negligibly small (like fPor fS) and maintain the mass balance with the remaining non-zero mass ratios. This is useful not only for known e- donor substrates like acetate, sulphide or ammonia but also for organics. If the P, S or even H content of a substrate or biomass are considered low enough to ignore, these mass ratios can be set to zero and the remaining mass ratios, fC, fOand fN, then represent 100% of the mass of the substrate organics or biomass. If these three mass ratios (fC, fO and fN) were measured with COD, TOC, TKN and VSS tests and they do not add to 1, then the error would need to be spread across all three mass ratios in a way reflecting the uncertainty associated with the measurements required for the different mass ratios to establish the mass balance (Zf = 1).
From a measurement perspective, replacing the fHmass ratio by the mass balance aggregates any error in the measurement of the other mass ratios onto the fH. Because fHcontributes relatively little (<10%) to the total mass of the organic, even relatively small errors in the large contributors to the mass of the organics (fC, fcvand fO) can cause fH to become -ve. It is therefore better to measure fH and fN also and then distribute the error in the mass balance between all the measured mass ratios to establish the mass balance. How much of the error to assign to each mass ratio depends on the uncertainty (standard deviation) associated with the measurements required for the different mass ratios.
MEASUREMENT OF THE ORGANICS COMPOSITION
Biomethane potential (BMP) test procedure
Improved and refined over the years, the biomethane potential (BMP) test procedure has long been used to estimate the methane that can be potentially generated from an organic material when anaerobically digested (Owen et al., 1979; Speece, 1996, 2008). The test is conducted by running two AD batch tests in parallel for around 15 days, one control (hereafter referred to as Control) with AD biomass seed sludge only (and distilled water or filtered effluent in place of the organics volume) and one test (hereafter referred to as Test) with the same volume and concentration of seed sludge plus a measured volume and concentration of organics. Daily, the gas (CH4 and CO2) generation by both are measured. The difference in the CH4 production between the Test and Control is assumed to be due to the utilization of the organics and the COD of this CH4 as a ratio of the COD of the organics added to the Test is deemed to be the biodegradable fraction of the organics (Lin et al., 1999; Moody et al., 2009; Angelidaki et al., 2009).
Augmented BMP test procedure
In this paper, Augmented BMP (AugBMP) and biosulphide potential (AugBSP) test procedures are proposed. By measurements on samples withdrawn at regular intervals from the Test and Control batch tests of the BMP test, the FSA, OP and H2CO3 alk (and VFA by 5-point titration, Moosbrugger et al., 1993; Vannecke et al., 2015; Part 4 of this series - Ekama et al., 2022) and the in-situ pH, the composition mass ratios (fcv, fC, fN, fP) of the biomass in the AD sludge seed and the biodegradable organics can be determined. This procedure is essentially an extension of that proposed by Raposo et al. (2006), Batstone et al. (2009) and Jensen et al. (2011). Raposo et al. (2006) proposed adding to the BMP test procedure VFA, pH and partial and total alkalinities analyses. However, these two alkalinities are not related to the H2CO3alkalinity in mixtures of weak acids/bases and so do not correctly characterize the aqueous phase comprising mixed weak acid/base systems to accurately recover the C in the biodegradable organics. Interestingly, Appels et al. (2011) developed a regression model that includes 19 organics compositional variables (such as COD, proteins, carbohydrates, S, P, pH) measured in triplicate on each of 29 sewage sludge samples from various WRRF and tested in the BMP test procedure. They concluded that their regression model can predict the ultimate methane production potential of a random sludge sample within 1.15%.
From the bioprocess stoichiometry of methanogenesis (Part 2 - Brouckaert et al., 2021b), in the Control, the C, N and P in the biomass endogenously respired ('lost') becomes part of the gaseous and aqueous products and can be measured there. So from the concentration differences in the Control between start and end (Cend - Cstart), the COD, VSS, C, N and P of the biomass endogenously respired ('lost') can be calculated. These calculations from a theoretical AugBMP test procedure are shown in Tables 1 and 2. From the difference in H2CO3 alk (from which the difference in CO3- is determined), CH4 and CO2 volumes generated between the end and start of the Control, the C content of the biomass (fC) can be calculated (Table 3). It is important that the H2CO3 alk (i.e. the alkalinity of the inorganic carbon and water systems only) is correctly identified, which can be done in mixed weak acid/base systems with the 5-point titration (Part 4 of this series - Ekama et al., 2022). Similarly, the N and P content of the biomass (fN, fP) can be calculated from the difference between the end and start FSA and OP concentrations. Also, the COD of the biomass 'lost' (fcv) is given by the difference between the end and start methane COD. Finally, the VSS of the biomass 'lost' is the difference between the end and start VSS concentrations. Provided all the necessary measurements can be made accurately enough (which is not necessarily the case), it is theoretically possible to determine the composition mass ratios of the biomass in the AD sludge seed from the control batch of the AugBMP test procedure.
Similarly, in the Test batch, the differences between the end and start (Tend - Tstart) concentrations and volumes are products generated by both the biomass endogenous respiration and the utilization of the organics. Then the differences in concentrations between the Test and Control [(Tend- Tstart) - (Cend- Cstart)] are deemed to be products generated by the degraded biodegradable organics. Again, provided all the necessary measurements can be made accurately enough (which is not necessarily the case), it is theoretically possible to estimate the composition mass ratios of the biodegradable organics from the AugBMP test procedure (Tables 1, 2 and 4). So from the difference [(Tend -Tstart) - (Cend - Cstart)] in H2CO3 alk (from which the difference in HCO3- is determined), and the C in CH4 and CO2, the C content of the organics (fC) can be calculated (Table 4). Similarly, the N and P content of the organics (fN, fP) can be calculated from the differences of the FSA and OP concentrations [(Tend - Tstart) -(Cend - Cstart)]. Also, the COD of the organics utilized f) is given by the methane COD difference [(Tend- Tstart) - (Cend- Cstart)].
Finally, the VSS of the organics utilized is given by the VSS concentrations difference [(Tend- Tstar - (Cend- Cstart)]. If the biodegradable organics are dissolved, the calculation procedure remains the same. However, because a mass measurement like VSS for particulate organics cannot be made, one of the mass ratios like COD/mass (fcv) has to be assigned an assumed value.
Measurements most prone to error in the AugBMP test procedure are the biogas (CH4 + CO2) volume and composition (%CH4) and the VSS difference. Also, samples taken during the test reduce the liquid volume and decrease the gas production, which is complicated to correct for. Gas volumes are difficult to measure accurately, more so than aqueous concentrations. The VSS difference will be subject to large variation when it is the difference between two large concentrations (end minus start). These errors will affect the accuracy of all the mass ratios.
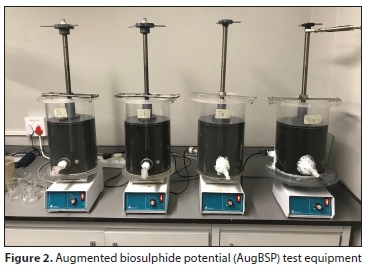
Augmented biosulphide potential (AugBSP) test procedure
The AugBSP test procedure is proposed to obviate the gas volume measurement error and correction problems. Loewenthal et al. (2005) showed that the hydrolysis rates of organics under methanogenic and sulphidogenic conditions were not significantly different provided the sulphide concentration does not increase above 500 mgH2S-S/L. As discussed in Part 2 (Brouckaert et al., 2021b), very little gas is produced by BSR, because the sulphide produced buffers the pH at values where the vapour pressures of CO2 and H2S are very low (in the absence of a separate source of acidity). The only gas production would be by diffusion into the reactor headspace until the partial pressures of CO2 and H2S reach saturation. Minimising the headspace volume will suppress this almost completely.
The AugBSP test procedure follows the same procedure as the AugBMP test procedure, i.e., a Control and a Test batch BSR test are run in parallel. Each is done in a completely sealed glass reactor fitted with a purpose-built sealed lid with a screw-operated plunger and clampable sample withdrawal hose (Fig. 2). pH has to be measured in situ with a probe directly in the AugBSP reactor, because pH will rise quickly in extracted samples due to loss of H2S and CO2. To ensure the AugBSP reactor remains completely full with no head space, when a sample is required the sample withdrawal hose is unclamped and the screw-operated plunger screwed down to force out a sample from the reactor. Two samples are collected and treated in the manner outlined by Poinapen et al. (2009), viz., one collected in a sample jar with 1 drop 10N NaOH and the other in a sample jar without NaOH. The sample with the NaOH can be membrane vacuum filtered without loss of H2S (and CO2) and the organics and FSS determined via the COD or another method. If FSS is measured by another method, then it is still necessary to collect the sample into 10N NaOH to avoid H2S loss. If inaccurate FSS results are entered into the 5-point titration programme, it will yield inaccurate results for the H2CO3 alk (Poinapen et al., 2009). The filtered sample is analysed for FSA, FSS and OP. After centrifugation of the sample collected without NaOH, the 5-point titration is done on the supernatant. Moderate loss of CO2 and H2S does not affect the H2CO3 alk result from the 5-point titration test and companion speciation calculation programme. Provided accurate in-situ FSA, FSS and OP concentrations are entered into the 5-point titration companion calculation programme (obtainable from https://washcentre.ukzn.ac.za/bio-process-models/), accurate estimates of the H2CO3 alk will be obtained (Poinapen et al., 2009; Part 4 of this series -Ekama et al., 2022). An accurate estimate of the H2CO3 alk allows an accurate estimate to be made of the C composition of the AD biomass (Control) and biodegradable organics (Test).
The results from a theoretical AugBSP test with the identical inputs as the theoretical AugBMP test are given in Tables 1 and 2. From the bioprocess stoichiometry of sulphidogenic AD (Brouckaert et al., 2021b), in the Control, the C in the biomass endogenously respired ('lost') becomes aqueous HCO3- only. So from the (Cend - Cstart) difference in H2CO3 alk (from which the difference in HCO3- is determined), the C content of the biomass (fC) can be calculated (Table 5). Similarly, the N and P content of the biomass fN, fP) can be calculated from the (Cend - Cstart) difference in FSA and OP concentrations. Also, the COD of the biomass 'lost' (fcv) is given by the (Cend - Cstart) difference in FSS (converted to COD, i.e. mgFSS-S/L x 64/32) or SO42- (converted to COD, i.e. mgSO4-S/L x 64/32) concentrations. Finally, the VSS of the biomass 'lost' is the (Cend - Cstart) difference in VSS concentrations. All these measurements are on aqueous samples which can be measured accurately, except possibly the VSS. Hence, it is theoretically possible to determine the compositional mass ratios of the AD biomass from the AugBSP Control batch (Table 5).
Similarly to the AugBMP, the differences in concentrations between the AugBSP Test and Control [(Tend - Tstart) - (Cend -Cstart)] are deemed to be products generated by the degraded biodegradable organics. So from the difference [(Tend - Tstart) -(Cend - Cstart)] in H2CO3 alk (from which the difference in C is determined), the C content of the organics fC) can be calculated (Table 6). Similarly, the N and P content of the organics (fN, fP) can be calculated from the differences of the FSA and OP concentrations [(Tend- Tstart) - (Cend- Cstart)]. Also, the COD of the organics utilized (fcv) is given by the sulphide COD or sulphate (converted to COD) difference [(Tend - Tstart) - (Cend -Cstart)]. Finally, the VSS of the organics utilized is given by the VSS concentration difference [(Tend - Tstart) - (Cend - Cstart)]. All these measurements are of aqueous-phase concentrations and can be measured accurately, except possibly the VSS.
Hence, it is theoretically possible to determine the compositional mass ratios of the biodegradable organics from the AugBSP test procedure (Table 6). Practically, because all the required concentrations are measured in the aqueous phase, decreasing the Control and Test volumes due to sampling does not affect the results.
STRUCTURAL IDENTIFIABILITY OF THE AugBMP AND AugBSP PROCEDURES
The structural ability of the AugBMP and AugBSP test procedures to identify the elemental mass ratios of the biomass and biodegradable organics was checked with two types of methanogenic (MP) and sulphidogenic (BSR) kinetic and stoichiometric models - a simplified model with the hydrolysis/ acidogenesis and endogenous respiration bioprocesses yielding final MP and BSR products and a complete two-phase (aqueous-gas) methanogenic and sulphidogenic bioprocess model with fully integrated aqueous-phase modelling (PWM_SA_AD_BMP/ BSP, Botha, 2015; Botha et al., 2015), which is an implementation of the PWM_SA_AD anaerobic digestion model used by Ghoor (2019), which in turn is a sub-model of the PWM_SA plant-wide WRRF model (Ikumi et al, 2015).
Organics composition determination with a simplified AD model
In the simplified model, a spreadsheet was coded with the COD mass-balanced kinetics model based on saturation hydrolysis/ acidogenesis kinetics (Sötemann et al., 2005) for batch test conditions and the fully mass balanced CHONPS stoichiometry for methanogenesis, one sheet for the Test, an identical parallel sheet for the Control and a third sheet for the [(Tend - Tstart) -(Cend - Cstart)] concentration differences. The methanogenic sludge seed comprised three organics types - acidogen biomass, acidogen endogenous residue and unbiodegradable particulate organics (UPO seed), and the organics comprised two organics types - biodegradable particulate organics (BPO), represented by Casein (C1H1.5O0.375N0.250, Table 1, which yields mass ratios fcv = 1.3913 gCOD/gVSS, fC=0.5217 gC/gVSS, fN = 0.1522 gN/gVSS, fP = 0.0000 gP/gVSS) and unbiodegradable particulate organics (UPO organics). The COD concentration and mass ratios assigned to each of the three groups in the sludge seed and the two groups in the organics are shown in Table 1. The combined concentrations and mass ratios calculated from the individual organics' values are also shown in Table 1.
For both the AugBMP and AugBSP test procedures, in the Control batch, 1 L sludge seed was mixed with 1 L distilled water and in the Test batch, 1 L sludge seed was mixed with 1 L organics. In the AugBSP Test and Control batches 1 500 mgSO4-S/L was added. The start (Cstart,Tstart), end (Cend, Tend) and difference (Cend-Cstart, Tend - Tstart) particulate and aqueous concentrations and gas volumes of the Control and Test batches are shown in Table 2 for both the Test and Control batches of the AugBMP and AugBSP procedures. The end particulate and aqueous concentrations and gas volumes are the calculated values after 12 d using the saturation hydrolysis/acidogenesis kinetics of Sötemann et al. (2005), i.e. KM=5.27 gCOD/(gCOD.d) and KS= 7.98 gCOD/gCOD for primary sewage sludge. The acidogen biomass yield (Y"AD), endogenous respiration rate (bAD) and endogenous residue fraction (fAD) were 0.10 gCOD/gCOD, 0.041 /d and 0.08, respectively. After 12 d, 99.85% of the biodegradable organics was utilized in the Test batch and 36.36% of the acidogen biomass was endogenously respired in the Control batch. The methane and sulphide COD production rate and cumulative methane and sulphide COD versus time in the AugBMP and AugBSP Test and Control batches are shown in Fig. 3. The acidogen biomass (ZAD), acidogen endogenous residue (ZED), organics unbiodegradable particulate COD (Supi) and organics biodegradable particulate COD (Sbp) concentrations versus time in the Test and Control AugBMP and AugBSP batches are shown in Fig. 4. Similarly, the FSA and OP concentrations versus time are shown in Fig. 5, the H2S alkalinity (alk), H3PO4 alk, H2CO3 alk and total alk concentrations versus time in Fig. 6 for the AugBMP and in Fig. 7 for the AugBSP Test and Control batches. The sulphate and sulphide concentrations versus time in the AugBSP Test and Control are shown in Fig. 8 and cumulative methane, carbon dioxide and total gas volume in mL (at 20°C) versus time in the AugBMP Test and Control are shown in Fig. 9. The gradual increase in gas (in BMP) and sulphide (in BSP) production rate over the first 2 days was obtained by including an acidogen activity factor, which increased parabolically from 0 at time 0 to 100% after 2 days.
Calculating the biomass composition from the AugBMP and AugBSPprocedure results
Tables 3 and 4 show the calculation of the biomass composition that was endogenously respired in the AugBMP and AugBSP
Control (Cend - Cstart) batches. Both AugBMP and AugBSP
procedures yield the same composition results for the biomass and are exactly the same as the input biomass composition (Table 1). This proves the validity of the approach for the Control batch. The result is exact because only one bioprocess (endogenous respiration) operates in the AugBMP and AugBSP Control batches decreasing the acidogen biomass concentration.
Calculating the organics composition from the AugBMP and AugBSP procedure results
Tables 5 and 6 show the calculation of the example organics casein (milk protein, C1H150O0375N025) composition that was utilized in the AugBMP and AugBSP Test [(Tend- Tstart) - (Cend- Cstart)] batches. The determined composition of the casein is very close but not exact. This is because biomass growth and endogenous respiration take place in the Test batch and biomass usually has a different composition to the biodegradable organics. If the acidogen yield is set to zero, then the composition of the organics casein is exact. The calculated mass ratios and composition from the AugBMP and AugBSP test results for casein organics are fcv= 1.385 gCOD/gVSS, fC = 0.5217 gC/gVSS, fN = 0.1558 gN/gVSS andfP = -0.0017 gP/gVSS. If fPis set to zero (it cannot be negative, fchand fSalso set to 0) and fHand fOcalculated from Eqs 5a and 4a, then the determined composition is C1H1.4875O0.3700N0.2558P0, which is close to the theoretical (Table 1). The reason the calculated composition is close to the theoretical and not exact is because the AD biomass yield is low (YAD= 0.10 gCOD/gCOD). The larger the yield, the larger the error. This indicates that while with a simple kinetic and stoichiometric model it is structurally not possible to determine the exact organics composition with AugBMP and AugBSP tests, the determined composition is very close to the theoretical value. Any experimental error in actual AugBMP and AugBSP test procedures will result in error in the determined organics composition. The significance and magnitude of the error in the measurements required to estimate the different mass ratios is currently being investigated.
Adding elemental analysis to the AugBMP and AugBSP procedures
The organics composition estimate can be improved by adding elemental analysis of the solids of the Test and Control start and end times. Table 7 shows the theoretical elemental analysis results of dried solids samples taken from the Test start and Test end conditions taking into account that the %C, %H and %N are with respect to dried total suspended solids (TSS) (not volatile suspended solids, VSS) and therefore include the inorganic suspended solids (ISS). Because the COD-based hydrolysis-acidogenesis and endogenous respiration kinetic constants were the same for the AugBMP and AugBSP Test and Control batches, the particulate concentrations and elemental analysis results are the same for both. Additional wet chemical laboratory measurements, required to determine the composition of the organics utilized in the Test batch and the biomass endogenously respired in the Control batch, are VSS and TSS, unfiltered COD, TKN and TP and filtered COD, TKN, FSA, TP and OP at the start and end times. These additional laboratory results are also shown in Table 2. The last column of Table 2 shows the difference between the Test and Control batches [(Tend- Tstart) - (Cend- Cstart)]. The calculation of the COD, C, N and P mass balances for the Test and Control batches from the results in Table 2 are set out in Table 8.
The procedure for calculating the composition of a mixture of organics from elemental analysis and additional laboratory results is shown in Table 7a for the Test start results. In Table 7a, the %C, %H and %N are converted to mass concentrations by multiplying by the TSS, and the N and P concentrations are given by the difference between the unfiltered and filtered TKN and TP concentrations (Column 1). Assuming a mass balance on the VSS, the O concentration is given by the VSS minus the sum of the C, H, N and P concentrations (Column 1). The fC, fH, fO, fN and fP mass ratios are calculated from the C, H, O, N, and VSS concentrations (Column 2). The x, y, z, a and b molar composition values are calculated from the mass ratios with Eqs 1 and 2 (Columns 3 and 4). With the x, y, z, a and b molar composition values for 1 gVSS known (Column 3), the COD concentration and COD/VSS ratio are calculated with Eqs 7 and 8 (Column 1), viz.:
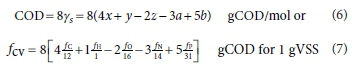
The measured COD/VSS ratio is given by fcv measured = (Unfiltered COD - Filtered COD)/VSS = (5 000 - 0)/3410.3 = 1.4662 gCOD/gVSS (Column 2). Because the 'experimental' results used in this calculation are exact, the calculated COD = fcv x VSS = 1.4662 x 3410.3 = 5 000 mgCOD/L matches exactly the measured COD (also 5 000 mgCOD/L).
For actual measurements, the calculated COD will not match exactly the measured COD. The calculation procedure is based on mass balance because the gO was calculated by difference in Table 7a. A mismatch between calculated and measured COD means there is error in the measurements from which the composition is calculated. Which of the results to change to match the calculated and measured COD depends on the uncertainty associated with each of the measurements that go into the calculation. Results with high uncertainty (high standard deviation) are the ones to change. The COD is probably one of the most accurate of the measurements and so changing some of the other less accurate measurements to reconcile the calculated COD with that measured is the best approach. Identifying which of the measurements to change to reconcile the calculated COD with that measured is currently being investigated. The same calculation procedure is applied to the Test end results (Table 7b) and for the Control start and end results (not shown).
Once the compositions of Test and Control start and end samples have been determined, the composition of the utilized organics is determined by subtracting the end concentrations from the start concentrations. This is Tstart - Tend for the biodegradable organics and Cstart - Cend for the biomass. This calculation is done in Table 8, with the calculation method listed below the table. For the biomass, Table 8 shows that the determined biomass composition from the Control (Column 6) is exact and the same as that obtained from the AugBMP and AugBSP procedure results. For the organics (Column 3) the determined organics composition from the Test (Column 3) is the same as that obtained from the AugBMP and AugBSP procedure results and therefore close to the theoretical composition of casein.
This demonstrates that the analytical and calculation procedure is theoretically valid, and the accuracy ofthe determined compositions depends on the error in the experimental measurements.
There are more measurements listed in Table 2 than required to calculate the organics and biomass compositions from elemental analysis results. As mentioned above, to determine the five composition molar values (x, y, z, a, b in CxHyOzNaPb) or mass ratios (fC,fH,fO,fN,fP), six measurements are required - essentially, the C, H, O, N, P and VSS of the organics and biomass. The C, H and N are obtained from the elemental analysis. Because this analysis is done on dried solids, additionally the TSS mass needs to be measured (which it would be anyway, in the VSS measurement). The O is replaced by COD and the P is obtained from the unfiltered and filtered TP laboratory results. This means that two additional pieces of information are available to reduce error - the laboratory TKN and FSA results for the N content, which duplicates the %N from the elemental analysis, and mass balance, i.e., fC + fH + fO + fN + fP = 1 (fS = 0). So the error on the N content can be reduced by taking the average of the N content obtained for the laboratory TKN and elemental N analyses in the COD reconciliation calculation (Tables 7a and b). The error can also be reduced by doing the AugBMP or AugBSP tests in duplicate or triplicate, with elemental analysis. While this will increase cost, it will improve the organics composition estimate in actual tests.
In practice, reconciling the measurements to obtain the best estimate of the organics and biomass compositions also has to take into account the relative experimental uncertainties associated with the various measurements (Gaszynski, 2020).
Organics composition determination with a dynamic kinetic AD model
The complete (CHONPS) element mass-balanced bioprocess stoichiometry ensures that the material content of the system input or batch test start is equal to that of the system output or batch test end. For the BMP and BSP tests, this ensures that the material content remains constant with time with the reactant components representing the material content changing with time to product components in the particulate, dissolved and gaseous phases.
The AD unit of the PWM_SA_AD model developed by Brouckaert et al. (2010) and Ikumi et al. (2011, 2015) was adapted to model the BMP test procedure (Botha, 2015; Botha et al., 2015). This model runs on the WEST platform (MikebyDHI, 2021), which includes sensitivity analysis and parameter estimation features. The sensitivity analysis feature allows identification of the bioprocess product components that are most strongly affected by the different feed organic composition parameters. The parameter estimation feature allows determination of the feed organics composition characteristics that best fit a set of measured bioprocess product results.
Adapting PWM_SA_AD to the BMP (and BSP) test procedure required conversion from an influent flow system to a batch test system. Also, for the sensitivity analysis and parameter estimation, the parameters that specify the characteristics of the organics, viz., the composition of the biodegradable organics, the unbiodegradable fraction of the organics and the degradation (hydrolysis) rate of the biodegradable organics, need to be nominated. For the Control batch this is the composition of the AD biomass groups, i.e., k, l, m, n, p and s in CkHlOmNnPpSs (the same for all four biomass groups), the non-active fraction of the AD seed sludge and the endogenous respiration rate of the four biomass groups (the same for each). With these parameters known from the Control batch, for the Test batch, the parameters determined are the composition of the feed organics, i.e., x, y, z, a and b in CxHyOzNaPb, the unbiodegradable fraction of the feed organics and the hydrolysis rate of the biodegradable organics, i.e., Kmand Ksin the Monod hydrolysis kinetic rate equation.
Ghoor (2019) extended the PWM_SA_AD model to include the biological sulphate reduction (BSR) bioprocess stoichiometry and kinetics, as well as the S content parameters for each organic (c in CxHyOzNaPbSc) and biomass (s in CkHlOmNnPpSs) group. The sulphidogenic and methanogenic bioprocesses co-exist within the PWM_SA_AD model base, but the interactions between them have not yet been modelled. Thus, either the methanogenic or the sulphidogenic bioprocesses can be selected, while the others remain dormant in the model. The hydrolysis, acidogenesis and acetogenesis bioprocesses are common to both methanogenic and sulphidogenic systems and therefore are always active. This allows the PWM_SA_AD model to be used for the organics characteristics determination from AugBSP tests in the same way as for AugBMP tests. The only difference for the AugBSP test procedure is that aqueous sulphide and sulphate are measured instead of gaseous CO2 and CH4.
The PWM_SA_AD_BMP/BSP model was verified by checking that the COD, element (C, H, O, N, P and S) mass and charge balance to 100.000% at every time step of the simulation. Anaerobic bioprocesses consume water, which means that from a complete element mass balance perspective, the AD products which include H and O obtain this H and O not only from the organics but also from the water. This water consumption (or production with aerobic processes) has to be monitored in the model to check the H and O mass balances of the bioprocesses. If the start and end H and O mass balances are checked, including the H and O of the water volume of the batch, errors in the bioprocess H and O mass balances will not be detected because they are overwhelmed by the vast excess of H and O in the water volume compared to that in the organics and biomass (AD seed sludge) inputs. The PWM_SA, model keeps track of H and O uptake (anaerobic) or release (aerobic) as H2O from and to the water volume in the bioprocess stoichiometry mass balance continuity checks to avoid this.
To reduce the number of initial concentrations that require measurement, the PWM_SA_AD model calculates the pH using equilibrium speciation (Part 1 - Brouckaert et al., 2021a,; also Part 5 of this series - Brouckaert et al., 2022). This method tracks 14 total ionic component concentrations that are most commonly found in wastewater streams, as well as the pH, H2CO3alkalinity, ionic strength (total dissolved solids, TDS or conductivity) and temperature. NaCl is added to the simulated solution to achieve the measured ionic strength determined from the conductivity. The initial ionic composition is used as a reference state, and any changes in C, H, O, N, P, S components and charge caused by the bioprocesses are tracked and used to calculate the pH as it changes with time (Brouckaert et al., 2021b; see also Parts 4 and 5 of this series).
Determining the organics composition characteristics with parameter estimation (PE)
The PE procedure runs a large number of model simulations which calibrates a set of user-selected model parameters. It uses the variable values measured at each time step of an AugBMP or AugBSP test as a set of variables (selected by the user) and compares them with the corresponding variable values generated by the model. The set of selected parameter values are changed slightly for every simulation until the error between the measured variable values and the model-generated variable values is a minimum. The variable values selected for the AugBMP test procedure (Test and Control batches) are the measured aqueous (e.g. soluble COD, H2CO3 alk, VFA, OP, FSA, pH) concentrations and CH4 and CO2 production rates (Figs 3 to 6).
In order to optimize the protocol for determining the parameters representing the composition of the organics (Test) and biomass (Control), a number of procedural calibration tests were conducted first. These calibration tests assessed the impact of (i) uncertainty in measured variable values, (ii) errors in initial simulation start parameter values, (iii) changes in statistical PE settings, and (iv) reducing the number of provided variable values on the accuracy of the PE-determined parameters. Because no AugBMP test data was available for this, PWM_SA_AD_BMP/ BSP model-generated data was used as a basis (Figs 3 to 8). This allowed the success of the calibration tests to be compared by determining the percentage error (8) in each parameter, for which the actual parameter value (Pact) was known. Since the data were generated using basis parameters from literature, Pactcould be used to calculate 8, the relative error between the actual value of the parameter (Pact) and the corresponding estimated parameter value (Pest) in terms of a percentage for each parameter via 8 = 100(Pact - Pest)/Pact.
To determine the best variables to include in the AugBMP test procedure, nine variables were selected in the PE calibration tests, i.e., methane (CH4) and CO2 gas production rates, OP, FSA, soluble COD, H2CO3alkalinity and VFA concentrations, the partial pressure of CO2 (pCO2) and the pH. These variables were selected from literature for their sensitivity to the selected set of parameters and from the simplicity of their measurement procedures. The set of seven selected parameters representing the characteristics of each of the feed organics and biomass were the four elemental composition values (y, z, a, b in CxHyOzNaPbSc with x set to 1 and the c = 0 for the Test batch and l, m, n, p and s in CkHlOmNnPpSs with k set to 1 and the s = 0), the unbiodegradable particulate fraction (UPO, f_U_Inf for the organics in the Test batch and the non-biomass part of the AD sludge seed in the Control batch) and the two Monod kinetics hydrolysis kinetic rate constants of the biodegradable organics (kM_BInf and KS_BInf) for the Test batch or the endogenous respiration rate for the biomass.
In the dynamic kinetic model, a biomass activity factor which gradually increased from zero to 100% over the first 1 to 2 days was not required as in the simple spreadsheet model discussed above. This is because the Control batch simulation correctly determines the biomass concentrations to start the Test batch simulation. This eliminates the interference of the activity factor in the determination of the organics hydrolysis kinetic rate constants.
The first calibration runs tested the impact of an error of 5% and 10% in the initial simulation start parameter value inputs (e.g. biomass concentrations), which provides the PE procedure with a starting point for the first simulation, after which the selected parameters are adjusted automatically until optimized. An estimate for the initial parameter values was found to be sufficient as an error of 10% in the initial parameter values only produced an average error of 0.0311% in the estimated parameter values. However, if the initial parameter values can be estimated within a narrow confidence interval so that the size of the range in which the parameters are allowed to vary can be reduced (from ±50% to ±25% of the initial parameter value), then the accuracy of the estimated parameter values, from measured variable values with an uncertainty of up to ±5%, can be improved from an average error of 21.02% to 4.02%.
An increase in the number of time steps (from 1/d for 4 d to 1/d for 8 d) at which variable values were measured in a BMP test decreased the accuracy of the results from an average error of4.02% to 10.21%. This is because the degradation of the biodegradable organics was complete within 4 days, so increasing the simulation to 8 days with additional measurements did not add any accuracy to the organics characterization values. The factor which had the largest impact on the accuracy of the estimated parameter values was the uncertainty in the variables (measured) values. An uncertainty of up to ±5% in the experimentally measured variable concentrations resulted in an average error in the estimated parameters of 21.02% and an uncertainty of up to ±10% resulted in average errors of 24.34% and 26.18%. However, as mentioned above, a reduction in the range in which the parameters are allowed to vary can reduce these errors considerably.
Of the nine variables, the OP, FSA and soluble COD values were highlighted as critical measurements because FSA and OP significantly influenced the accuracy of the N and P content of the BPO, respectively (a and b in CxHyOzNaPb), while soluble COD had a significant influence on the average accuracy across all the parameters. Even though the OP, FSA and soluble COD are the three least practical measurements to include in the BMP test due to their relatively time-consuming protocols, they are worth making because of the increase in accuracy in biodegradable organics composition they provide.
A set of six variables, viz. the OP, FSA, soluble COD, CO2 rate, CH4 rate and pCO2, was found to be sufficient for estimating the set of seven organics parameters (y, z, a, b, f_U_Inf, kM_BInf and KS_BInf) assuming the variable values are 100% accurate. Since the accuracy of the estimated parameters decreases with an increase in experimental error of measured variable values, the use of the full set of nine sensitive variables is recommended in the PWM_SA_AD_BMP/BSP model PE protocol.
The same calibration tests were performed using sulphidogenic bioprocesses in PWM_SA_AD_BMP/BSP. In the AugBSP
procedure, the CH4 and CO2 production rates and pCO2 are replaced with aqueous sulphide and sulphate concentrations. The BSP calibration produced the same accuracy levels as the BMP calibration tests. The advantage of the AugBSP test procedure is that aqueous sulphide (and sulphate as an additional variable) production rate can be measured more accurately than gaseous CH4 and CO2 production rates.
In this investigation, PWM_SA_AD_BMP/BSP included a single elemental composition for the influent biodegradable particulate organics (BPO). This assumes that the BPO are homogenous with a single hydrolysis rate. This reduced the number of parameters that needed to be determined by PE to the nine required for just one organic group. In reality, the organics may comprise several groups that have different compositions and hydrolyse at different rates. This may be considered the subject for future extensions of the PWM_SA_AD_BMP/BSP model. If sufficiently accurate compositions for single homogenous organics can be determined with the proposed AugBMP and AugBSP and modelling procedures, further research can be conducted into extending the model to two or three groups of biodegradable organics in the same organic material.
CONCLUSIONS
Bioprocesses transform the components contained in the material content flux entering single or multiple reactor systems from one kind to another without a change in total material content flux exiting the system in the solid, aqueous or gas phases. Based on this principle of mass conservation in bioprocess stoichiometry, the augmented biomethane (AugBMP) and augmented biosulphide (AugBSP) potential test procedures have been evaluated. These two test procedures change the BMP from a stand-alone test to a bio-reactor on which a range of additional tests are made to determine the composition of the biodegradable organics. The analytical tests were identified that need to be made to quantify the material content of the bioprocess products (outputs). This allows the material content of the bioprocess reactants (inputs), expressed as CxHyOzNaPbSc, to be determined from the measured bioprocess products and examples of the calculation procedure to do this were given. The AugBMP and AugBSP test procedures, supplemented by anaerobic digestion dynamic modelling, is as accurate as the analytical measurements for determining the composition of biodegradable organics, and also allows the hydrolysis rate of the biodegradable organics and the unbiodegradable fraction of the organics to be determined. Knowing these characteristics of organics before they are fed to anaerobic digesters (AD) is important to predict the AD performance and stability when fed the organics.
The BMP test can be criticized for being similar to the century-old biochemical oxygen demand (BOD) test - except that it is anaerobic, and therefore no better than the BOD. The problems and deficiencies of the BOD as a wastewater-strength measure for modelling aerobic processes such as the activated sludge system have been voiced for decades (for example, see Wentzel et al., 2003). The comparison with the BOD is valid in the sense that both use a sludge seed and rely on bioprocesses as opposed to more consistent and reproducible chemical reactions. However, the criticism that, as a result, the BMP also cannot be used as a organics strength measurement for mass-balanced modelling, as it yields similarly variable results, is unduly harsh for five reasons:
• Oxygen is not very soluble in water and so the BOD without aeration (as opposed respirometry with aeration) has to be done at high dilutions. The BMP test can be done at much higher seed and organics concentrations so differences are more accurate to measure and this avoids the multiplication of error.
• The yield of biomass and the endogenous respiration rate under anaerobic conditions are very low, so that practically all of the electron-donating capacity of the organics is captured in measurable electron acceptors. In contrast, the yield of biomass and the endogenous respiration rate under aerobic conditions are high, with the result that a significant proportion of the electron-donating capacity of the organics is captured in unmeasurable unbiodegradable material, which precludes the BOD test from being used as an organics strength measure for mass-balanced modelling.
• There is an international drive to standardize the BMP test procedure (Raposo et al., 2011a) and the results from an inter-laboratory evaluation show that the 'influence of inocula and experimental factors was nearly insignificant with respect to the extents of the anaerobic biodegradation' (Raposo et al., 2011b p. 1 088).
• The BOD was regarded a test in itself and not a bio-reactor on which many tests are done. The BMP is also a stand-alone test but the augmented BMP (AugBMP) and augmented BSP (Aug BSP) are not - these are bio-reactors on which a range of tests are conducted to focus the purpose and improve the results.
• Bioprocess stoichiometry and dynamic kinetic modelling techniques have become well developed over the past 40 years and generally these have not been applied to the BOD to improve its reliability - it was not necessary because it was replaced by the much better COD test as a basis for mass-balanced modelling-based operation.
Adding bioprocess stoichiometry and dynamic kinetic modelling techniques, as in the AugBMP and AugBSP, will significantly improve their reliability and reproducibility. It is realized that adding modelling and more analysis will be more costly and require greater levels of competence. Where such additional resources are required in industrial processes, there would be little hesitation to acquire them. With the transition from waste treatment to resource recovery and recycling in bio-refineries, there necessarily will be a need to also adopt new more complex approaches if this transition is to be realized.
ACKNOWLEDGEMENTS
This research was supported by the Water Research Commission, the National Research Foundation and the University of Cape Town and is published with their permission.
ABBREVIATIONS
AD anaerobic digestion
ADM1 Anaerobic Digestion Model No 1
Alk alkalinity
AS activated sludge
AugBMP augmented biomethane potential test
AugBSP augmented sulphide potential test
BMP biomethane potential test
BPO biodegradable particulate organics
BSP biosulphide potential test
BSR biological sulphide reduction
COD chemical oxygen demand
Cntl Control
EDC electron donating capacity
FBSO fermentable biodegradable soluble organics
FSA free and saline ammonia
FSS free and saline sulphide
IC inorganic carbon
MP methane producing (methanogenic)
OFMSW organic fraction of municipal solid waste
OP ortho phosphate
PE parameter estimation
TOC total organic carbon
TOD total oxygen demand
TOH total organic hydrogen
TON total organic nitrogen
TOO total organic oxygen
TOP total organic phosphorus
TOS total organic sulphur
UPO unbiodegradable particulate organics
USO unbiodegradable soluble organics
VFA volatile fatty acids
VSS volatile suspended solids
WRRF water and resource recovery facility
SYMBOLS
aCiicarbon to mass ratio of component I (ex Volcke et al. 2006)
aHi hydrogen carbon to mass ratio of component I (ex Volcke et al. 2006)
aN,initrogen to mass ratio of component I (ex Volcke et al. 2006)
aOi oxygen to mass ratio of component I (ex Volcke et al. 2006)
aPi phosphorus to mass ratio of component I (ex Volcke et al. 2006)
YS electron donating capacity of the electron donor
YS-COD electron donating capacity with respect to COD
YS-TOD electron donating capacity with respect to TOD
a molar content of nitrogen in CxH.yOzNaP6Scch electron donor
b molar content of phosphorus in CxH;),OzNaPbScch electron donor
B boron
c molar content of sulphur in CxH;),OzNaPbScch electron donor
C carbon
ch molar content of carbon in CxH.yOzNaPbScch electron donor
Ci coefficient of element i in the EDC (yS) equation.
d molar content of boron in CxH.yOzNaPbScBdch electron donor if B were included
E net biomass yield gCOD biomass produced/d per gCOD substrate utilized/d, a combined effect of growth and endogenous respiration (Ekama, 2009).
e electron
fB boron to mass ratio (gB/mass, gB/gVSS for particulate organics)
fC carbon to mass ratio (gC/mass, gC/gVSS for particulate organics)
fch charge to mass ratio (ch/g molar mass)
fcv COD/mass ratio (COD/VSS mass ratio for particulate organics)
fH hydrogen to mass ratio (gC/mass, gC/gVSS for particulate organics)
fi mass ratio of element i
fN nitrogen to mass ratio (gC/mass, gC/gVSS for particulate organics)
fO oxygen to mass ratio (gC/mass, gC/gVSS for particulate organics)
fP phosphorus to mass ratio (gC/mass, gC/gVSS for particulate organics)
fS sulphur to mass ratio (gC/mass, gC/gVSS for particulate organics)
ftv TOD/mass ratio (TOD/VSS mass ratio for particulate organics)
H hydrogen
i element i (any of CHONPS)
k molar content of hydrogen in CkHlOmNnPpSs biomass
l molar content of oxygen in CkHlOmNnPpSs biomass
MB atomic mass of the boron (10)
MC atomic mass of the carbon (12)
Med molar mass of the electron donor
MH atomic mass of the hydrogen (1)
Mi atomic mass of element i
MO atomic mass of the oxygen (16)
MN atomic mass of the nitrogen (14)
MP atomic mass of the phosphorus (31)
MS atomic mass of the sulphur (32)
n molar content of nitrogen in CkHlOmNnPpSs biomass
N nitrogen
O oxygen
p molar content of phosphorus in CkHlOmNnPpSs biomass
P phosphorus
s molar content of sulphur in CkHlOmNnPpSs biomass
S sulphur
VB volume of organic substrate added to BMP or BSP batch test
VS volume of sludge seed added to BMP or BSP batch test
x molar content of carbon in CxHyOzNaPbScch electron donor
y molar content of hydrogen in CxHyOzNaPbScch electron donor
z molar content of oxygen in CxHyOzNaPbScch electron donor
REFERENCES
APPELS L, LAUWERS J, GINS G, DEGRÈVE J, VAN IMPE J and DEWIL R (2011) Parameter identification and modelling of the biochemical methane potential of waste activated sludge. Environ. Sci. Technol. 45 4173-4178. https://doi.org/10.1021/es1037113 [ Links ]
ANGELIDAKI I, ALVES MM, BOLZONELLA D, BORZACCONI L, CAMPOS JL, GUWY AJ, KALYUZHNYI S, JENICEK P and VAN LIER JB (2009) Defining the biomethane potential (BMP) of solid organic wastes and energy crops: A proposed protocol for batch assays. Water Sci. Technol. 59 (5) 927-934. https://doi.org/10.2166/wst.2009.040 [ Links ]
BATSTONE DJ, KELLER J, ANGELIDAKI I, KALYUZHNYI SV, PAVLOSTATHIS SG, ROZZI A, SANDERS, WTM, SIEGRIST H and VAVILIN VA (2002) Anaerobic digestion model No 1 [ Links ]
(ADM1). Scientific and Technical Report No 9. International Water Association (IWA), London. https://doi.org/10.2166/wst.2002.0292 [ Links ]
BATSTONE DJ, TAIT S AND STARRENBURG D (2009) Estimation of hydrolysis parameters in full-scale anaerobic digesters. Biotechnol. Bioeng. 102 (5) 1513-1520. https://doi.org/10.1002/bit.22163 [ Links ]
BOTHA RF (2015) Characterization of organics for anaerobic digestion by modelling augmented biochemical methane potential test results. MSc (Eng) thesis, Dept of Civil Engineering, University of Cape Town. [ Links ]
BOTHA RF, IKUMI DS and EKAMA GA (2015) Characterization of organics for anaerobic digestion by modelling augmented biochemical methane potential test results. 4th YWP-ZA Biennial Conference, 16-18 Nov 2015, Pretoria. [ Links ]
BROUCKAERT CJ, IKUMI DS and EKAMA GA (2010) A 3 phase anaerobic digestion model. 12th IWA AD conference, 30 Oct-4 Nov 2010, Guadalajara, Mexico. [ Links ]
BROUCKAERT CJ, BROUCKAERT BM and EKAMA GA (2021a) Integration of complete elemental mass-balanced stoichiometry and aqueous-phase chemistry for bioprocess modelling of liquid and solid waste treatment systems - Part 1: The physico-chemical framework Water SA. 47 (3) 276-288. https://doi.org/10.17159/wsa/2021.v47.i3.11857 [ Links ]
BROUCKAERT CJ, EKAMA GA, BROUCKAERT BM and IKUMI DS (2021b) Integration of complete elemental mass-balanced stoichiometry and aqueous-phase chemistry for bioprocess modelling of liquid and solid waste treatment systems - Part 2: Bioprocess stoichiometry. Water SA. 47 (3) 289-308. https://doi.org/10.17159/wsa/2021.v47.i3.11858 [ Links ]
EKAMA GA (2009) Using bioprocess stoichiometry to build a steady state plant wide wastewater treatment plant model. Water Res. 43 (8) 2101-2120. https://doi.org/10.1016/j.watres.2009.01.036 [ Links ]
EKAMA GA, BROUCKAERT CJ and BROUCKAERT BM (2022) Integration of complete elemental mass-balanced stoichiometry and aqueous-phase chemistry for bioprocess modelling of liquid and solid waste treatment systems - Part 4: Aligning the modelled and measured aqueous phases. Water SA. 48 (1) 21-31. https://doi.org/10.17159/wsa/2022.v48.i1.3322 [ Links ]
GASZYNSKI C (2020) Identification of wastewater primary sludge composition using augmented batch tests and mathematical models. PhD thesis, Dept. of Civil Eng., University of Cape Town. [ Links ]
GHOOR T (2019) Developments in anaerobic digester modelling. PhD thesis, Dept. of Civil Eng., University of Cape Town. [ Links ]
GRAU P, DE GRACIA M, VANROLLEGHEM PA and AYESA E (2007) A new plant wide methodology for WWTPs. Water Res. 41 43574372. https://doi.org/10.1016/j.watres.2007.06.019 [ Links ]
IKUMI DS, BROUCKAERT CJ and EKAMA GA (2011) A 3 phase anaerobic digestion model. 8th IWA Watermatex Conference, 20-22 June 2011, San Sebastian, Spain. [ Links ]
IKUMI DS, HARDING TH and EKAMA GA (2014) Biodegradability of wastewater and activated sludge organics in anaerobic digestion. Water Res. 56 (1) 267-279. https://doi.org/10.1016/j.watres.2014.02.008 [ Links ]
IKUMI DS, HARDING TH, VOGTS M, LAKAY MT, MAFUNGWA HZ, BROUCKAERT CJ and EKAMA GA (2015) Mass balances modelling over wastewater treatment plants III. WRC Report No. 1822/1/14. Water Research Commission, Pretoria. [ Links ]
JENSEN PD, GE H and BATSTONE DJ (2011) Assessing the role of BMP tests in determining anaerobic degradability rate and extent. Water Sci. Technol. 64 (4) 880-886. https://doi.org/10.2166/wst.2011.662 [ Links ]
LIN J, MA Y, CHAO AC and HUANG C (1999) BMP test on chemically pretreated sludge. Bioresour. Technol. 68 187-192. https://doi.org/10.1016/S0960-8524(98)00126-6 [ Links ]
LOEWENTHAL RE, RISTOW NE, SOTEMANN SW, WENTZEL MC and EKAMA GA (2005) Hydrolysis of primary sewage sludge under methanogenic, acidogenic and sulfate-reducing conditions. WRC Report No. 1216/1/05. Water Research Commission, Pretoria. [ Links ]
Mikeby DHI (2021) - Modelling and simulation of wastewater treatment plants, URL: www.mikebydhi.com/products/west (Accessed 30 December 2021). [ Links ]
MOODY L, BURNS R, HAAN WW and SPAJIC R (2009) Use of Biochemical methane potential (BMP) assay for predicting and enhancing Anaerobic digester performance. Proceedings of the 44th Croatian and 4th International Symposium on Agriculture, 16-20 February 2009, Opatija, Croatia. 930-934. [ Links ]
MOOSBRUGGER RE, WENTZEL MC, LOEWENTHAL RE, EKAMA GA and MARAIS GvR (1993) Alkalinity measurement: Part 3 - A 5 pH point titration method to determine the carbonate and SCFA weak acid/bases in aqueous solution containing also known concentrations of other weak acid/bases. Water SA. 19 (1) 29-40. [ Links ]
OWEN W, STUCKEY D, HEALY JB Jr, YOUNG L and McCARTY P (1979) Bioassay for monitoring biochemical methane potential and anaerobic toxicity. Water Res. 13 485-492. https://doi.org/10.1016/0043-1354(79)90043-5 [ Links ]
POINAPEN J, EKAMA GA and WENTZEL MC (2009) Biological sulphate reduction using primary sewage sludge in a upflow anaerobic sludge bed reactor - Part 2: Modification of simple wet chemistry analytical procedures to achieve COD and S mass balances. Water SA. 35 (5) 535-542. https://doi.org/10.4314/wsa.v35i5.49179 [ Links ]
POINAPEN J and EKAMA GA (2010) Biological sulphate reduction using primary sewage sludge in a upflow anaerobic sludge bed reactor - Part 5: Development of a steady state model. Water SA. 36 (3) 193-202. [ Links ]
PORGES N and HOOVER SR (1952) Assimilation of dairy waste by activate sludge: II. The equation of synthesis and rate of oxygen utilization. Sewage Ind. Wastes. 24 (3) 306-312. [ Links ]
RAPOSO F, BANKS CJ, SIEGERT I, HEAVEN S and BORJA R (2006) Influence of inoculum to substrate ratio on the biochemical methane potential of maize in batch tests. Process Biochem. 41 1444-1450. https://doi.org/10.1016/j.procbio.2006.01.012 [ Links ]
RAPOSO F, DE LA RUBIA MA, FERNANDEZ-CEGRI F, BORJA R (2011a) Anaerobic digestion of solid organic substrates in batch mode: An overview relating to methane yields and experimental procedures. Renew. Sustainable Energ. Rev. 16 861-877. https://doi.org/10.1016/j.rser.2011.09.008 [ Links ]
RAPOSO F, FERNANDEZ-CEGRI V, DE LA RUBIA MA, BORJA R, BELINE F, CAVINATO C, DEMIRER G, FERNANDEZ B, FERNANDEZ-POLANCO M, FRIGON JC, GANESH R, KAPARAJU P, KOUBOVA J, MENDEZ R, MENIN G, PEENE A, SCHERER P, TORRIJOS M, UELLENDAHL H, WIERINCK I and DE WILDE V (2011b) Biochemical methane potential (BMP) of solid organic substrates: evaluation of anaerobic biodegradability using data from an international inter-laboratory study. J. Chem. Technol. Biotechnol. 86 1088-1098. https://doi.org/10.1002/jctb.2622 [ Links ]
SPEECE RE (1996) Anaerobic Biotechnology for Industrial Wastewaters. Archae Press, Nashville. [ Links ]
SPEECE RE (2008) Anaerobic biotechnology and odor/corrosion control for municipalities and industries. Archea Press, Nashville. ISBN 1-57843-052-9, pp 586. [ Links ]
SÖTEMANN SW, RISTOW NE, WENTZEL MC and EKAMA GA (2005) A steady-state model for anaerobic digestion of sewage sludges. Water SA. 31 (4) 511-527. https://doi.org/10.4314/wsa.v31i4.5143 [ Links ]
Standard Methods (1998) Standard Methods for Examination of Water and Wastewater (20th edn). American Public Health Association, Water Environment Federation and American Water Works Association, Washington DC. [ Links ]
VANNECKE TPW, LAMPENS D, EKAMA GA and VOLCKE EIP (2015) Evaluation of the 5 and 8 pH point titration methods for monitoring alkalinity and VFA in anaerobic digesters treating solid waste. Environ. Technol. 36 (7) 681-869. https://doi.org/10.1080/09593330.2014.964334 [ Links ]
VAN ZYL PJ, WENTZEL MC, EKAMA GA and RIEDEL K-H (2008) Design and start up of a high rate anaerobic membrane bio-reactor for the treatment of a low pH, high strength dissolved organic wastewater. Water Sci. Technol. 57 (2) 291-295. https://doi.org/10.2166/wst.2008.083 [ Links ]
VOLCKE EIP, VAN LOOSDRECHT MCM and VANROLLEGHEM PA (2006) Continuity-based model interfacing for plant-wide simulation: A general approach. Water Res. 40 (15) 2817-2828. https://doi.org/10.1016/j.watres.2006.05.011 [ Links ]
WENTZEL MC, EKAMA GA and LOEWENTHAL RE (2003) Fundamentals of biological behaviour and wastewater strength measurement. Chapter 9. In: Mara D and Horan N (eds) Handbook of Water and Wastewater Microbiology. Elsevier Science Ltd. 131157. ISBN 0-12-470100-0. [ Links ]
WESTERGREEN S, BROUCKAERT CJ and FOXON KM (2012) Modelling of ionic interactions with wastewater treatment biomass. Water Sci. Technol. 65 (6) 1014-1020. https://doi.org/10.2166/wst.2012.922 [ Links ]
 Correspondence:
CJ Brouckaert
Email: brouckae@ukzn.ac.za
Received: 22 February 2016
Accepted: 28 December 2021
APPENDIX
Derivation of the oxygen (fO) and hydrogen (fH) mass ratio equations
Equations 4 and 5 were derived using the yS-C0D (e-/mol) Eq. 11 in Brouckaert et al. (2021b) (Part 2) and the mass balance Eq. 3, i.e.
In Eq. A1, the COD of the e- donor CxHy0zNaPbScch is yS e-/mol x 32/4 gO2/e- or ySM0/2, where MO is the atomic mass of oxygen (16). The coefficients of x, y, z, a, b and c in Eq. A1 are simply the oxidation states of the C, H, O, N, P and S products of the COD reaction (viz., CO32-, H2O, NH4+, PO43-, SO42-) relative to their elemental state (Part 2 - Brouckaert et al., 2021b, , Fig. 1), where the products themselves have zero EDC relative to the COD oxidation reaction. The molecular mass of the e- donor CxHyOzNaPbS/h (Med, g/mol) is given by

where MC, MH, MO, MN, MPand MSare the atomic masses of C, H, O, N, P and S. So the COD/mass ratio fcv = (yaC0D MO)/(2 Med), from which yaCOD = 2fcvMed/MO. From Eq. 1, the elemental mass ratios are given by fC = xMJMed, fH = yM^Med, fO = zMo/Med, fN = aMN/Med, fP = bMP/Med and fS = cMS/Med, from which x = fCMed/ Mc, y = fMed/MH, z = foMed/Mo, a = fM/MN, b = fPMed/MP and c = fS Med/MS and the charge 'mass' ratio (charge/g e- donor) is fch = ch/Medfrom which ch = fchMed. Substituting these expressions for x, y, z, a, b, c and ch into Eq. A1 for the COD and dividing through by Medyields,

Usually the charge (ch) of the unknown organic e- donor is zero so fchis set to zero. Equation A3 is linear in which all the terms are known except fHand fO. It can be solved simultaneously with the mass balance Eq. 3, and if the atomic masses are retained as integer values, the fOEq. 4 and fHEq. 5 are obtained.
With the charge set as zero (fch = 0), Eqs 4 and 5 can be rewritten as:
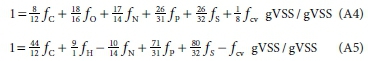
If Eq. A4 is multiplied by 8 and added to Eq. A5 and the resulting equation is divided through by 9, the mass balance for 1 g organics, Eq. 3, is obtained.
While Eqs 4 and 5 and the rewritten Eqs A4 and A5 look complex, the latter follow a specific rule in their make-up. This rule allows the mass ratio equations for fOand fHto be written simply from the element atomic masses and the coefficients in the ySCOD (e-/mol) equation of the selected elements CHONP or S making up the e- donor. Also, this rule also can be applied if other mass ratios than fOand fHare to be determined. Moreover, this rule is independent of the choice of the e- donor reactants and products in the oxidation reaction, e.g., the TOD can also be the basis of the EDC.
Rule for fOequation
In Eq. A4 for the oxygen mass ratio fO(in which fHis absent), the COD/VSS ratio (fcv) is relative to the selected oxidation products of the COD test, i.e., ammonia, phosphate and sulphate. Now in Eq. A4, from which Eq. 4 for fOis derived, the denominator of the fraction coefficients in front of the mass ratio terms is the atomic mass of its corresponding element, i.e., 12 for fC, 14 for fN, and so on. The numerator is the atomic mass of the element minus (1)/(+1) times the element's corresponding coefficient in the EDC/mol (y&C0D) equation taking due consideration of its sign, where the (1) in (1)/(+1) is the atomic mass of H and the (+1) is the coefficient of the H in the ySequation (Eq. A1). The reason that these values of the H appear here is because the H is the other mass ratio (with the O) not measured (i.e. fHis absent in Eq. 4). So for ySin terms of the COD (Eq. A1), applying this rule, the numerator of the fC term in Eq. A4 is 12 - (1)/(+1) x (+4) = +8 and the numerator of the fN term in Eq. A4 is 14 - (1)/(+1) x (-3) = +17, where the +4 and -3 are the coefficients in the yS Eq. A1 of the C and N elements, respectively. Following this rule, the fractions of the fP and fS terms in Eq. A4 are [31 - (1)/(+1) x (+5)]/31 = +26/31 and [32 - (1)/(+1) x (+6)]/32 = +26/32. The EDC/g yaC0D (= fcv /8 for COD, Eq. 1) also is multiplied by (1)/ (+1) = +1, as Eq. A4 shows. If boron, which has an atomic mass of 10, were added to the electron donor composition as Bd, then an additional term +3d is added to Eq. A1 for the EDC (yS) in terms of COD (see Fig. 1 in Part 2 - Brouckaert et al., 2021b,). This is obtained by balancing the e- donor reaction of boron in the COD test producing its most oxidized state, H3BO3, as the oxidation product, i.e. -Bd - 3dH20 + dH3B03 + 3d(H+ + e-) = 0. So the mass ratio term added to the right hand side of Eq. A4 (from which then Eq. 4 for f0 is obtained) is [10 - (1)/(+1) x (+3)/10] = +7/10fB, where fB is the mass ratio of boron (gB/g) in the electron donor.
Rule for fHequation
For the hydrogen mass ratio fH(Eq. 5), the rule is the same as that for Eq. 4, except that now the atomic mass of O and the coefficient of O in the ysEq. A1 are used in Eq. A5 because f0 is absent from it. The denominator of the fraction coefficients in front of the mass ratio terms again is the atomic mass of its corresponding element, i.e., 12 for fC, 14 for fN, and so on. The numerator is the atomic mass of the element minus (16)/(-2) times the element's corresponding coefficient in the EDC/mol (y&C0D) equation (Eq. A1), taking due consideration of its sign, where the (16) in (16)/ (-2) is the atomic mass of O and the (-2) is the coefficient of O in the ySequation (Eq. A1). So for ySin terms of the COD (Eq. A1), the numerator of the fC term in Eq. A5 is 12-(16/(-2) x (+4) = +44, for the fN term is 14 -(16/(-2) x (-3) = -10 and for the fH term is 1-(16)/(-2) x (+1) = 9. Following this rule, the fraction coefficients of the fP and fS terms in Eq. A5 are [31 - (16)/(-2) x (+5)]/31= +71/31 and [32 - (16/(-2) x (+6)]/32 = +80/32. The EDC/g yS(= fcv /8 for COD, Eq. 1), is also multiplied by (16)/ ( -2)= -8 as Eq. A5 shows. If boron were added to the e- donor, then the fraction coefficient of the fB term in Eq. A5 would be [10 - (16/(-2) x (+3)]/10 = +34/10.
Generalizing the mass ratio equation
Retaining the atomic masses as integer values in the derivation of Eqs 4 and 5 made this rule apparent and allows an overall generalization of Eqs A4 and A5 to be made, i.e.
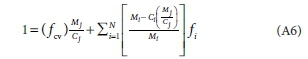
Mi = atomic mass of element with known (measured) element mass ratio
C¡ = coefficient in ySequation of known (measured) element mass ratio
N = number of elements that make up the component
f = mass ratio of element
i = the specific element selected.
Equation A6 shows that when i = j, i.e., the selected element and the omitted (non-measured) element are the same, its fraction is zero and is the reason it effectively does not appear in the equation. Tailoring Eq. A6 to fH, for which Mj= 1 and Cj= +1 and to fO for which Mj= 16 and Cj= -2 yields:

where f (i = 1 to N) are the mass ratios of the N elements that make up the substrate e- donor (or biomass), e.g., fC, fH, fO, fN, fP and fS. Substituting the Miand Civalues for the individual elements C, N, P and S into Eqs A7 and A8 yields Eqs A4 and A5 from which Eqs 4 and 5 are obtained. Equation A6 is expanded in Table A1 to show the coefficients in the mass ratio equations based on mass balance for any two unknown (non-measured) mass ratios of the possible seven (six elements CHONPS and COD).

Rule for the fO and fHequations independent of electron donor products
The rule (Eq. A6) for the fO (Eq. A4) and fH (Eq. A5) applies irrespective of the selection of the e- donor oxidation products of the elements. This is because the coefficients in the yS equation and the fraction coefficients in the mass ratio equations are related, and compensate for one another. A change in yS resulting from choosing different e- donor oxidation products is compensated for by an equal and opposite change in associated mass ratio fraction.
For example, if nitrate is selected as the oxidation product of the N element in the e- donor reaction, then the EDC/mol (ySTOD) is given by Eq. 2 in Brouckaert et al. (2021b) (Part 2), i.e.

This yS)TOD is +5 - (-3) = 8a e-/mol higher than the yS-COD of Eq. A1 with ammonia as the oxidation product for N. Dividing this difference AyS by the molecular mass of the e- donor (Med) yields Ay'S = 8a/Med e-/g. This is the EDC of ammonia, i.e., 8a e-/mol or equivalently 8gO2/e- x 8a = 64a gO2/mol ammonia oxidized to nitrate. Noting that the fcvterm in Eq. A4 for fOis multiplied (1)/ (+1) (or Mj/Cj in Eq. A6), which is implicit in Eq. A4 as +1, and that 14a/Med = fN yields Ay'S = +8/14 fN. Hence changing the fcv term to ftvin Eq. A4 for fOincreases it by +8/14 fN. However, the change of the coefficient of the N element in the yS equation (from COD, fcv/8 to TOD also causes the coefficient of the fN term in Eq. A4 to change by the same amount but with opposite sign, to keep the fO mass ratio of the e- donor unchanged. From Eq. A7, the fraction of the fNterm in the fOEq. A4 for the TOD becomes [14 - (1)/(+1) x (+5)]/14 = +9/14. The fraction of thefN term in Eq. A4 for fO has therefore changed by (+9/14) - (+17)/14)fN = -8/14fN, which is equal but has the opposite sign to the change in the fcvterm to ftvin Eq. A4.
The same happens in the fH Eq. A5, except the fcv term in Eq. A5 for fH changes by (16)/(-2)x 8a/Med e-/g, which yields Ay'S = -64/14 fN and the fraction of the fN term in the fH Eq. A5 becomes [14 - (16)/( -2) x (+5)]/14 = +54/14. This is a change of (+54/14) - (-10/14) fN/14 = +64/14fN. This is also an equal but opposite sign change in changing the fcvterm to ftvin Eq. A5.
The same equal and opposite compensation between the coefficients of the yS and fS terms in the fO and fH equations takes place if sulphide is selected as the oxidation product of the S element in the e- donor reaction, which changes the coefficient in the e- donor equation yS from +6 to -2. The coefficients in the fH and fO equations for the different e- donor reaction products of the N (ammonia and nitrate) and S (sulphate and sulphide) elements are given in Table A2.
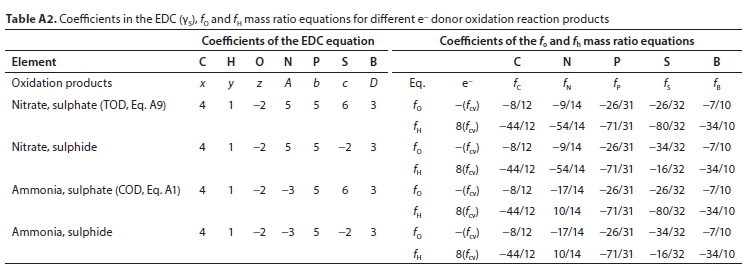


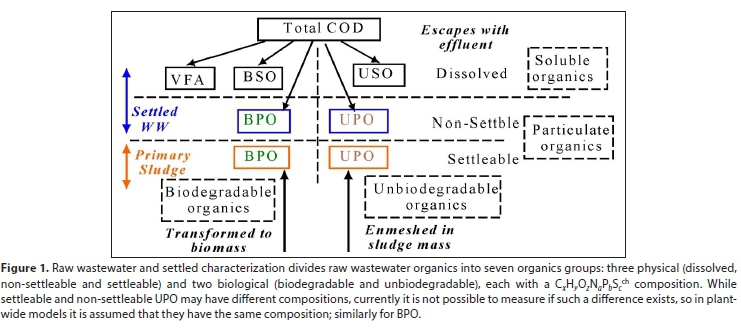
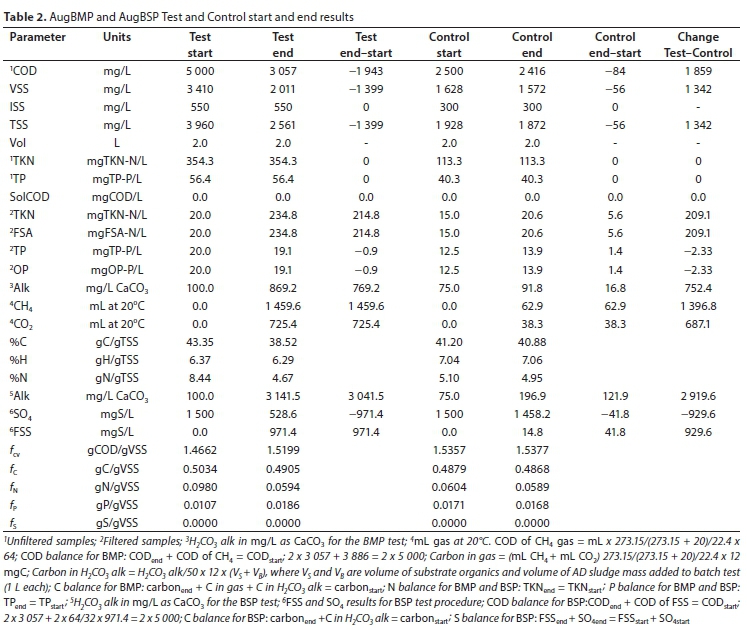
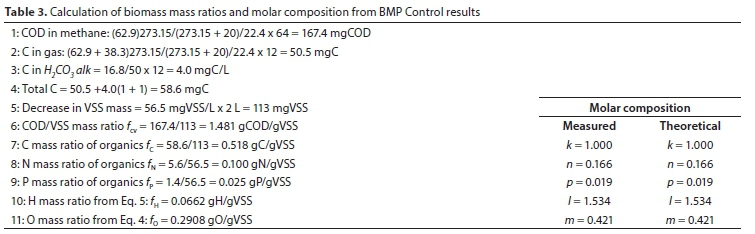
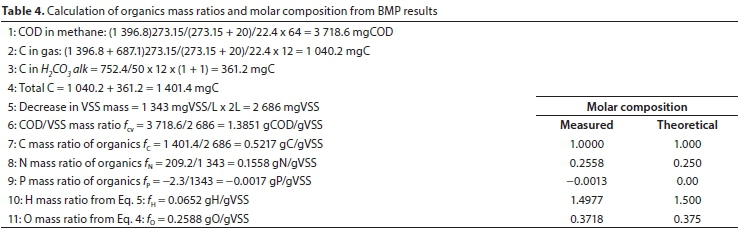
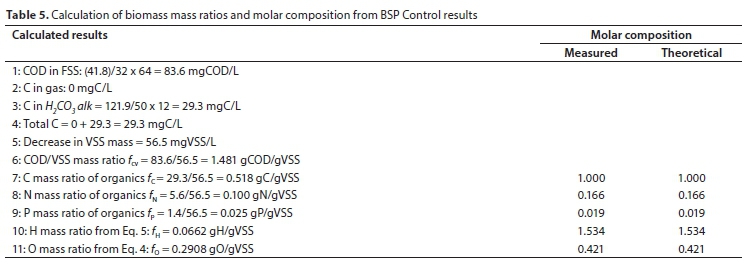
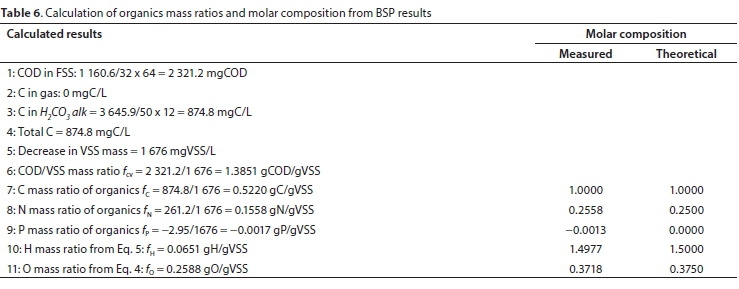
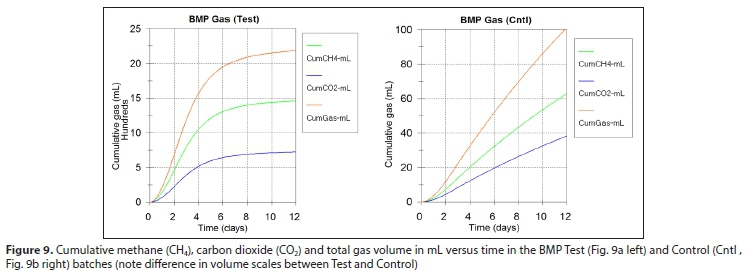
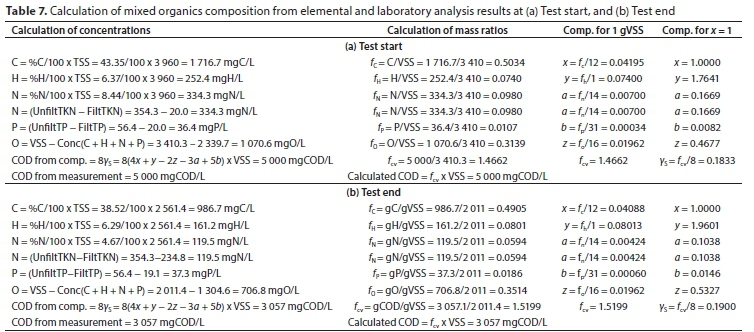
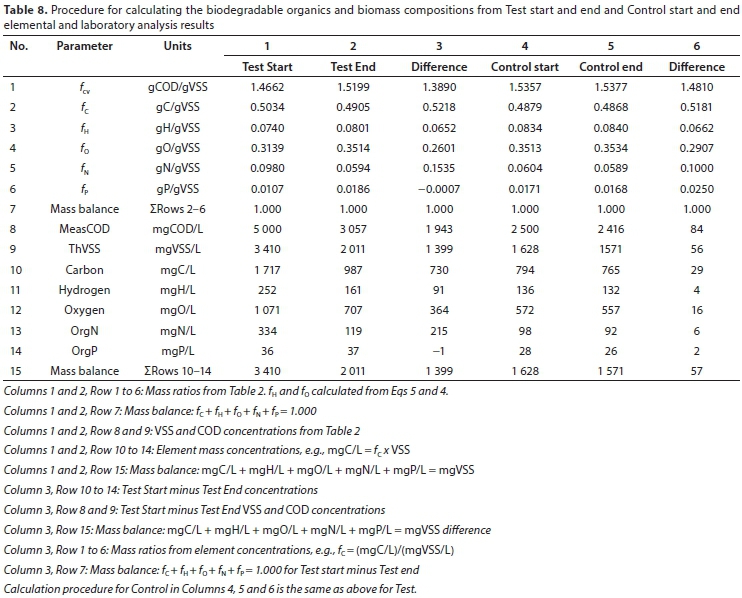