


Services on Demand
Article
 English (pdf)
 Article in xml format
 Article references
Indicators

Related links
-
 Cited by Google
 -
 Similars in Google
Share

 Permalink
Water SA
On-line version ISSN 1816-7950
Print version ISSN 0378-4738
Water SA vol.47 n.4 Pretoria Oct. 2021
http://dx.doi.org/10.17159/wsa/2021.v47.i4.3787
RESEARCH PAPER
Modelling flood hazard in dry climates of southern Africa: a case of Beitbridge, Limpopo Basin, Zimbabwe
Lloyd ChikwiramakomoI; Webster GumindogaII; Munyaradzi Davis ShekedeI; Tawanda Winmore GaraI; Talent ChumaIII
IDepartment of Geography and Environmental Science, University of Zimbabwe, Harare, Zimbabwe
IIDepartment of Construction & Civil Engineering, University of Zimbabwe, Harare, Zimbabwe
IIIInternational Rescue Committee, Beitbridge,Zimbabwe
ABSTRACT
Floods are among the natural hazards that have adverse effects on human lives, livelihoods, economies and infrastructure. Dry climates of southern Africa have, over the years, experienced an increase in the frequency of tropical cyclone induced floods. However, understanding the key factors that influence susceptibility to floods has remained largely unexplored in these dry climates. Therefore, this study sought to model flood hazards and determine key factors that significantly explain the probability of flood occurrence in the southern parts of Beitbridge District, Zimbabwe. To achieve these objectives, logistic regression was used to predict spatial variations in flood hazards following cyclone Dineo in 2017. Before spatial prediction of flood hazard, environmental variables were tested for multicollinearity using the Pearson correlation coefficient. Only two environmental variables, i.e., elevation and rainfall, were not significantly correlated and were thus used in the subsequent flood hazard modelling. Results demonstrate that two variables significantly (p < 0.05) predicted spatial variations in flood hazard in the southern parts of the Beitbridge District with relatively high accuracy defined by the area under the curve (AUC = 0.98). In addition, results indicate that ~56 % of the study area is regarded as highly susceptible to floods. Given the projected increase in extreme events such as intense rainfall as a result of climate change, floods will be expected to correspondingly increase in these semi-arid regions. Results presented in this study underscore the importance of geospatial techniques in flood-hazard modelling, which is the key input in sustainable land-use planning. It can thus be concluded that spatial analytical techniques play a key role in flood early warning systems aimed at supporting and building resilient communities in the face of climate change-induced floods.
Keywords: GLM, climate change, flood hazard, GIS
INTRODUCTION
Floods are among the most frequent and costly natural disasters with regard to human and economic loss. Every year floods claim over 20 000 lives and adversely affect approximately 140 million people worldwide (Bach et al., 2010). Globally, floods affected 2.3 billion people and killed approximately 157 000 between 1995 and 2015 (Formetta and Feyen, 2019). Annual global losses due to floods are approximately 20 billion USD (Wahlstrom and Guha-Sapir, 2015). In Africa, 20 000 people were killed and nearly 40 million were affected by floods between 1900 and 2006 (Mulugeta et al., 2007), while damages worth 4 billion USD were realized during the same period. In 2019, the second strongest ever recorded cyclone (Idai) in the Southern Hemisphere affected more than 1.5 million people in Mozambique, resulting in more than 600 deaths while over 1 600 persons were injured (Charrua et al., 2021). In Zimbabwe, Idai resulted in more than 340 deaths and 175 injuries with about 51 000 people displaced and 270 000 people affected in Zimbabwe (Chatiza, 2019). Thus, flood hazard modelling could significantly reduce the loss of human lives, damage to property and infrastructure.
There is an imperative need for developing and/or adapting spatially explicit approaches in modelling floods, to enhance our understanding of flood evolution and to ameliorate the disastrous effects of floods (Pradhan, 2009). In recent years, geographic information systems (GIS) and remote sensing have been applied in the modelling and evaluation of natural hazards (Uddin et al., 2013). Advances in GIS, particularly its ability to integrate spatial data from various sources, have provided an opportunity for scientists to predict spatial variations in flood patterns and severity (Demir and Kisi, 2016). In particular, the coupling of remote-sensing data and field data in a GIS environment has been critical in flood assessment and vulnerability mapping. Emergency managers can employ airborne or satellite imagery to monitor the extent of disaster impact (Goodchild and Glennon, 2010) consistently and repetitively.
Previous attempts at modelling flood hazards have adopted several approaches. Such approaches include multi-criteria evaluation (Gazi et al., 2019; Gebre, 2015; Meyer et al., 2009; Rincón et al., 2018), probabilistic modelling approach (Apel et al., 2006; Budiyono et al., 2016), and neural networks (Kia et al., 2012; Paul and Das, 2014; Ruslan et al., 2013). Spatial logistic regression was applied in the Kelantan river basin, Malaysia, to map and delineate the flood-susceptible risk area (Pradhan and Lee, 2009)). Similarly, the model was used in spatial-temporal flood-risk modelling in semi-arid regions within the Limpopo Basin in Botswana (Kenabatho et al., 2008). Although these studies have improved our understanding of flood hazard extent and evolution, they predominantly rely on in situ measurements, which makes it difficult to predict flood hazards over fine spatial scales (Fang et al., 2013). Moreover, most ofthese studies are biased towards high-rainfall areas, based on the notion that floods are prevalent in areas that receive high rainfall (Shankman et al., 2006). Studies on flood hazard modelling in semi-arid and arid areas, especially in southern Africa, are scanty, mainly due to inadequate rain gauge networks and data gaps in rainfall (Kenabatho et al., 2008). However, with the increase in the intensity of rainfall events induced by climate change, floods are becoming common in arid regions such as the Beitbridge District of southern Zimbabwe (Moses and Ramotonto, 2018). In light of this, this study sought to predict spatial variations in flood hazard as a first step towards identifying flood-prone areas in the district.
MATERIALS AND METHODS
Description of the study area
The study area is a semi-arid region located in the southern part of the Beitbridge District. The district has 15 wards and covers an estimated land area of 567.681 km2 at an average elevation of 580 m amsl. The average annual temperature in Beitbridge is 23.0°C, and over the year the monthly average temperatures vary by 10.7°C. The rainfall averages 333 mm/year and the variation in the precipitation between the driest and wettest months is 69 mm/year. The area is semi-arid and falls under Agro-Ecological Region 5; hence it has low agriculture potential (Chikodzi et al., 2013). However, the study area is of ecological importance, with vital wildlife corridors (Tchakatumba et al., 2019). Figure 1 shows the study area, highlighting the key settlements, rivers and ward boundaries in the southern part of Beitbridge District, Zimbabwe.
Field data collection
In this study, GPS-based fieldwork was carried out from 15 August to 2 September 2017 to determine flooded and non-flooded areas. In the field, geographic coordinates of sampled areas were captured together with flood conditions using a handheld Garmin GPS with an overall positional accuracy level of <5 m.
To demarcate the flooded and non-flooded areas, the study made observations of signs of previous flooding, such as debris on trees and flood marks on buildings, and recorded their coordinates. In addition, the study consulted local communities on previously flooded and non-flooded areas in the respective wards. This exercise yielded flooded and non-flooded points that were further validated and complemented an inundation map derived from the Moderate Resolution Imaging Spectroradiometer (MODIS) imagery acquired on 16 February 2017 (Amarnath and Rajah, 2016). The date coincided with the peak flood period in the study area. The MODIS image was downloaded from the MODIS Rapid Response System (https://earthdata.nasa.gov/). A total of 413 points were recorded using the above-mentioned exercises and these were subsequently integrated with environmental variables to derive a flood hazard map of the study area.
Environmental variables
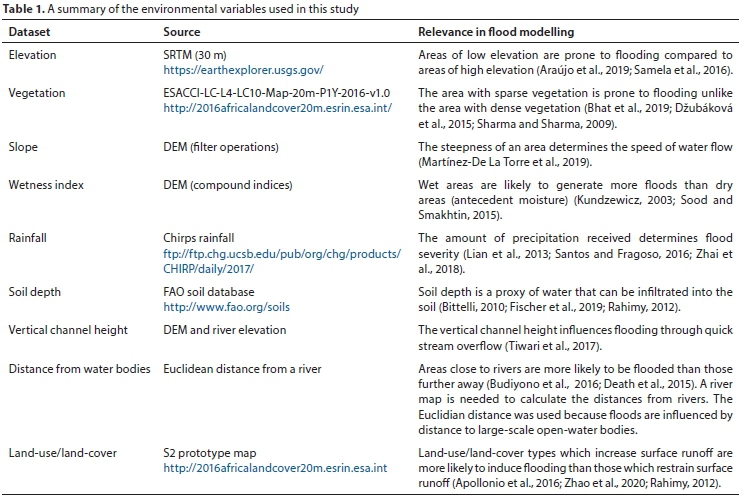
Table 1 provides an overview of the environmental variables used in predicting flood hazards in the study area. These include distance from water bodies, elevation, land-use/land-cover, rainfall, slope, soil depth, vegetation, vertical channel height and wetness index.
Data processing
A digital elevation model (DEM) was used to calculate flow direction, flow accumulation, and drainage density. Furthermore, the drainage network and catchment segmentation were extracted and some compound indices were calculated to provide further hydrological model input (Maathuis and Wang, 2006). Flow accumulation estimates the amount of water that is available for runoff that concentrates and accumulates in river channels (Roy and Mistri, 2013). The flow accumulation data were used in defining watershed boundaries and stream networks (Mutelo et al., 2013).
Slope
The slope was calculated as a percentage with a pixel size of 30 m using Eq. 1:

where:
HYP = the hypotenuse, DFDX = change in the horizontal direction and DFDY = change in the vertical direction. SLOPEPCT is the output map name of the slope map in percentages.
Wetness index
The wetness index shows the degree of wetness in an area. The wetness index was computed using the Integrated Land and Water Information System (ILWIS) considering the slope gradient (Beven and Kirkby, 1979) and the contributing area from DEM-hydroprocessing using Eq. 2:
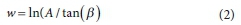
where: w = wetness index, A = contributing area, β = slope (radians) and tan (β) = tangent of the slope (β).
The wetness index provides the spatial distribution and zones of saturation (flooded areas) or runoff generation areas (Wu et al., 2016). The wetness index has been widely used to understand spatial scale effects on hydrological processes and to predict observed patterns of saturated areas (Panjabi et al., 2020).
Vertical channel distance
The DEM was used to derive the height of each place in the study area above or below the nearest channel bed level. The channel base elevations were interpolated to form a channel height layer that, if subtracted from the DEM, produces the vertical distance to the closest channel of each location in the study area (Murwira et al., 2005). To do this, a segment map of all rivers was converted to a point map. In the ILWIS environment, elevation values were then assigned to the point map of rivers using the map value command. The point map was then interpolated to get a channel height layer of the study area using the universal Kriging interpolation technique. Lastly, the channel height layer was subtracted from the DEM to produces the vertical channel distance.
Satellite image processing
Satellite rainfall
In this study, Climate Hazards Group Infrared Precipitation with Station (CHIRPS) rainfall data were used to determine the amount of rainfall received in the study area during the flooding event. CHIRPS is a land-only climatic database of precipitation, made available in early 2014. The image of 16 February 2017 recorded maximum rainfall and was used only for flood modelling, but the study used the rainfall CHIRPS images for the whole flood period from 11-17 February 2017. A 30 m resolution image covering the study area was downloaded from the CHIRPS website (ftp://ftp.chg.ucsb.edu/pub/org/chg/products/CHIRP/daily/2017/). The date coincided with Tropical Cyclone Dineo which passed over Southern Africa, with the maximum precipitation recorded on 16 February, which was thus the day considered for flood hazard modelling. The CHIRPS satellite rainfall products perform better than other products due to high spatio-temporal resolution (Hordofa et al., 2021) Rainfall was chosen as it is the key driver of riverine floods across the globe.
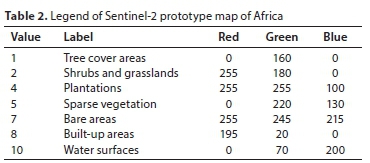
Land use and land cover
The Sentinel-2 land cover prototype map of Africa 2016 was accessed from http://2016africalandcover20m.esrin.esa.int. Prior to analysis, that data was projected to the same coordinate system as the study area to harmonize the datasets. The land-use and land-cover classes used in this study were tree cover areas, shrubs and grasslands, sparse vegetation, plantations, bare areas, built-up areas and water surfaces. Table 2 illustrates the legend for the Sentinel-2 prototype map for Africa adopted in this study. The land-use and land-cover management of the area is also one of the primary concerns in flood hazard mapping (Mousavi et al., 2019).
The land use only reflects the current use of the land, the pattern and type of use, which relates to soil stability and infiltration. Shashe River is considered to be one of the locations most vulnerable to flooding within the Limpopo Basin in Zimbabwe today. This is confirmed by the participatory land-use plan regarding the Shashe study area prepared by Murwira et al. (2006). Land cover such as vegetation, permanent grasslands and plantations restrains the surface runoff, hence reducing the chance of flooding (Sun et al., 2017). However, land-cover types such as buildings, roads, and informal settlements decrease the penetration capacity of the soil and increase the water runoff, which enhances flooding (Ouma and Tateishi, 2014). In the 2019 rainfall season, flash floods were experienced in Beitbridge town, mainly in the Dhulivadzimu suburb. According to the information collected by Mpho (2007), areas in the Limpopo Basin are regularly affected by flash floods during the rainy season.
Soils and soil depth data
Soil properties affect the evolution of runoff and should be considered as an important factor in flood hazard modelling. The chance of flood hazard increases with a decrease in soil infiltration capacity which causes an increase in surface runoff (Bombino et al., 2019). Soil texture has a large impact on flooding because it determines the rate at which water drains through saturated soil; water moves more freely through sandy soils than it does through clay soil. The soil data for the study was classified using the legend from the World Reference Base (WRB) spatial soil database. The area is dominated by Chromic luvisols and Eutric leptosols. Luvisols are characterised by high activity clays, high base status and the clay content increases at 60 cm depth. Leptosols are thin or with many coarse fragments (Morand, 2013).
Flood inundation area mapping
The Modis NDVI image was used to determine the flood inundation area. To detect water from the MODIS image, water mask index values were adopted from Nharo et al. (2019) and implemented in a GIS. Specifically, water pixels were extracted from the blue band using a threshold reflectance value of 154, 180-200 in the green band and less than 200 in the red band. To produce the flood extent map, the following algorithm was used: Flood = IFF (water > 0.5, 1, 0). The IFF command was used to produce a binary map that shows flood areas with a value of 1 and areas without flood with a value of 0, using a condition operation that states that if the water is greater than 0.5 this means there is a flood. A binary map was then produced with 1 indicating an area with water and 0 the opposite. Next, the binary map was converted to a point map that uses a Bool domain, to specify the colour for true and false points of floods before being integrated with field data. The map value function in ILWIS was used to append the values of the environmental variables to the point map.
Testing for multicollinearity
Prior to analysis, the environmental variables were tested for correlation using the 'corrplot' function in R. The corrplot function creates a graphical display of a correlation matrix, highlighting the most correlated variables (Wei, 2009). The correlation matrix is reordered according to the correlation coefficients using the 'hclust' method. Correlation coefficients describe the strength and direction of an association between variables (Schober and Schwarte, 2018). The correlation matrix in Fig. A1 (Appendix) illustrates that all variables were not highly correlated (r < 0.81). Therefore, all the variables were used in the preliminary prediction of flood hazard before the non-significant predictors were excluded from the final model.
Flood hazard modelling
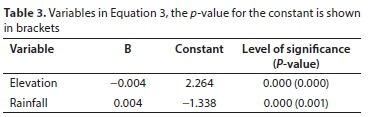
Logistic regression was used to model flood hazards using the eight environmental variables together with field data. We used 70% of our data to calibrate a model and the remaining 30% was used for validation. Prior to developing the final model, we assessed the significance of each variable to the model. Variables that did not significantly predict flood occurrence (p > 0.05) were removed. This was done to reduce the complexity of the model and enhance parsimony. The final logistic regression model was then computed using two variables i.e., elevation and rainfall. These two variables significantly predicted the flood hazard at a 95% confidence interval in the study area.
The final spatial logistic regression model took the form:

where: p is the probability of flooding, a1 and a2 are regression constants, b1 and b2are the slopes for the environmental variable, and x1 and x2are the environmental variables (e.g. elevation and rainfall). Table 3 illustrates the variables in Eq. 3, elevation and rainfall, with the p-value for the constant showing the level of significance.
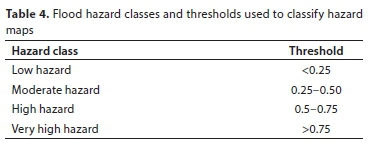
Using the final logistic regression model (Eq. 3), a continuous probability map was generated. The map was classified into 4 flood hazard classes, which are 'low,' 'moderate', high' and 'very high' based on thresholds shown in Table 4.
Model validation
The flood hazard model was validated using ground control points of the flooded and non-flooded areas collected during the field visits. Using this data, the flood hazard model was validated using the 'area under the curve' (AUC). AUC measures how well predictions are ranked, rather than their absolute values. Figure A2 (Appendix) shows the ROC curve showing the AUC value.
The AUC is classification-threshold-invariant (Zelenina and Prata, 2019). It measures the quality of the model's predictions. The model diagnostics and validation were performed with the receiver operating characteristics (ROC) curve and a k-fold cross-validation procedure (Ciocan et al., 2020). A k-value of 10 was used to assess the goodness of fit of the model. The cross-validation procedure was repeated k times with 70% calibration dataset and 30% validation dataset; k = 10 was chosen because it is adequate for models using a relatively large dataset - this study uses 413 points (Coelho et al., 2013). Finally, a bootstrapped cross-validation procedure was used to calculate the AUC. AUC was 0.984 suggesting that the model developed here had relatively high predictive power.
RESULTS
Figure 2 illustrates the spatial variations in flood hazard across the study area. It can be observed that flood hazard decreases with increasing distance from rivers. In addition, most of the wards are highly susceptible to flooding with a p > 0.5 probability of flooding.

Figure 3 shows that Wards 13 and 14 have the largest area under a very high hazard class, which covers approximately 116 km2 and 112 km2, respectively. Overall, 77.4% of the study area is deemed flood-prone, as virtually all the wards fall between the moderate to very high hazard classes. In contrast, only 22.6% of the area falls under the low hazard class. Low hazard areas are particularly predominant in Wards 5, 7, 8 and 10.
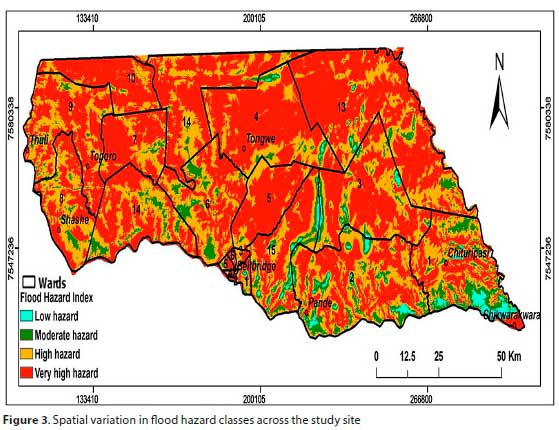
Figure 4 illustrates the proportion of area under each ward that is susceptible to floods. Wards 13 and 14 have the largest area that is susceptible to floods while Wards 1, 2, 3 and 4 have the largest area under high hazard. Wards 5, 7, 8 and 10 seem to be less susceptible to flood hazards.

DISCUSSION
The main goal of this study was to predict spatial variations in flood hazards as a first step towards identifying flood-prone areas in the Beitbridge District. The results indicate that the area is highly susceptible to floods, with a greater proportion of approximately 55.8% falling within the high to very high hazard classes. This is not normally expected of arid and semi-arid areas like Beitbridge, which receives erratic rainfall ranging from 180 to 420 mm per year (Moyo, and Love, 2006). However, given projections of extreme rainfall events as a result of climate change, floods are likely to increase in these semi-arid regions. This is in line with studies that project an increase in climate-related extreme events such as floods (Easterling et al., 2000). Beitbridge received almost all of its expected rainfall within 1 week in the 2017-2018 rainfall season (Nyikahadzoi, 2021). Due to climate change, the spatial distribution of rainfall in the semi-arid regions, particularly the Limpopo Province, has high levels of uncertainty (Shewmake, 2011). Thus, this study provides important insights into flood hazard modelling in the southern parts of Beitbridge District, Limpopo Basin.
The findings of this research show that elevation and rainfall significantly (p < 0.05) predicted flood hazard in southern parts of Beitbridge District; model accuracy was indicated by an AUC of 0.984. Previous studies on flood hazard modelling have demonstrated the importance of elevation and rainfall in flood prediction and flood risk mapping (Ouma and Tateishi, 2014; Samanta et al., 2018). As Beitbridge is a low-lying area, it is not surprising that elevation is a key variable in predicting flood hazards and the area also receives erratic heavy rainfalls which trigger floods. The study is consistent with the findings of Dapper (2011), who observed that rainfall and elevation are the greatest contributing factors in flood generation. Thus, this study also emphasizes the importance of elevation and rainfall in predicting the flood hazard in the southern parts of the Beitbridge District. These results also concur with Madamombe (2014), who identified the same factors to be relevant for predicting flood hazards in Tsholotsho District, Zimbabwe. Similarly, Shafapour Tehrany et al. (2017) applied bivariate probability and logistic regression in flood modelling in arid regions of Saudi Arabia and identified the terrain information and rainfall as the most significant factors in flood generation. In contrast, a study by Nharo et al. (2019) found the distance from rivers predicted flood hazards better than other factors in the Zambezi Basin. Murwira and Schmidt-Murwira (2005) also considered the distance from river networks as the significant factor which explains flooding in Muzarabani.
This study emphasises the need for flood hazard modelling in arid to semi-arid regions as these have been given less attention compared to humid areas. This study suggests that these dry regions could be even more susceptible to flooding than previously thought. Moreover, this study highlights a variation from some of the flood modelling studies (for example, by Grek and Zhuravlev, 2020) since flood hazard modelling is more common in humid, high-rainfall environments.
CONCLUSIONS AND RECOMMENDATIONS
The main objective of the study was to predict flood hazards in the southern parts of the Beitbridge District. The development of a flood hazard map for the southern parts of the Beitbridge District was carried out in a GIS environment. The general conclusion that can be drawn from the study is that the elevation and rainfall significantly (p < 0.05) predict flood hazards for the study area. The results demonstrated two complementary flood hazard maps which represent a useful combined tool to visually understand which areas could be most affected by floods (Poretti and Amicis, 2011). The approach presented is an effective method of hazard mapping and delimitation of flood-prone zones in the study area. The results of this study give insights into priority areas for flood management. Spatial analytical techniques used in this study enhance the ability of disaster risk management in the Limpopo Basin to provide rural communities with early warning of extreme flood events (Asante et al., 2007). However, the flood hazard maps show the predicted spatial distribution of flood hazard occurrences and do not give information regarding its temporal probability (Shafapour et al., 2019). The study successfully predicts spatial variations in flood hazard as a first step towards identifying flood-prone areas in the southern part of Beitbridge District. Future studies should explore other methods beyond the logistic regression used to simulate flood hazards in the study area. A particular challenge for this model is the application to semi-arid regions because of high variability in rainfall, sparse network of rain gauges and potential data quality problems. However, it will be useful if future studies could use ensemble and hybrid models to model flood hazards.
ACKNOWLEDGEMENTS
Special thanks to workmates at IRC for providing useful information and help in data collection.
FUNDING
This research was financially supported by the International Rescue Committee (IRC) through the disaster risk reduction (DRR) project in the Beitbridge District.
AUTHOR CONTRIBUTIONS
Webster Gumindoga (WG) initiated the original idea of the study. Lloyd Chikwiramakomo (LC) fully contributed to the analysis and interpretation of results and was responsible for data acquisition and drafting of the manuscript. Tawanda Winmore Gara (TWG) was responsible for model validation, editing the manuscript and support the research work. Munyaradzi Davis Shekede (MDS) and WG edited the draft manuscript and supervised the research work.
DISCLOSURE STATEMENTS
The authors declare no conflict of interest.
REFERENCES
ADHIKARI P, HONG Y, DOUGLAS KR, KIRSCHBAUM DB, GOURLEY J, ADLER R and BRAKENRIDGE GR (2010) A digitized global flood inventory (1998-2008): compilation and preliminary results Nat. Hazards. 55 405-422. https://doi.org/10.1007/s11069-010-9537-2 [ Links ]
APEL H, THIEKEN AH, MERZ B and BLÖSCHL G (2006) A probabilistic modelling system for assessing flood risks. Nat. Hazards. 38 (1-2) 79-100. https://doi.org/10.1007/s11069-005-8603-7 [ Links ]
APOLLONIO C, BALACCO G, NOVELLI A, TARANTINO E and PICCINNI AF (2016) Land-use change impact on flooding areas: The case study of Cervaro Basin (Italy). Sustainability. 8 (10) 8-10. https://doi.org/10.3390/su8100996 [ Links ]
ARAÚJO PVN, AMARO VE, SILVA RM and LOPES AB (2019) Delimitation of flood areas based on a calibrated DEM and geoprocessing: A case study on the Uruguay River, Itaqui, southern Brazil. Nat. Hazards Earth Syst. Sci. 19 (1) 237-250. https://doi.org/10.5194/nhess-19-237-2019 [ Links ]
ASANTE KO, MACUACUA RD, ARTAN GA, LIETZOW RW and VERDIN JP (2007) Developing a flood monitoring system from remotely sensed data for the Limpopo basin. IEEE Trans. Geosci. Remote Sens. 45 (6) 1709-1714 https://doi.org/10.1109/TGRS.2006.883147 [ Links ]
BEVEN KJ and KIRKBY MJ (1979) A physically based, variable contributing area model of basin hydrology. Hydrol. Sci. Bull. 24 (1) 43-69. https://doi.org/10.1080/02626667909491834 [ Links ]
BHAT MS, ALAM A, AHMAD S, FAROOQ H and AHMAD B (2019) Flood hazard assessment of upper Jhelum basin using morphometric parameters. Environ. Earth Sci. 78 54. https://doi.org/10.1007/s12665-019-8046-1 [ Links ]
BITTELLI M (2010) Measuring soil water potential for water management in agriculture: A review. Sustainability. 2 (5) 12261251. https://doi.org/10.3390/su2051226 [ Links ]
BOMBINO G, DENISI P, GÓMEZ JA and ZEMA DA (2019) Water infiltration and surface runoff in steep clayey soils of olive groves under different management practices. Water. 11 (2) 240. https://doi.org/10.3390/w11020240 [ Links ]
BUDIYONO Y, AERTS JCJH, TOLLENAAR D and WARD PJ (2016) River flood risk in Jakarta under scenarios of future change. Nat. Hazards Earth Syst. Sci. 16 (3) 757-774. https://doi.org/10.5194/nhess-16-757-2016 [ Links ]
CHARRUA AB, PADMANABAN R, CABRAL P, BANDEIRA S and ROMEIRAS MM (2021) Impacts of the tropical cyclone Idai in Mozambique: A multi-temporal Landsat satellite imagery analysis. Remote Sens. 13 (2) 201. https://doi.org/10.3390/rs13020201 [ Links ]
CHATIZA K (2019) Cyclone Idai in Zimbabwe: An analysis of policy implications for post-disaster institutional development to strengthen disaster risk management. Oxfam, Oxford. 30 pp. https://doi.org/10.21201/2019.5273 [ Links ]
CHIKODZI D, HARDLIFE Z, FARAI MALVERN S and TALENT M (2013) Reclassification of agro-ecological zones in Zimbabwe -the rationale, methods and expected benefits: The case of Masvingo province. J. Sustainable Dev. Afr. 15 (1) 104-116. [ Links ]
CIOCAN A, AL HAJJAR N, GRAUR F, OPREA VC, CIOCAN RA and BOLBOACÃ SD (2020) Receiver operating characteristic prediction for classification: Performances in cross-validation by example. Mathematics. 8 (10) 1741. https://doi.org/10.3390/math8101741 [ Links ]
COELHO R, INFANTE P and SANTOS MN (2013) Application of generalized linear models and generalized estimation equations to model at-haulback mortality of blue sharks captured in a pelagic longline fishery in the Atlantic Ocean. Fish. Res. 145 (August) 6675. https://doi.org/10.1016/j.fishres.2013.02.010 [ Links ]
DEATH RG, FULLER IC and MACKLIN MG (2015) Resetting the river template: The potential for climate-related extreme floods to transform river geomorphology and ecology. Freshwater Biol. 60 (12) 2477-2496. https://doi.org/10.1111/fwb.12639 [ Links ]
DEMIR V and KISI O (2016) Flood hazard mapping by using geographic information system and hydraulic model: Mert River, Samsun, Turkey. Adv. Meteorol. 2016 Article ID 4891015. https://doi.org/10.1155/2016/4891015 [ Links ]
DËUBÁKOVÁ K, MOLNAR P, SCHINDLER K and TRIZNA M (2015) Monitoring of riparian vegetation response to flood disturbances using terrestrial photography. Hydrol. Earth Syst. Sci. 19 (1) 195208. https://doi.org/10.5194/hess-19-195-2015 [ Links ]
EASTERLING DR, EVANS JL, GROISMAN PY, KARL TR, KUNKEL KE and AMBENJE P (2000) Observed variability and trends in extreme climate events: a brief review. Bull. Am. Meteorol. Soc. 81 (3) 417-425. https://doi.org/10.1175/1520-0477(2000)081<0417:OVATIE>2.3.CO;2 [ Links ]
FANG J, DU J, XU W, SHI P, LI M and MING X (2013) Spatial downscal-ing of TRMM precipitation data based on the orographically effect and meteorological conditions in a mountainous area. Adv. Water Resour. 61 42-50. https://doi.org/10.1016/j.advwatres.2013.08.011 [ Links ]
FISCHER C, LEIMER S, ROSCHER C, RAVENEK J, DE KROON H, KREUTZIGER Y, BAADE J, BEBLER H, EISENHAUER N, WEIGELT A, MOMMER L, LANGE M, GLEIXNER G, WILCKE W, SCHRÖDER B and HILDEBRANDT A (2019) Plant species richness and functional groups have different effects on soil water content in a decade-long grassland experiment. J. Ecol. 107 (1) 127-141. https://doi.org/10.1111/1365-2745.13046 [ Links ]
FORMETTA G and FEYEN L (2019) Empirical evidence of declining global vulnerability to climate-related hazards. Glob. Environ. Change. 57 (July 2019) 101920. https://doi.org/10.1016/j.gloenvcha.2019.05.004 [ Links ]
GAZI Y, ISLAM A and HOSSAIN S (2019) flood-hazard mapping in a regional scale way forward to the future hazard atlas in Bangladesh. Malaysian J. Geosci. 3 (1) 1-11. http://doi.org/10.26480/mjg.01.2019.01.11 [ Links ]
GEBRE SLGY (2015) Flood hazard assessment and mapping of flood inundation area of the Awash River Basin in Ethiopia using GIS and HEC-GeoRAS/HEC-RAS Model. J. Civ. Environ. Eng. 5 (4) 1000178. https://doi.org/10.4172/2165-784X.1000179 [ Links ]
GOODCHILD MF and GLENNON JA (2010) Crowdsourcing geographic information for disaster response: A research frontier. Int. J. Dig. Earth 3 (3) 231-241. https://doi.org/10.1080/17538941003759255 [ Links ]
GREK E and ZHURAVLEV S (2020) Simulation of rainfall-induced floods in small catchments (The Polomet' river, north-west Russia) using rain gauge and radar data. Hydrology. 7 (4) 92. https://doi.org/10.3390/hydrology7040092 [ Links ]
HORDOFA AT, LETA OT, ALAMIREW T, KAWO NS and CHUKALLA AD (2021) Performance evaluation and comparison of satellite-derived rainfall datasets over the Ziway lake basin, Ethiopia. Climate 9 (7) 113. https://doi.org/10.3390/cli9070113 [ Links ]
KENABATHO PK, MCINTYRE NR and WHEATER HS (2008) Application of generalised linear models for rainfall simulations in semi-arid areas: A case study from the Upper Limpopo basin in northeast Botswana. BHS 10th National Hydrology Symposium, Exeter, 2008. https://www.researchgate.net/publication/266184721_Applicationofgeneralisedlinearmodelsforrainfallsimulations_in_semi_arid_areas_A_case_study_from_the_Upper_Limpopo_basin_in_north_east_Botswana [ Links ]
KIA MB, PIRASTEH S, PRADHAN B, MAHMUD AR, NOR W, SULAIMAN A and MORADI A (2012) An artificial neural network model for flood simulation using GIS: Johor River Basin, Malaysia. Env. Earth Sci. 67 251-264. https://doi.org/10.1007/s12665-011-1504-z [ Links ]
KUNDZEWICZ ZW (2003) Extreme precipitation and floods in the changing world. IAHS-AISH Publication, No. 281. 32-39. [ Links ]
LI S, YANG H, LACAYO M, LIU J and LEI G (2018) Impacts of land-use and land-cover changes on water yield: A case study in Jing-Jin-Ji, China. Sustainability. 10 (4) 960. https://doi.org/10.3390/su10040960 [ Links ]
LIAN JJ, XU K and MA C (2013) The joint impact of rainfall and tidal level on flood risk in a coastal city with a complex river network: A case study of Fuzhou City, China. Hydrol. Earth Syst. Sci. 17 (2) 679-689. https://doi.org/10.5194/hess-17-679-2013 [ Links ]
MAATHUIS BHP and WANG L (2006) Digital elevation modelbased hydro-processing. Geocarto Int. 21 (1) 21-26. https://doi.org/10.1080/10106040608542370 [ Links ]
MADAMOMBE EK (2004) Zimbabwe: Flood management practices selected flood prone areas: Zambezi Basin. Associated Programme Flood Management Technical Document No. 1. 2nd Edition. World Meteorological Organisation, Geneva. [ Links ]
MARTÍNEZ-DE LA TORRE A, BLYTH EM and WEEDON GP (2019) Using observed river flow data to improve the hydrological functioning of the JULES land surface model (vn4.3) used for regional coupled modelling in Great Britain (UKC2). Geosci. Model Dev. 12 765-784. https://doi.org/10.5194/gmd-12-765-2019 [ Links ]
MEYER V, SCHEUER S and HAASE D (2009) A multicriteria approach for flood risk mapping exemplified at the Mulde River, Germany. Nat. Hazards. 48 17-39. https://doi.org/10.1007/s11069-008-9244-4 [ Links ]
MORAND DT (2013) The world reference base for soils (WRB) and Soil Taxonomy: An appraisal of their application to the soils of the Northern Rivers of New South Wales. Soil Res. 51 (3) 167-181. https://doi.org/10.1071/SR12144 [ Links ]
MOSES O and RAMOTONTO S (2018) Assessing forecasting models on prediction of the tropical cyclone Dineo and the associated rainfall over Botswana. Weather Clim. Extremes. 21 102-109. https://doi.org/10.1016/j.wace.2018.07.004 [ Links ]
MOUSAVI SM, ROOSTAEI S and ROSTAMZADEH H (2019) Estimation of flood land use/land cover mapping by regional modelling of flood hazard at sub-basin level case study: Marand basin. Geomatics Nat. Hazards Risk. 10 (1) 1155-1175. https://doi.org/10.1080/19475705.2018.1549112 [ Links ]
MOYO R, LOVE D, MUL M, MUPANGWA W and TWOMLOW S (2006) Impact and sustainability of low-head drip irrigation kits, in the semi-arid Gwanda and Beitbridge Districts, Mzingwane Catchment, Limpopo Basin, Zimbabwe. Phys. Chem. Earth A/B/C. 31 (15-16) 885-892. https://doi.org/10.1016/j.pce.2006.08.020 [ Links ]
MULUGETA G, DURRHEIM R, AYONGHE S, DABY D, DUBE OP, GUDYANGA F and LUCIO F(2007) ICSU ROA's science plan to address natural and human-induced environmental hazards and disasters in sub-saharan Africa. International Council for Science Regional Office for Africa (ICSU ROA). [ Links ]
MURWIRA A and SCHMIDT-MURWIRA KS (2005) A GIS and remote sensing based flood warning system for Muzarabani: Zambezi Catchment. Department of Geography and Environmental Science, University of Zimbabwe. [ Links ]
MUTELO MA (2013) An understanding of variations in the area extent of Lake Lyambezi: Perspective for water resources management. MSc thesis, University of Zimbabwe. http://ir.uz.ac.zw/bitstream/handle/10646/1395/UZ_IWRM_MUTELO_Thesis_2013_Final.pdf;jsessionid=708A8B9DCBFEEF886D0555202F418EC2?sequence=1 [ Links ]
NHARO T, MAKURIRA H and GUMINDOGA W (2019) Mapping floods in the Middle Zambezi Basin using Earth observation and hydrological modelling techniques. Phys. Chem. Earth Parts A/B/C. 114 102787. https://doi.org/10.1016/j.pce.2019.06.002 [ Links ]
NYIKAHADZOI PK (2021) Drought hazard risk and humanitarian impact analysis and inventorisation of forecast models in Zimbabwe. Final Report, March 2021. RFQ Forecast Based Consultancy RFT No 258567. https://www.anticipation-hub.org/Documents/Reports/WHH_ZWE_Drought_Hazard_Risk_and_Humanitarian_Impact_Analysis_and_Inventorisation_of_Forecast_Models.pdf [ Links ]
OUMA YO and TATEISHI R (2014) Urban flood vulnerability and risk mapping using integrated multi-parametric AHP and GIS: Methodological overview and case study assessment. Water. 6 (6) 1515-1545. https://doi.org/10.3390/w6061515 [ Links ]
PANJABI K, RUDRA R, GOEL P, DAGGUPATI P, SHRESTHA NK, SHUKLA R, ZHANG B and ALLATAIFEH N (2020) Mapping runoff generating areas using the AGNPS-VSA model. Hydrol. Sci. J. 65 (13) 2224-2232. https://doi.org/10.1080/02626667.2020.1798007 [ Links ]
PAUL A and DAS P (2014) Flood prediction model using artificial neural network. Int. J. Comput. Appl. Technol. Res. 3 (7) 473-478. https://doi.org/10.7753/ijcatr0307.1016 [ Links ]
PORETTI I and DE AMICIS M (2011) An approach for flood hazard modelling and mapping in the medium Valtellina. Nat. Hazards Earth Syst. Sci. 11 1141-1151. https://doi.org/10.5194/nhess-11-1141-2011 [ Links ]
PRADHAN B and LEE S (2009) Delineation of landslide hazard areas on Penang Island, Malaysia, by using frequency ratio, logistic regression, and artificial neural network models. Environmental Earth Sciences, on-line first. https://doi.org/10.1007/s12665-009-0245-8 [ Links ]
RAHIMY P (2012) Effects of soil depth spatial variation on runoff simulation, using the Limburg Soil Erosion Model (LISEM), a case study in Faucon Catchment, France. Soil Water Res. 7 52-63. https://doi.org/10.17221/25/2011-SWR [ Links ]
RINCÓN D, KHAN U and ARMENAKIS C (2018) Flood risk mapping using GIS and multi-criteria analysis: a greater Toronto area case study. Geosciences. 8 (8) 275. https://doi.org/10.3390/geosciences8080275 [ Links ]
ROY S and MISTRI B (2013) Estimation of peak flood discharge for an ungauged river: a case study of the Kunur River, West Bengal. Geogr. J. 2013. Article ID 214140. https://doi.org/10.1155/2013/214140 [ Links ]
RUSLAN FA, ZAKARIA NK and ADNAN R (2013) Flood modelling using artificial neural network. Proc. 2013 IEEE 4th Control and System Graduate Research Colloquium ICSGRC 2013, 19-20 August 2013, Shah Alam. 116-120. https://doi.org/10.1109/ICSGRC.2013.6653287 [ Links ]
SAMANTA S, PAL DK and PALSAMANTA B (2018) Flood susceptibility analysis through remote sensing, GIS and frequency ratio model. Appl. Water Sci. 8 Article No. 66. https://doi.org/10.1007/s13201-018-0710-1 [ Links ]
SAMELA C, MANFREDA S, DE PAOLA F, GIUGNI M, SOLE A and FIORENTINO M (2016) DEM-based approaches for the delineation of flood-prone areas in an ungauged basin in Africa. J. Hydrol. Eng. 21 (2) 1-10. https://doi.org/10.1061/(ASCE)HE.1943-5584.0001272 [ Links ]
SANTOS M and FRAGOSO M (2016) Precipitation thresholds for triggering floods in the Corgo basin, Portugal. Water. 8 (9) 376. https://doi.org/10.3390/w8090376 [ Links ]
SCHOBER P and SCHWARTE LA (2018) Correlation coefficients: Appropriate use and interpretation. Anesth Analg. 126 (5) 17631768. https://doi.org/10.1213/ANE.0000000000002864 [ Links ]
SHAFAPOUR TEHRANY M, KUMAR L, NEAMAH JEBUR M and SHABANI F (2019) Evaluating the application of the statistical index method in flood susceptibility mapping and its comparison with frequency ratio and logistic regression methods. Geomatics Nat. Hazards Risk. 10 (1) 79-101. https://doi.org/10.1080/19475705.2018.1506509 [ Links ]
SHAFAPOUR TEHRANY M, SHABANI F, NEAMAH JEBUR M, HONG H, CHEN W and XIE X (2017) GIS-based spatial prediction of flood-prone areas using standalone frequency ratio, logistic regression, the weight of evidence and their ensemble techniques. Geomatics Nat. Hazards Risk. 8 (2) 1538-1561. https://doi.org/10.1080/19475705.2017.1362038 [ Links ]
SHANKMAN D, KEIM BD and SONG J (2006) Flood frequency in China's Poyang Lake region: Trends and teleconnections. Int. J. Climatol. 26 (9) 1255-1266. https://doi.org/10.1002/joc.1307 [ Links ]
SHARMA UC and SHARMA V (2009) Assessment of flood events in the data-sparse Brahmaputra Basin in northeast India. IAHS-AISH Publication 333. 220-226. [ Links ]
SHEWMAKE S (2011) Vulnerability and the impact of climate change in South Africa's Limpopo River Basin. (October 14, 2008). IFPRI Discussion Paper No. 00804. https://doi.org/10.2139/ssrn.1289844 [ Links ]
SOOD A and SMAKHTIN V (2015) Revue des modeles hydrologiques globaux. Hydrol. Sci. J. 60 (4) 549-565. https://doi.org/10.1080/02626667.2014.950580 [ Links ]
SPALIVIERO M, DE DAPPER M and MALÓ S (2014) Flood analysis of the Limpopo River basin through past evolution reconstruction and a geomorphological approach. Nat. Hazards Earth Syst. Sci. 14 (8) 2027-2039. https://doi.org/10.5194/nhess-14-2027-2014 [ Links ]
SUN L, YANG L, HAO L, FANG D, JIN K and HUANG X (2017) Hydrological effects of vegetation cover degradation and environmental implications in a semiarid temperate Steppe, China. Sustainability. 9 (2) 281. https://doi.org/10.3390/su9020281 [ Links ]
TCHAKATUMBA PK, GANDIWA E, MWAKIWA E, CLEGG B and NYASHA S (2019) Does the CAMPFIRE programme ensure economic benefits from wildlife to households in Zimbabwe? Ecosyst. People. 15 (1) 119-135. https://doi.org/10.1080/26395916.2019.1599070 [ Links ]
TIWARI T, LIDMAN F, LAUDON H, LIDBERG W and ÃGREN AM (2017) GIS-based prediction of stream chemistry using landscape composition, wet areas, and hydrological flow pathways. J. Geophys. Res. Biogeosci. 122 (1) 65-79. https://doi.org/10.1002/2016JG003399 [ Links ]
UDDIN K, RAJ GURUNG, D, GIRIRAJ A and SHRESTHA B (2013) Application of Remote Sensing and GIS for Flood Hazard Management: A Case Study from Sindh Province, Pakistan American Journal of Geographic Information System. 2 (1) 1-5. https://doi.org/10.5923/j.ajgis.20130201.01 [ Links ]
WAHLSTROM M and GUHA-SAPIR D (2015) The human cost of weather-related disasters 1995-2015. UNISDR, Geneva. https://reliefweb.int/sites/reliefweb.int/files/resources/COP21_WeatherDisastersReport_2015_FINAL.pdf [ Links ]
WEI T (2009) An Introduction to Matrix Visualization & corrplot Package. The 2nd Chinese R Conference. URL: https://uploads.cosx.org/2009/12/An-Introduction-to-Matrix-Visualization-and-corrplot-Package.pdf. 41 pp. [ Links ]
WU Y, GIRI S and QIU Z (2016) Understanding the spatial distribution of hydrologic sensitive areas in the landscape using soil topographic index approach. Int. Soil Water Conserv. Res. 4 (4) 278-283. https://doi.org/10.1016/j.iswcr.2016.10.002 [ Links ]
ZELENINA M and PRATA D (2019) Machine learning with electroencephalography features for precise diagnosis of depression subtypes. URL: http://arxiv.org/abs/1908.11217 [ Links ]
ZHAI X, GUO L, LIU R and ZHANG Y (2018) Rainfall threshold determination for flash flood warning in mountainous catchments with consideration of antecedent soil moisture and rainfall pattern. Nat. Hazards. 94 605-625. https://doi.org/10.1007/s11069-018-3404-y [ Links ]
ZHAO L, HUANG W, CHEN J, DONG Y, REN B and GENG Y (2020) Land use/cover changes in the Oriental migratory locust area of China: Implications for ecological control and monitoring of locust area. Agric. Ecosyst. Environ. 303 107110. https://doi.org/10.1016/j.agee.2020.107110 [ Links ]
 Correspondence:
Lloyd Chikwiramakomo
Email: lloydchikwiramakomo@gmail.com
Received: 14 January 2020
Accepted: 27 September 2021
APPENDIX


