


Services on Demand
Article
 English (pdf)
 Article in xml format
 Article references
Indicators

Related links
-
 Cited by Google
 -
 Similars in Google
Share

 Permalink
Water SA
On-line version ISSN 1816-7950
Print version ISSN 0378-4738
Water SA vol.47 n.4 Pretoria Oct. 2021
http://dx.doi.org/10.17159/wsa/2021.v47.i4.3873
RESEARCH PAPER
Optimization of brómate adsorption onto Fe-CNTs nanocomposite using response surface methodology
Deeksha RanjanI, II; Moonis Ali KhanIII; Marta OteroIV; Masoom Raza SiddiquiIII; Shareefa Ahmed AlshaeefIII
IDepartment of Applied Sciences and Humanities, Faculty of Engineering and Technology, Rama University, Mandhana, Kanpur-209217, U.P., India
IIDepartment of Chemistry, Indian Institute of Technology, Banaras Hindu University, Varanasi 221005, U.P., India
IIIChemistry Department, College of Science, King Saud University, Riyadh 11451, Saudi Arabia
IVCESAM (Centre for Environmental and Marine Studies), Department of Environment and Planning, University of Aveiro, Campus de Santiago, 3810-193 Aveiro, Portugal
ABSTRACT
This study was aimed at employing response surface methodology (RSM) for optimization of process variables and identifying optimal conditions for the adsorption of bromate (BrO3-) from contaminated water using multi-walled carbon nanotubes, based on iron hydr(oxide), Fe-CNTs nanocomposite. Fifteen experimental runs were conducted in batch mode to study the effect of individual as well as interactive process variables, i.e., pH, BrO3- initial concentration, and adsorbent dose, on the removal of BrO3- using Box-Behnken design (BBD) of RSM. The coefficient of determination (R2) at 98.34% indicated a good agreement between actual and predicted values. The main effect and contour plot were drawn to obtain the independent and interactive effect of operational variables on BrO3- uptake. A process optimization curve was drawn to determine the optimum operating conditions that lead to a desirable response. The optimum conditions for BrO3- adsorption using Fe-CNTs nanocomposite were found to be pH 2.0, initial BrO3- concentration of 10.0 mg/L, and adsorbent dose of 0.010 g per 50 mL solution.
Keywords: Fe-CNTs nanocomposite, BrO3-, adsorption, Box-Behnken design, optimization
INTRODUCTION
Freshwater scarcity and lack of quality have become issues of increasing concern. Adequate wastewater management has thus become essential to protect and ensure a safe drinking water supply and for the preservation of public health (Naidoo and Olaniran, 2013). Wastewater reclamation and reuse have been recognized as effective management tools for water conservation and pollution control. Among the available processes, ozonation has been extensively used for reclamation and reuse of wastewater (Zhang et al., 2021). Ozone is one of the most powerful oxidants for either organic or inorganic compounds and is also able to inactivate even the most resistant pathogenic microorganisms; thus ozone treatments have been used since the 1970s to meet discharge regulations for coliforms and achieve virus inactivation in effluents of sewage treatment plants (STPs) (Ruffino et al., 2020). Ozonation has received further attention as a tertiary treatment due to the necessity of STPs upgrading in order to accomplish the oxidation of endocrine disruptors (EDC), and pharmaceuticals and personal care products (PPCP) (Naidoo and Olaniran, 2013; Ruffino et al., 2020). Furthermore, ozone sanitation has been long used at municipal water purification facilities and bottled water plants (Loeb et al., 2012; Alsohaimi et al., 2015; Delpla et al., 2014). Nonetheless, if raw water contains bromide (Br-), bromate (BrO3-) will be formed during water ozonation (Aljundi, 2011; Wang and Chen, 2014) via complex mechanisms involving molecular ozone (O3) and hydroxyl radical (OH«) reactions (Dorevitch et al., 2020). BrO3- is a toxic by-product with carcinogenic effects in humans - its maximum permitted concentration in drinking waters being 10 ug/L (Alsohaimi et al., 2015). The presence of BrO3- in water is especially worrying since, unlike other by-products, it is not biodegradable, so biological treatments are not efficient in its removal (Aljundi, 2011).
Different physico-chemical treatments, viz., electrochemical deposition (Kimbrough and Suffet, 2002), zero-valent metal reduction (Wang et al., 2009; Huang et al., 2020), heterogeneous photocatalysis (Morais et al., 2021), ion-exchange (Wïniewski et al., 2015), catalytic hydrogenation (Zhou et al., 2015), reverse osmosis (Gyparakis and Diamadopoulos, 2007), nanofiltration (Lin et al., 2020) and adsorption (Zhang et al., 2015; Ji et al., 2017), have been studied for the removal of BrO3-from water. Amongst them, adsorptive processes are especially advantageous due to their relatively low implementation and operational costs and because they avoid the generation of transformation products with unknown toxicity effects. Activated carbon (Zhang et al., 2015; Chen et al., 2017), a widely used adsorbent in water treatment applications, and other adsorbent materials, such as biochar, zeolites, materials with layers of MnO2, TiO2, CeO2 on their surfaces, and polymeric resins (Ji et al., 2017; He et al., 2012; Alsewaileh et al., 2019; Yang et al., 2019; Barlokova et al., 2017), have been tested for the removal of BrO3- from water.
Carbon nanotubes (CNTs), which were first discovered in the 90s, are materials with advantageous physical and chemical properties over other adsorbents, such as high surface/volume ratio or high chemical and thermal stability (Herrero-Latorre et al., 2015; Fiyadh et al., 2019). In the past decade, magnetic CNTs (Fe-CNTs) have emerged as promissory materials for real-scale applications, since they are cost effective, have high adsorption capacity, easy separation and enhanced stability (Alsohaimi et al., 2015; Tang et al., 2021). However, adsorption onto Fe-CNTs, as for most adsorbents, is highly influenced by operational factors, viz. pH, pollutant concentration, temperature and adsorbent dose (Alsohaimi et al., 2015).
Response surface methodology (RSM), a statistical tool, is an economically efficient experimental procedure for optimizing a complex process. RSM was selected and employed to find the optimum operational conditions for the adsorption of BrO3- onto Fe-CNTs nanocomposite. Conventionally, during batch mode of experimentation, to study the effect of factors on adsorption of pollutants only one operational condition, i.e. factor, is changed at a time, while others are kept at unspecified constant levels. Such an approach, apart from being arduous, time consuming and costly, ignores the interaction between factors (Yang et al., 2019). RSM has an advantage over this conventional optimization method as it allows the determination of interactive effects of independent factors, along with the individual effect on the response. Fewer experiments need to be performed to obtain a large amount of information, which makes RSM a more economical approach. RSM also provides better reproducibility of the results (Oyekanmi et al., 2019a; Oyekanmi et al., 2019b; Oyekanmi et al., 2019c; Oyekanmi et al., 2019d). Out of many available RSM designs, like central composite and Doehlert designs, Box-Behnken design (BBD) has the advantage that it needs a reasonably small group of parameters to determine a complex response function, and also avoids having to perform experiments under extreme conditions (Singh et al., 2012).
In a previous work (Alsohaimi et al., 2015), Fe-CNTs nanocomposite was synthesized, characterized, and successfully applied for the adsorption of BrO3- from water in batch mode. The study aimed to find the optimum adsorption of BrO3- and to study its kinetics, isotherm, mechanism, and desorption. In the present study, the authors aimed to deploy the RSM tool for the optimization of the operational variables for maximizing BrO3- uptake by Fe-CNTs nanocomposite, and also to find the interactive effect of variables on adsorption by performing only 15 experimental runs.
MATERIALS AND METHODS
Chemicals and reagents
Unless otherwise specified, chemicals and reagents used in this study were of analytical reagent (AR) grade. Potassium bromate (KBrO3), ferric chloride (FeCl3), ferrous chloride (FeCl2), ammonium chloride (NH4Cl), ammonia (NH3), sodium hydroxide (NaOH), ammonium hydroxide (NH4OH), sulfuric acid (H2SO4), hydrochloric acid (HCl) and nitric acid (HNO3) were purchased from BDH Chemicals (London, UK). Acetic acid (CH3COOH; AA) and oxalic acid (C2H2O4; OA) were obtained from Riedel-de-Haën AG (Seelze, Germany). Formic acid (HCOOH; FA) was purchased from Panreac (Barcelona, Spain). Multi-walled carbon nanotubes (MWCNTs; >95% purity) were obtained from Sigma-Aldrich (Steinheim, Germany). Ultrapure water was obtained by a Milli-Q water purification system (Millipore Corporation, Burlington, MA, USA). A BrO3- stock solution (100 mg/L) was prepared in Milli-Q water and used for the preparation of standards for instrumental calibration and working solutions for adsorption experiments.
Synthesis of Fe-CNTs nano-composite
Firstly, magnetite (Fe3O4) was prepared as described elsewhere (Abdalla et al., 2011). Briefly, 270.30 g of FeCl3 and 132.50 g of FeCl2 were placed in a 5 L Erlenmeyer flask and 150 mL deionized (D.I.) water added under stirring until homogeneous mixture. Thereafter, 250 mL of liquefied NH3 was added under continuous stirring till the colour of the mixed solution changed to black. The mixture was then filtered, dried, and finely crushed manually using a mortar and pestle. Ferric hydroxide (Fe(OH)3) was synthesized by mixing 200 g of FeCl3 with D.I. water under stirring until homogeneity. Then, a buffer solution (100 g NH4Cl, 50 mL D.I. water and 200 mL NH4OH at pH 9) was added to the mixture, which was then filtered, dried in an oven and crushed. The synthesized Fe3O4 was then homogeneously mixed with Fe(OH)3 and MWCNTs in a 6:3:1 (w/w) ratio in order to obtain the Fe-CNTs nanocomposite. To remove moisture traces, the Fe-CNTs nanocomposite was oven dried at 323 K (12 h) and then stocked in a sealed plastic bag, which was placed in a desiccator.
The characterization of Fe-CNTs nanocomposite by Fourier transform infrared (FT-IR) spectrometry, transmission electron microscopy coupled with energy-dispersive X-ray (TEM-EDX) and N2 adsorption/desorption isotherm at 77 K can be found in a previous work (Alsohaimi et al., 2015).
Adsorption experiments
Batch-scale experiments for BrO3- adsorption on Fe-CNTs nanocomposite were conducted under agitation at room controlled temperature according to RSM design described in the following section. Briefly, the desired mass of prepared nanocomposite was placed in stoppered conical flasks together with a known volume (50 mL) of BrO3- solution of known concentration, whose pH was set by the addition of diluted NaOH and/or HCl. Then, conical flasks were equilibrated at 100 r/min. After attaining equilibrium, the mixture was centrifuged (15 000 r/min) in order to separate the solution from the adsorbent. The residual BrO3- concentration in the solution was then determined in an ultra-performance liquid chromatography (UPLC) system, equipped with a Waters (Milford, MA, USA) quaternary pump system, using an Acquity BEH C18 column of dimension 50 mm x 2.1 mm and 1.7 mm particle size acquired from Waters (Milford, MA, USA) by previously developed method (Alsohaimi et al., 2012), the mobile phase consisting of a mixture of ultrapure water and formic acid (99.9: 0.1 v/v) and the injection volume being 5 μL.
The adsorbed concentration of BrO3- onto Fe-CNTs at equilibrium (qe, mg/g) was calculated by the following mass balance:
where Ci(mg/L) is the initial BrO3- concentration, Ce(mg/L) is BrO3- concentration at the equilibrium, V is the volume of the solution (L) and W is the mass (g) of nanocomposite.
Response surface methodology
Response surface methodology is a multivariate statistical technique that explores the relationship between two or more independent variables and a single dependent variable, which is called the response. Response surface, which is the graphical representation of the functions, is used to explain the effect of first order as well as higher order variables on the response. RSM solves multivariate data acquired by statistically designed experiments to obtain the optimum response by using a quadratic regression model (Tan et al., 2008; Aslan et al., 2007).
In the present study, a 3-level 3-factor fractional factorial design, i.e., a Box-Behnken design (BBD), was used as experimental design for RSM. BBD is advantageous over full factorial designs since it permits the use of lower combinations of variables for determining the complex response function (Kiran et al., 2007). BBD contains some chosen subsets, i.e., fractions of the experimental runs of a full factorial design, so allowing for reducing the number of experimental runs required to obtain the response value but still providing the necessary information on interaction between independent variables (Yang et al., 2020).
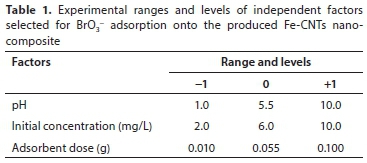
In this work, considering BrO3- adsorption on Fe-CNTs nanocomposite as a response, the three selected independent variables affecting such a response were pH, initial BrO3-concentration and adsorbent dose. The values of all three levels (-1, 0, +1) for these variables are given in Table 1.
The number of necessary experiments for BBD was determined by the following equation:
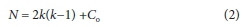
where k is the number of independent variables and Co is the number of central points. Thus, 15 experimental runs need to be performed for a design that has 3 independent variables and consists of 3 central points (Kumar et al., 2007).
After performing experiments according to BBD statistical design, data were analysed through the polynomial equation (Eq. 2) in order to determine the correlation between independent variables and to predict the result.

where Y is the response, i.e., percentage of bromate uptake, β0is a constant, βi is the linear effect of variable X,, βii is the quadratic effect of variable Xi, βij is the interaction effect between the variables Xi and ε is the residual term.
The software MINITAB was used to analyse the data obtained from statistically designed adsorption experiments.
RESULTS AND DISCUSSION
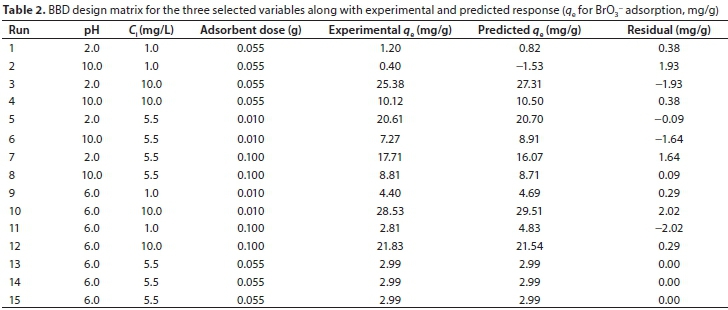
BBD was used to statistically design the necessary experiments to evaluate the interactive effects of operational conditions (pH, Ci (mg/g) and adsorbent dose (g)) for optimizing adsorption of BrO3- onto Fe-CNTs (qe, mg/g) nanocomposite. Results from the 15 batch experimental runs are presented in Table 2, together with the results predicted by the BBD. As can be seen in Table 2, the experimental qe(mg/g) for BrO3- was different for each run, which indicates that its adsorption onto Fe-CNTs is affected by each of the selected variables and shows a different response pattern under different combinations of these operational conditions.
Regression analysis
Results from the regression analysis are shown in Table 3. The magnitude of the coefficient for each variable factor indicates intensity and the sign indicates the nature of influence, i.e., synergistic or antagonistic effect, of the individual variable on the response, namely on qe (mg/g). Meanwhile, the SE coefficient measures the variation in determining the regression coefficients. The effects having p < 0.05 are considered significant. The larger the t-value, the larger is the significance.
As can be seen in Table 3, the constant β0was found to be 2.990, the p-value (0.050) and the i-value (2.499) indicating its significance. The value of the constant shows that average uptake of BrO3" by a Fe-CNTs nano-composite was 2.990 mg/g. This value was not affected by any factor or interaction of factors. Linear parameters pH and Ci have a significant effect on BrO3" adsorption, while the linear parameter of adsorbent dose (p = 0.161) was not found to be significant. However, the second-order term of adsorbent dose was found to be highly significant (p = 0.001). Indeed, the highest i-values were those determined for the linear term of C and for the second-order term of adsorbent dose, which shows the sensitivity of BrO3" adsorption onto Fe-CNTs to these variables. As for pH, the linear term coefficient has a negative sign, which points to its antagonistic significant relationship with BrO3" adsorption onto the nano-composite, the second-order term having a coefficient with a smaller absolute value. The coefficient of Cihas a positive sign, indicating the synergistic relation with BrO3" uptake. It was found that the second-order term of initial BrO3" concentration was also positive (3.539) and significant (p = 0.022) but, since the value of the coefficient for first-order term of initial concentration is larger (9.631), the linear term is more important than the quadratic. Regarding the adsorbent dose, the quadratic term of adsorbent dose has a large positive coefficient and significance (p = 0.001), which indicates a peaked behaviour of BrO3" adsorption, initially increasing with increased dose of Fe-CNTs and then decreasing.
In order to establish the relationship between the response (qe, mg/g), and considering coefficients in Table 3, the following regression model (Eq. 4) was proposed:
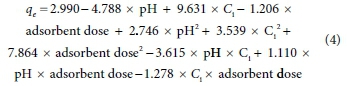
The standard deviation of this model (2.07232) reveals that the above equation satisfactorily explains the response (qe, mg/g) and that the independent variables are well associated. On the other hand, the value of coefficient of determination, R2 (98.34%) indicates high dependency and closeness between predicted and experimental values of the response factor, which had already been inferred from data in Table 2.
Main effect plots
Main effect plots are used to find out the relation between the independent variables and the response by graphing the response mean for each factor level connected by a line. In this way, a main effect is detected when different levels of a factor affect the response differently.
Main effect plots were here determined for pH, C1 and adsorbent dose and are illustrated in Fig. 1.
The figure shows that the mean uptake of BrO3" on Fe-CNTs is 10.26 mg/g. The pH plot (Fig. 1a) shows that the uptake was larger than the mean at pH 2.0, and was smaller than the mean at pH 6.0 and 10.0, i.e., the maximum uptake occurred at pH 2.0. This is because at lower pH, hydronium (H3O+) ions are also present in the solution together with BrO3", due to which electrostatic attractive forces are generated between BrO3" and the surface of Fe-CNTs composite, leading to higher uptake. However, with increasing pH, hydroxyl ion (OH-) concentration increases in solution and competition establishes between negatively charged BrO3" and OH" ions to occupy the active adsorption sites on the nanocomposite surface. The main effect plot of Cp i.e. Fig. 1b, illustrates that BrO3" uptake shows a value above the mean at Ci= 10.0 mg/L and below the mean at Ci= 5.5 mg/L and 1.0 mg/L. The increase in uptake with increase in Ci can be explained by the adsorption equilibrium displacement with increasing Ci. With regards to the effect plot for the adsorbent dose (Fig. 1c), it shows that uptake initially decreases with increasing adsorbent dose but then increases, showing larger values than the mean qe for adsorbent doses of 0.010 g and 0.100 g, but a smaller value than the mean at 0.055 g. This decrease in uptake with gradually increasing adsorbent dose may be because at the increased adsorbent dose the BrO3" ions are not sufficient in number to completely cover the sites available for adsorption, resulting in low uptake of BrO3" ions.
Residual graphs
The normal probability plot (NPP), which represents residuals versus their percentage probability, is depicted in Fig. 2a. As can be seen in Fig. 2a, residuals almost fall on a straight line, which indicates that the distribution of points is normal. The maximum range where the points fall on a straight line is ± 2, which means that no outliers or skewness are present. Residuals were also presented in the form of histogram for frequency (Fig. 2b). This plot was fairly symmetrical and bell-shaped, further confirming the normal distribution of errors in the range of ± 2 with a mean value of zero. The random scattering of error terms around zero in both Fig. 2c (plot of residuals versus their fitted values) and Fig. 2d (error terms versus observation order) indicates that the errors have a constant variation and are all in the range of ± 2.
Contour plots
Contour plots are drawn to understand the effect of individual variables as well as their interaction on the response. Figure 3 represents the contour plots corresponding to the qe(mg/L) for BrO3- adsorption onto Fe-CNTs composite. When drawing a contour plot to determine the interactive effect of two variables, the value of the third variable is kept constant. In the present study, the held value was the middle value of each variable, namely, pH 6.0, Ci5.5 mg/L and adsorbent dose 0.055 g.
Figure 3a presents the interactive influence of pH and Ci on qe for BrO3- (at a held adsorbent dose of 0.055 g), and points to the increase in qewith increasing pH and Ci. Figure 3b depicts qeat different adsorbent doses and pH values (at a held Ci of 5.5 mg/L), showing the increase of qewith increasing pH and an initial decrease followed by an increase with increasing adsorbent dose. Finally, Fig. 3c represents the mutual effect of Fe-CNTs dose and Ci on qe (at a held pH of 6.0), which further confirms the curved relation of uptake to adsorbent dose and the linear relation with Ci. According to the contour plots, the uptake of BrO3-onto Fe-CNTs composite reaches a maximum at pH 2.0, Ci10.0 mg/L, and adsorbent dose 0.010 g, which was further confirmed through experimental results.
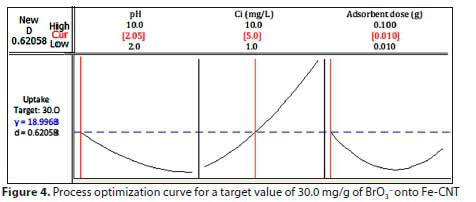
Process optimization curve
The process optimization curve, which enables the determination of optimum conditions of independent variables for obtaining a desired value of the response, is presented in Fig. 4. In the present study, the desired value of qe, i.e., the goal, was to obtain a value at or near the target value of 30.0 mg/g, and the minimum and maximum qewere set at 10.0 and 50.0 mg/g, which means that qevalues lower than 10.0 and larger than 50.0 mg/g are not acceptable. As can be seen in Fig. 4, for this target value the predicted response of 18.9968 mg/g was obtained at optimum conditions of independent variables that were pH 2.05, Ci5.0 mg/L, and adsorbent dose 0.010 g (in a volume of 50 mL), with a good desirability score. A perfect desirability score could have been obtained if uptake had achieved the ideal settings. However, it is well within the acceptable range and in good accordance with the experimental response. The maximum uptake is shown to be achieved at pH 2.0, Ci10.0 mg/L, and adsorbent dose 0.010 g.
CONCLUSIONS
Adsorption of BrO3- onto Fe-CNTs nanocomposite was optimized with the help of BBD, a fractional factorial design of RSM. A quadratic polynomial model equation including pH, initial bromate concentration and adsorbent dose was proposed to successfully predict the adsorption geometry of bromate and optimize the process variables. R2, which is a goodness-of-fit measure for the regression model, was found to be high, representing smaller differences between the observed data and the fitted values. The adsorption process was sensitive to initial BrO3- concentration. The order of significance of individual variables which affected the adsorption of bromate on nanocomposites was initial bromate concentration > pH > adsorbent dose. The interaction of pH and initial bromate concentration significantly affected the adsorption of bromate. The optimum values of process variables for BrO3-adsorption onto Fe-CNT were found to be pH 2.0, Cí10.0 mg/L and adsorbent dose 0.010 g/50 mL.
ACKNOWLEDGEMENTS
The authors would like to extend their sincere appreciation to the Deanship of Scientific Research at King Saud University for funding this work through research group No. RG-1437-031. Marta Otero acknowledges FCT funding through the Investigator Program (IF/00314/2015). Thanks are also due for the financial support to CESAM (UIDB/AMB/50017/2020+ UIDP/AMB/50017/2020), to FCT/MEC through national funds, and the co-funding by the FEDER, within the PT2020 Partnership Agreement and Compete 2020.
REFERENCES
ABDALLA MA, JAAFAR MH, AL-OTHMAN ZA, ALFADUL SM and ALI KHAN M (2011) New route for preparation and characterization of magnetite nanoparticles. Arab. J. Chem. 4 235-237. https://doi.org/10.1016/j.arabjc.2010.06.061 [ Links ]
ALJUNDI IH (2011) Bromate formation during ozonation of drinking water: A response surface methodology study. Desalination. 277 24-28. https://doi.org/10.1016/j.desal.2011.03.090 [ Links ]
ALSEWAILEH AS, USMAN AR and AL-WABEL MI (2019) Effects of pyrolysis temperature on nitrate-nitrogen (NO3- -N) and bromate (BrO3-) adsorption onto date palm biochar. J. Environ. Manage. 237 289-296. https://doi.org/10.1016/j.jenvman.2019.02.045 [ Links ]
ALSOHAIMI IH, ALOTHMAN ZA, KHAN MR, ABDALLA MA, BUSQUETS R and ALOMARY AK (2012) Determination of bromate in drinking water by ultraperformance liquid chromatography-tandem mass spectrometry. J. Sep. Sci. 35 2538-2543. https://doi.org/10.1002/jssc.201200312 [ Links ]
ALSOHAIMI I.H, ALI KHAN M, ALOTHMAN ZA, KHAN MR, KUMAR M and AL MAHRI AM (2015) Synthesis, characterization, and application of Fe-CNTs nanocomposite for BrO3- remediation from water samples. J. Ind. Eng. Chem. 26 218-225. https://doi.org/10.1016/j.jiec.2014.11.033 [ Links ]
ASLAN N and CEBECI Y (2007) Application of Box-Behnken design and response surface methodology for modeling of some Turkish coals. Fuel. 86 90-97. https://doi.org/10.1016/j.fuel.2006.06.010 [ Links ]
BARLOKOVA D, ILAVSKY J, MARKO I and TKACOVA J (2017) Removal of bromates from water. IOP Conf. Ser. Earth Environ. Sci. 92. https://doi.org/10.1088/1755-1315/92/1/012021 [ Links ]
CHEN HW, CHUANG YH, HSU CF and HUANG WJ (2017) Adsorption characteristics of trace levels of bromate in drinking water by modified bamboo-based activated carbons. J. Environ. Sci. Health A Toxic/Hazardous Subst. Environ. Eng. 52 1055-1062. https://doi.org/10.1080/10934529.2017.1340750 [ Links ]
DELPLA I, MONTEITH DT, FREEMAN C, HAFTKA J, HERMENS J, JONES TG, BAURES E, JUNG AV and THOMAS O (2014) A decision support system for drinking water production integrating health risks assessment. Int. J. Environ. Res. Public Health. 11 73547375. https://doi.org/10.3390/ijerph110707354 [ Links ]
DOREVITCH S, ANDERSON K, SHRESTHA A, WRIGHT D, ODHIAMBO A, OREMO J and HEIMLER I (2020) Solar powered microplasma-generated ozone: Assessment of a novel point-of-use drinking water treatment method. Int. J. Environ. Res. Public Health. 17 1-13. https://doi.org/10.3390/ijerph17061858 [ Links ]
FIYADH SS, ALSAADI MA, JAAFAR WZ, ALOMAR MK, FAYAED SS, MOHD NS, HIN LS and EL-SHAFIE A (2019) Review on heavy metal adsorption processes by carbon nanotubes. J. Clean. Prod. 230 783-793. https://doi.org/10.1016/j.jclepro.2019.05.154 [ Links ]
GYPARAKIS S and DIAMADOPOULOS E (2007) Formation and reverse osmosis removal of bromate ions during ozonation of groundwater in coastal areas. Sep. Sci. Technol. 42 1465-1476. https://doi.org/10.1080/01496390701290011 [ Links ]
HE S, ZHANG D, GU L, ZHANG S and YU X (2012) Bromate adsorption using Fe-pillared bentonite. Environ. Technol. (United Kingdom). 33 2337-2344. https://doi.org/10.1080/09593330.2012.666571 [ Links ]
HERRERO-LATORRE C, BARCIELA-GARCÍA J, GARCÍA-MARTÍN S, PEÑA-CRECENTE RM and OTÁROLA-JIMÉNEZ J (2015) Magnetic solid-phase extraction using carbon nanotubes as sorbents: A review. Anal. Chim. Acta. 892 10-26. https://doi.org/10.1016/j.aca.2015.07.046 [ Links ]
HUANG H, LIU G and WANG X (2020) A novel zero valent metal bismuth for bromate removal: Direct and ultraviolet enhanced reduction. RSC Adv. 10 4148-4155. https://doi.org/10.1039/c9ra10391k [ Links ]
JI H, WU W, LI F, YU X, FU J and JIA L (2017) Enhanced adsorption of bromate from aqueous solutions on ordered mesoporous Mg-Al layered double hydroxides (LDHs). J. Hazardous Mater. 334 212222. https://doi.org/10.1016/j.jhazmat.2017.04.014 [ Links ]
KIMBROUGH DE and SUFFET IH (2002) Electrochemical removal of bromide and reduction of THM formation potential in drinking water. Water Res. 36 4902-4906. https://doi.org/10.1016/S0043-1354(02)00210-5 [ Links ]
KIRAN B, KAUSHIK A and KAUSHIK CP (2007) Response surface methodological approach for optimizing removal of Cr (VI) from aqueous solution using immobilized cyanobacterium. Chem. Eng. J. 126 147-153. https://doi.org/10.1016/jxej.2006.09.002 [ Links ]
KUMAR A, PRASAD B and MISHRA IM (2008) Optimization of process parameters for acrylonitrile removal by a low-cost adsorbent using Box-Behnken design. J. Hazardous Mater. 150 174-182. https://doi.org/10.1016/jjhazmat.2007.09.043 [ Links ]
LIN D, LIANG H and LI G (2020) Factors affecting the removal of bromate and bromide in water by nanofiltration. Environ. Sci. Pollut. Res. 27 24639-24649. https://doi.org/10.1007/s11356-019-06002-3 [ Links ]
LOEB BL, THOMPSON CM, DRAGO J, TAKAHARA H and BAIG S (2012) Worldwide Ozone Capacity for Treatment of Drinking Water and Wastewater: A Review. Ozone Sci. Eng. 34 64-77. https://doi.org/10.1080/01919512.2012.640251 [ Links ]
MORAIS DFS, BOAVENTURA RAR, MOREIRA FC and VILAR VJP (2021) Bromate removal from water intended for human consumption by heterogeneous photocatalysis: Effect of major dissolved water constituents. Chemosphere. 263 128111. https://doi.org/10.1016/j.chemosphere.2020.128111 [ Links ]
NAIDOO S and OLANIRAN AO (2013) Treated wastewater effluent as a source of microbial pollution of surface water resources. Int. J. Environ. Res. Public Health. 11 249-270. https://doi.org/10.3390/ijerph110100249 [ Links ]
OYEKANMI AA, AHMAD A, HOSSAIN K and RAFATULLAH M (2019a) Statistical optimization for adsorption of Rhodamine B dye from aqueous solutions. J. Mol. Liquids. 281 48-58. https://doi.org/10.1016/j.molliq.2019.02.057 [ Links ]
OYEKANMI AA, LATIFF AAA, DAUD Z, MOHAMED RMSR, ISMAIL N, AZIZ AA, RAFATULLAH M, HOSSAIN K, AHMAD A and ABIODUN AK (2019b) Adsorption of cadmium and lead from palm oil mill effluent using bone-composite: optimisation and isotherm studies. Int. J. Environ. Anal. Chem. 99 707-725. https://doi.org/10.1080/03067319.2019.1607318 [ Links ]
OYEKANMI AA, LATIFF AAA, DAUD Z, MOHAMED RMSR, AZIZ NAA, ISMAIL N, RAFATULLAH M, AHMAD A and HOSSAIN K (2019c) Adsorption of pollutants from palm oil mill effluent using natural adsorbents: optimization and isotherm studies. Desalination Water Treat. 169 181-190. https://doi.org/10.5004/dwt.2019.24689 [ Links ]
OYEKANMI AA, AHMAD A, HOSSAIN K and RAFATULLAH M (2019d) Adsorption of Rhodamine B dye from aqueous solution onto acid treated banana peel: Response surface methodology, kinetics and isotherm studies. PLoS ONE. 14 (5) e0216878. https://doi.org/10.1371/journal.pone.0216878 [ Links ]
RUFFINO B, KORSHIN GV and ZANETTI M (2020) Use of spectroscopic indicators for the monitoring of bromate generation in ozonated wastewater containing variable concentrations of bromide. Water Res. 182 116009. https://doi.org/10.1016/jwatres.2020.116009 [ Links ]
SINGH KP, RAI P, PANDEY P and SINHA S (2012) Modeling and optimization of trihalomethanes formation potential of surface water (a drinking water source) using Box-Behnken design. Environ Sci Poll Res. 19 (1) 113-127. https://doi.org/10.1007/s11356-011-0544-y [ Links ]
TAN IAW, AHMAD AL and HAMEED BH (2008) Optimization of preparation conditions for activated carbons from coconut husk using response surface methodology. Chem. Eng. J. 137 462-470. https://doi.org/10.1016/j.cej.2007.04.031 [ Links ]
TANG Y, ZHANG S, SU Y, WU D, ZHAO Y and XIE B (2021) Removal of microplastics from aqueous solutions by magnetic carbon nanotubes. Chem. Eng. J. 406 126804. https://doi.org/10.1016/j.cej.2020.126804 [ Links ]
WANG Q, SNYDER S, KIM J and CHOI H (2009) Aqueous ethanol modified nanoscale zerovalent iron in Bromate reduction: Synthesis, characterization, and reactivity. Environ. Sci. Technol. 43 32923299. https://doi.org/10.1021/es803540b [ Links ]
WANG YH and CHEN KC (2014) Removal of disinfection byproducts from contaminated water using a synthetic goethite catalyst via catalytic ozonation and a biofiltration system. Int. J. Environ. Res. Public Health. 11 9325-9344. https://doi.org/10.3390/ijerph110909325 [ Links ]
WÏNIEWSKI JA, KABSCH-KORBUTOWICZ M and LAKOMSKA S (2015) Removal of bromate ions from water in the processes with ion-exchange membranes. Sep. Purif. Technol. 145 75-82. https://doi.org/10.1016/j.seppur.2015.03.004 [ Links ]
YANG Y, ZHENG Z, JI W, YANG M, DING Q and ZHANG X (2019) The study of bromate adsorption onto magnetic ion exchange resin: Optimization using response surface methodology. Surf. Interf. 17 100385. https://doi.org/10.1016/j.surfin.2019.100385 [ Links ]
YANG X, GUO P, LI M, LI H, HU Z, LIU X and ZHANG Q (2020) Optimization of culture conditions for amoxicillin degrading bacteria screened from pig manure. Int. J. Environ. Res. Public Health. 17 1-15. https://doi.org/10.3390/ijerph17061973 [ Links ]
ZHANG YQ, WU QP, ZHANG JM and YANG XH (2015) Removal of bromide and bromate from drinking water using granular activated carbon. J. Water Health. 13 73-78. https://doi.org/10.2166/wh.2014.084 [ Links ]
ZHANG XY, LU Y, DU Y, WANG WL, YANG LL and WU QY (2021) Comprehensive GCxGC-qMS with a mass-to-charge ratio difference extraction method to identify new brominated byproducts during ozonation and their toxicity assessment. J. Hazardous Mater. 403 124103. https://doi.org/10.1016/j.jhazmat.2020.124103 [ Links ]
ZHOU J, WU K, WANG W, HAN Y, XU Z, WAN H, ZHENG S and ZHU D (2015) Simultaneous removal of monochloroacetic acid and bromate by liquid phase catalytic hydrogenation over Pd/Ce1-xZrxO2. Appl. Catal. B Environ. 162 85-92. https://doi.org/10.1016/j.apcatb.2014.06.041 [ Links ]
 Correspondence:
Moonis Ali Khan
Email: mokhan@ksu.edu.sa
Received: 5 January 2021
Accepted: 8 October 2021

