


Servicios Personalizados
Articulo
 Inglés (pdf)
 Articulo en XML
 Referencias del artículo
Indicadores

Links relacionados
-
 Citado por Google
 -
 Similares en Google
Compartir

 Permalink
Water SA
versión On-line ISSN 1816-7950
versión impresa ISSN 0378-4738
Water SA vol.47 no.3 Pretoria jul. 2021
http://dx.doi.org/10.17159/wsa/2021.v47.i3.11864
RESEARCH PAPER
A water footprint approach to guide water resource management in data-scarce regions: A case study for the Upper Ewaso Ng'iro Basin, Mount Kenya
Michael van der LaanI; Sandra EckertII; Maya da SilvaI; John AnnandaleI
IDepartment of Plant and Soil Sciences, University of Pretoria, Hatfield, Pretoria 0028, South Africa
IICentre for Development and Environment, University of Bern, Mittelstrasse 43, CH-3012 Bern, Switzerland
ABSTRACT
Due to population growth and agricultural intensification, water scarcity is increasing in the Upper Ewaso Ng'iro Basin. Quantitative information is needed to improve the management of this resource, but is a challenge due to lack of hydrometeorological data. Using water footprint thinking, a pragmatic approach applying available information and simple assumptions was used to estimate blue and green water availability and consumption for different land uses and activities. Despite the attention it receives, flower production makes up a small component of the basin's water footprint (1.4% of blue water consumed, roses used 0.73%), although the drastic impact of horticulture on low flows during dry periods is recognized. Surface water evaporation from irrigation dams containing captured floodwaters or pumped groundwater has a water footprint comparable to greenhouse horticultural production itself. Small-scale irrigation was estimated to use 71.4% of the blue water consumed, while total commercial horticultural production was estimated to use 8.2%. Direct human consumption was estimated at 3% and livestock and wildlife consumption at 4.2% of consumed blue water. Labour opportunities were almost 10 times higher for roses than for maize per hectare and per m3 of water consumed. Water productivity in terms of selling price was 128 times higher for 1 tonne of roses than for 1 tonne of maize. This approach can be used in data-poor regions to advance understanding between multiple stakeholders (such as between farmers, pastoralists and conservationists) for participatory management, and to better understand the basin's water balance to estimate exploitable water resources.
Keywords: irrigation; integrated water resource; management; basin water balance; water scarcity; roses
INTRODUCTION
Combinations of population growth, agricultural intensification and changing climate patterns are leading to increased water scarcity and conflict between upstream and downstream users in parts of sub-Saharan Africa (SSA) (Dos Santos et al., 2017). Added to this, there has been growing concern over the fact that the number of large-scale agricultural investments (LAIs) has increased to unprecedented levels (Anseeuw et al., 2012; Dell'Angelo et al., 2017; Messerli et al., 2014) with impacts on water resources often being unknown. Since small-scale farmers (SSFs) manage the majority of land worldwide, this shift in production model could dramatically reshape the world's agrarian landscape, including equity in water resource distribution (Lanari et al., 2018), and the associated environmental implications (Dell'Angelo et al., 2017).
Studies show that the current land investments that primarily target developing countries in Africa, specifically those that are among the poorest, are poorly integrated into the world economy, have a high incidence of hunger, and/or weak land governance (Anseeuw et al., 2012; Bracco, 2015). In this context, there are two primary opposing perspectives on the subject: major threats to the rights and livelihoods of the rural poor with the colloquial terms 'land grabbing' and 'water grabbing' being used, versus the new investments as much needed development opportunities for long-neglected sectors (Anseeuw et al., 2012).
The highland-lowland Upper Ewaso Ng'iro Basin, Kenya, is a good example where both population growth and agricultural intensification has increased water scarcity, evident from cases of river flow no longer reaching the basin's outlet for stretches of time during the year. It has been reported that flows in the basin have decreased by 30%, with an estimated 60-95% of available water extracted from rivers during the dry season; up to 90% of these abstractions are illegal (Kiteme and Gikonyo, 2002; Mutiga et al., 2011; Ngigi et al., 2008; Notter et al., 2007). For the Naro Moru River, Aeschbacher et al. (2005) estimated that 97% of abstracted water was used for irrigation on 9% of the catchment land area, constituting 80-100% of the dry season flow.
Water issues have already led to conflict between different users in the basin. Gichuki (2002a) documented conflicts between water users and conservationists, irrigators and pastoralists, irrigators and fish farmers, and even human-wildlife encounters due to water shortages. Poor distribution of water is a major issue for socio-economic development in the Upper Ewaso Ng'iro, as excess water during the rainy season is followed by severe water scarcity during the dry season when over-abstraction for irrigation also increases (Ngigi et al., 2008). Impacts on downstream ecosystems requiring sustained flows and natural periodicities of high and low flows are also expected to be negative. Surface flow of the Ewaso Ng'iro eventually dissipates into the Lorian Swamps, and in recent years the swamps have retreated many kilometres upstream and diminished in size (Acacia Water Report, 2014). This area is important as it can provide key forage biomass to livestock and wildlife during dry periods (Ericksen et al., 2011). It also provides drinking water and water for fish production to more than 55 000 people living around the swamp (De Leeuw et al., 2012). Furthermore, the swamp is understood to recharge the Merti Aquifer which, among other things, supplies water to the largest refugee camp in Africa, Dadaab, with 235 269 registered refugees (UNHCR, 2019).
Some research has been done on the hydrology and river water extraction for the Upper Ewaso Ng'iro Basin. Notter et al. (2007) used the NRM3 Streamflow Model to analyse the impact of land use change on water resources, estimating that 80-100% of naturalized dry season river flow is abstracted, that climate change could increase runoff by 26% and reduce lowest flows to about one-tenth of current values. Using the Water Evaluation and Planning (WEAP) model, Mutiga et al. (2010) estimated that agriculture uses 65% of total water in the basin and that excessive water abstraction for irrigation used about 80% of available water. To address the impact of irrigation, Mutiga et al. (2010) recommended that commercial farms build reservoirs with at least 3 months storage capacity for the dry season and that larger dams be built to capture floodwaters and allow controlled release to downstream users. Lanari et al. (2018) provided an overview of the impact of commercial horticultural production, observing that there has been an increase in water use by the sector from 357 L∙s-1 in 2003 to 663 L∙s-1 in 2013.
Water scarcity conflicts in the Upper Ewaso Ng'iro Basin are compounded by inequity in resource acquisition, and diverse perceptions on water availability and entitlements of other water users (Ngigi et al., 2008). Managing water resources essentially requires quantitative understanding and buy-in from all stakeholders - namely, governance, industry, and communities - to understand that water is a shared resource and should be managed as such. To date, water resource information has often been lacking, preventing effective communication between these groups. Gichuki (2002b) called for an enabling framework for equitable, efficient and productive use of water resources in the basin, and continued that involvement of stakeholders, capacity building, a sound information base, and conflict-resolution mechanisms are key. To this end, water resource user associations have been created along the rivers to manage and allocate river water (Lanari et al., 2018).
Hydrological modelling studies often do not go as far as presenting information on all the different components of a basin water balance in a way that may be understandable to multiple stakeholders. With water footprint accounting this gap may be addressed (Le Roux et al., 2017). It divides water consumption into blue water use (water from rivers, dams and underground sources) and green water use (rainfall stored in the soil and available for vegetation growth). Although water footprint accounting has its limitations and the development of different methodologies is ongoing (Le Roux et al., 2018), one of its key strengths is that it is a metric that a broad range of stakeholders seems to be able to engage with and discuss. Its relatively simple calculation can also bypass more complex water balance calculations by essentially considering the runoff fraction from certain land uses to become blue water available within a catchment or basin (Le Roux et al., 2017).
In this study, we apply water footprint accounting with fairly simple and transparent assumptions (as opposed to more complex hydrological modelling) to estimate water availability and use in the Upper Ewaso Ng'iro Basin. This is envisaged to produce information that is meaningful and applicable to a wider variety of stakeholders with diverse interests, so as to better understand where water resources originate and are consumed, the interdependence between land uses, water users, and challenges involved in water allocation and management at the basin scale in a highland-lowland system. We also look at water productivity in terms of financial gain and labour opportunities created for two contrasting agricultural products, roses (Rosa spp.) and maize (Zea mays L.). Such a framework could also potentially be useful to non-specialist stakeholders to test different 'what-if' scenarios and in the formulation of policy.
MATERIALS AND METHODS
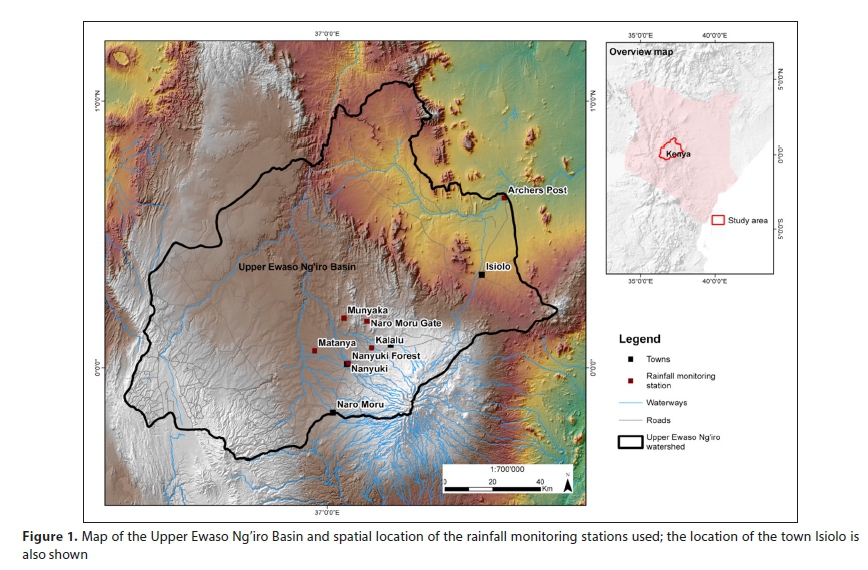
Description of the Upper Ewaso Ng'iro Basin
The basin has an area of 15 200 km2 and a large elevation gradient that results in very heterogeneous rainfall patterns; the area can be divided into mountain slopes, lower highlands, and lowlands. Rainfall ranges from 300 to 2 000 mm∙yr-1, with a mean of about 700 mm∙yr-1 (Ngigi et al., 2008). It has a bimodal distribution with the highest rainfall in April and October, and the northwestern regions also experience continental rainfall between June and September (Mutiga et al., 2010). Potential evapotranspiration (ET) ranges from about 2 000 to 2 500 mm∙yr-1 (Ngigi et al., 2008). The Upper Ewaso Ng'iro Basin is highly suited to horticultural production and has undergone considerable agricultural intensification, land use change and population growth in recent decades (Lanari et al., 2018). While the majority of the rural population are small-scale subisistence farmers on 1 ha or less (Zaehringer et al., 2018), large agricultural investments increased from 24 in 2003 to 35 in 2013 (Lanari, 2014). (Further information on agricultural production and land use are provided below. See also Table A1 (Appendix) for monthly calculations.)
Estimating blue and green water availability
Blue water made available per land use, defined as runoff water (including deep drainage) that enters a stream or groundwater to become available to other users, and blue and green water consumption (Mm3∙yr-1) (Hoekstra et al., 2011; Le Roux et al., 2017) per land use for the basin was estimated on a monthly time-step as:

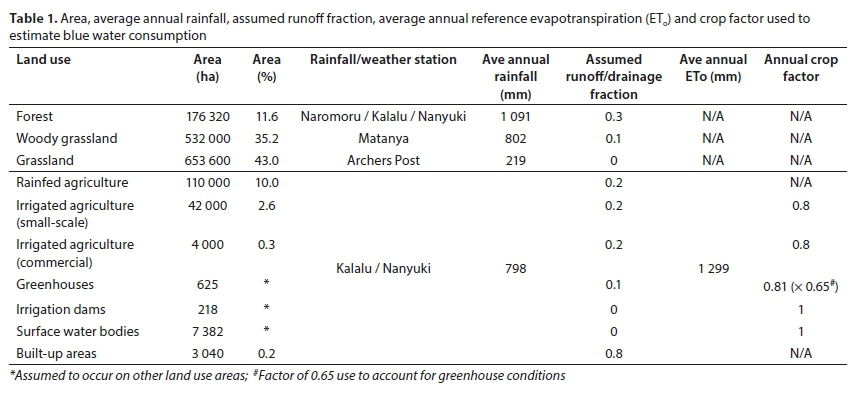
Measured rainfall data for Naromoru Gate, Matanya, Nanyuki Forest, Munyaka and Kalalu were obtained from the Centre for Training and Integrated Research in Arid and Semi-Arid Lands Development (CETRAD), while data for Archers Post were obtained from the Climate Forecast System Reanalysis (CFSR) global meteorological dataset (Fuka et al., 2014) (Figs 1 and 2). Mutiga et al. (2011) estimated that runoff constitutes 20% of the basin water balance, and Ngigi et al. (2008) estimated a runoff coefficient of 46% at field scale declining to 12% at catchment scale. Aquifer recharge is generally an unknown for the basin. The fractions used to estimate runoff (assumed to include deep drainage) for different land uses are presented in Table 1 and the information and assumptions used to derive these values are described below.
Estimating blue and green water consumption for different land uses and other human activities
Water footprints were estimated according to land use or activity within the basin using the most appropriate data and assumptions. This is in contrast to the more standard approach of estimating water footprints as a volume of water used divided by the mass of output because production data for the basin are not readily available. Specific assumptions and data used for each land use or human activity considered are described below.
Forests
Forest was estimated to cover 11.6% of the basin area (CETRAD, 2014), and consists of both production and conservation forestry. Average monthly rainfall data were weighted equally between Naromoru Gate, Nanyuki Forest and Kalalu, for forested areas in the basin. Effective rainfall for these three stations according to the USDA SCS method was calculated at 79, 88 and 89%, respectively. But it is further noted that some of the rainfall may fall onto non-vegetated, often steep areas of Mt Kenya. An applicable runoff fraction number for this land use could not be obtained directly from the literature. Mutiga et al. (2010) estimated that around 80% of downstream flow at the foot of the basin originates from the mountainous regions. We estimated that 1 904 Mm3 of rain falls on the forests, and average annual Archer's post flow was 692 Mm3. So the 692 × 80% Mm3 (= 554 Mm3) divided by 1 904 Mm3 gives a value of 30% of the rain that falls over the forested area flowing past Archer's Post.
Woody grassland
According to CETRAD (2014), woody grassland covers 35.2% of the basin area. Matanya average monthly rainfall data were used for this land use. Effective rainfall according to the USDA SCS method is 89%. Due to lack of published data, it was estimated that 10% of the rain falling on this area is lost as surface and sub-surface runoff, while the rest is evapotranspired, representing green water consumption.
Grasslands and bareland
According to Mutiga et al. (2011), grasslands occupied 18% of the basin area in 2003 (down from 20.5% in 1987), while according to CETRAD (2014) grassland covered 43%. Mutiga et al. (2011) also included a 'bareland' land use category (covering 24.1%), however, which was not considered by CETRAD (2014). We, therefore, used only the grassland category, estimated to cover 43% of the area.
These areas are semi-arid, meaning potential ET exceeds precipitation. Mutiga et al. (2010a) estimated evapotranspiration values ranging from 3-5 mm∙day-1 for grasslands in the region, and from 0-2 mm∙day-1 for bare or fallow lands, using remote sensing. Although up to 80% of rain from big events has been observed to be lost via runoff from bare and crusted soils in the region (Mutunga, 1995), since it has also been estimated that 70-90% of downstream flow at the foot of the basin originates from the mountainous regions (Mutiga et al., 2010b), we assumed that any runoff water for this land cover will be intercepted and evaporate before reaching streams and rivers, so all rainfall was attributed to green water use. Archer's Post rainfall data was applied for this land use and the effective rainfall is 97.3% according to the USDA SCS method.
Rainfed cropland
Following independence in 1964, the basin was divided into small plots onto which small-scale farmers settled (Mutiga et al., 2010b), and this has led to a highly heterogeneous landscape with regards to the combination of crops being produced on relatively small parcels of land. Rainfed cropland has been estimated to cover 10% of the basin area (CETRAD, 2014). We assumed that, of this area, small-scale farmer irrigation occurs on 42 000 ha (see next section), so 110 000 ha was attributed to actual rainfed production. The bimodal rainfall pattern determines cropping patterns, which are very diverse and complex and include intercropping and agroforestry, commercial, small-scale and subsistence production.
For this land use that is not permanently under vegetation, we assumed that 20% of rainfall ends up as runoff which becomes available to others in the basin as blue water. Runoff studies in Tanzania by Lundgren (1980) have shown that replacing natural forest with small-scale cultivation can increase runoff. Our assumption of 20% runoff (less than for forestry), however, applies for the whole area under rainfed production within the basin and recognizes that forest soils can potentially retain more water for delayed release as base flow. Kalalu rainfall data was applied for this land use (effective rainfall is 89.4%).
Small-scale and commercial irrigated agriculture
Irrigation has been estimated to cover 46 000 ha of the basin surface area (Mutiga et al., 2010b). We assumed that small-scale farmer irrigation is intermingled with the 10% attributed to rainfed cropland (CETRAD, 2014), while based on survey results obtained as part of the current study (Oberlack, forthcoming), we estimated that commercial field irrigation occurs on 4 000 ha of the 46 000 ha attributed to irrigation in the basin.
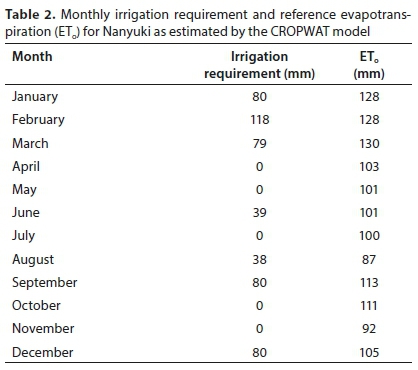
Using remote-sensing data collected for 12 July in 2000, 2003 and 2006, Mutiga et al. (2010a) estimated evapotranspiration rates of 3-4 mm∙day-1 for small-scale farms and 5-6 mm∙day-1 on large-scale commercial horticultural farms. A good correlation was observed with the CROPWAT model, although the remote-sensing estimates tended to be higher (Mutiga et al., 2010a). For our purposes, the CROPWAT model was applied using Kalula Weather Station measured rainfall, together with temperature, relative humidity, wind speed and solar radiation from CLIMWAT's Nanyuki Weather Station. While a wide variety of crops is produced under irrigation, for both small-scale and commercial irrigation, a simple crop factor (Kc) of 0.8 was assumed as no data are available to assign different values for these broad categories of irrigation. In reality, it may be that commercial agriculture has a higher Kc. Monthly irrigation requirement as calculated by CROPWAT is given in Table 2. Similar to rainfed production, runoff from rainfall that becomes blue water was assumed to be 20% for irrigated lands.
Production under greenhouses
The area under greenhouse production has increased from 0 ha in 1987 to 624 ha (0.0004% basin area) in 2016 (Eckert et al., 2017), which was used as the area under greenhouse production for this study. Monthly average ETo was calculated by CROPWAT using Nanyuki weather data and rainfall data from the Kalalu station were used. A crop factor (Kc) approach was used to estimate actual crop evapotranspiration (ETc) for roses, as proposed by the FAO (Allen et al., 1998). Data on LAI dynamics of roses grown in the Upper Ewaso Ng'iro basin were unavailable. The crop factor was derived from a study conducted by Singh et al. (2016) where ETc values were determined daily from drum lysimeters kept inside and outside greenhouses. This was done in The Netherlands for Dutch roses for 3 years of full crop cycles and then averaged on a monthly basis. The rose plant is perennial and so it has more than one harvest cycle that consequently affects the Kc value. During periods of full ground cover the Kc needs to be increased and as pruning and harvesting are done the Kc must decrease. It was found that under greenhouse conditions the Kc during the initial stage is 0.48 to 0.6, 0.6 to 0.86 during the development stage, 0.87 to 0.96 during the middle stage and 0.96 to 0.76 during the late season. Since the estimate was used for all production in the basin assumed to be under different cropping cycles, and since the site is on the equator, the values recommended by Singh et al. (2016) were averaged to obtain a Kc of 0.81 for the whole year. The results of the Kc × ETo calculation were then adapted to local conditions according to Tipis and Mpusia (2006), who proposed that ETc for roses grown in greenhouses in Kenya is 65% less than outdoor ETc at an LAI of 0.85. Rose water use was then assumed to be representative of all greenhouse production in the region. In line with Mekonnen et al. (2012), we assumed all water used to be blue water, although it is acknowledged that many of the greenhouses harvest rainwater off the roofs. The volume of rain falling on this land use was multiplied by 0.9 to account for an estimated 10% evaporative losses directly from the roof material, and the area under greenhouse production, to get blue water additions to the basin. A fraction of 10% of the irrigated water was assumed to drain back into the system and become blue water further downstream or be added to the groundwater, since at least some drainage will be needed to leach salts from the root zone.
Horticultural dams and other surface water
According to Mutiga et al. (2011), surface waters cover 1% of the basin or 15 200 ha. Ngigi et al. (2008) reported that water bodies cover 0.04% of the Naro Moru sub-basin. Kaufmann (2017) estimated that water covers 0.1% of the basin, but noted that this estimate was for the analysis of a dry season satellite image. It was also noted that smaller pools and rivers are challenging to capture due to the large pixel size of the image used. Lanari (2014) reported that from 2003-2013, storage water and groundwater use in Nanyuki's horticulture sector increased by approximately 15%. Much uncertainty, therefore, underlies the estimation of surface water covering the basin, and we assumed that water bodies cover 0.5% of the surface area.
Evaporation losses from surface water are relatively high. For the blue water 'consumption' (evaporation) of these water bodies, evaporation was assumed to equal ETo as estimated by CROPWAT (Table 2), multiplied by 1.0 (Allen et al., 1998). Rainfall for Kalalu (monthly average of measured data) falling on the dams was considered an addition of blue water in the calculation.
Built-up areas
Areas that have been developed have been estimated to cover 0.2% of the basin area (Mutiga et al., 2017). It was assumed that 20% of the rain that falls on these areas evaporates while the rest (80%) becomes runoff and blue water.
Human needs
The human population within the basin was assumed to be 500 000 people, with each person using 50 L∙day-1 (Mutiga et al., 2010b). No return flows for human-consumed water were assumed for the basin.
Livestock and wildlife
Following the approach of Mutiga et al. (2010b), livestock and wildlife were assumed to number 700 000 with each having a water requirement of 50 L∙day-1. It is recognized that some of this water intake is via the moisture in the vegetation consumed but, for our purposes, all water was assumed as acquired from blue water resources.
Validation
The water footprint framework result was assessed using flow data from Archer's Post, which is on the lower reaches of Ewaso Ng'iro River and the only known outlet of the basin. Measured flow rates were averaged at the monthly followed by the decadal time scale for the 1960-2000s. Blue water use was subtracted from blue water availability at the basin scale to obtain a water footprint framework-estimated stream flow on a monthly time-step, as follows:
Streamflow = precipitation - aquifer recharge - ET of natural vegetation (forest, woody grassland, grassland) - ET of agriculture (rainfed, irrigated) - E of surface water - E from built-up areas - additional uses of water (domestic, livestock) (5)
Aquifer recharge data were not available for the basin, so we hypothesized that blue water available - blue water used - stream flow (measured at Archer's Post) would give a rough indication of water that is remaining in the basin as groundwater (calculated on an annual time step).
RESULTS
Validation of the framework and estimation of blue water availability
A comparison of blue water available, minus consumed in the basin, to river flow past Archer's Post followed a very similar trend at the monthly time scale (Fig. 3). In January, February, March, September and December, blue water available minus consumed was lower or similar to flow rates observed for Archer's Post over 5 decades, highlighting the elevated water scarcity in these months. In February there was even a negative value, which can be explained by the capture of floodwater in storage dams in reality that is used for irrigation in the drier months. The water footprint framework also does not consider spatial lags as the water moves from the highlands to the lowlands as happens in reality.
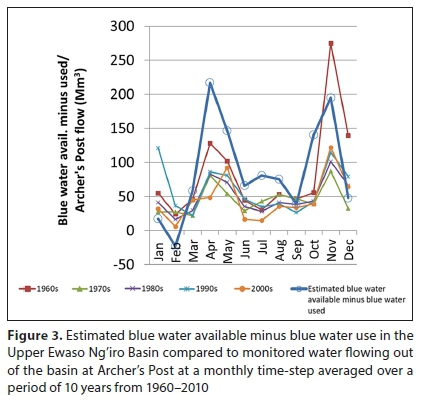
Subtracting what leaves the basin at Archer's Post (692 Mm3) from blue water availability (1 269 Mm3) minus consumption (303 Mm3) may give some indication of annual groundwater recharge. Over a year, 275 Mm3∙yr-1 is not accounted for as being consumed within the basin or passing Archer's Post as surface flow. Mutiga et al. (2010b, citing JICA, 2012) estimated groundwater replenishment to be 120-220 Mm3∙yr-1, with levels varying from 18 to over 200 m in depth. There is reported to be some sub-surface flow of water across the border into Somalia and then into the ocean, but these flow volumes are unknown (Ericksen et al., 2011).
Blue water consumption
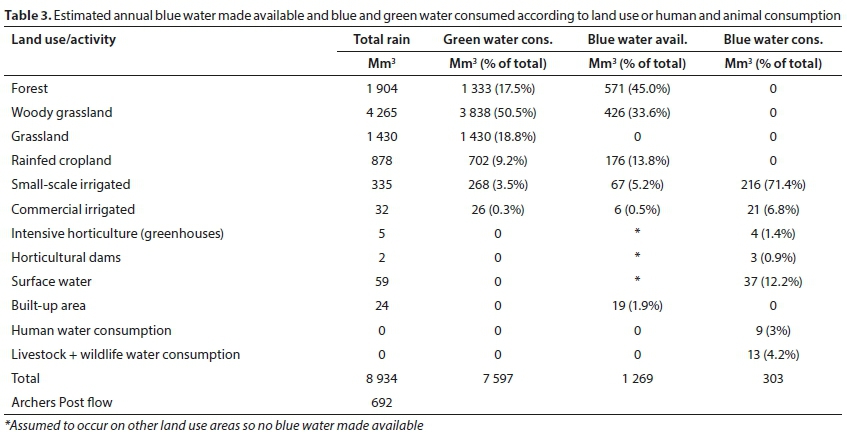
Forest and woody grassland were estimated to contribute over 78% of available blue water via runoff, followed by rainfed cropland (13.8%), small-scale irrigation (5.2%), built-up areas (1.9%) and commercial irrigation (0.5%) (Table 3). An estimated 303 Mm3 of blue water is consumed annually in the Upper Ewaso Ng'iro Basin, in contrast to 7 597 Mm3 of green water. Small-scale irrigation was estimated to use 71.4% of consumed blue water resources (216 Mm3), while irrigation under the 625 ha of greenhouses was estimated to use only 1.4% (4 Mm3). Human water consumption was estimated to be 3.0% and livestock and wildlife consumption was estimated to be 4.2% of consumed blue water. After irrigation, evaporation from surface water was estimated to be the biggest 'consumer' of blue water, accounting for 12.2% (37 Mm3∙yr-1). Dams linked to intensive greenhouse production were estimated to evaporate volumes of water comparable to what was used in the greenhouses themselves, or 0.9% of blue water consumed (3 Mm3∙yr-1). While some of this surface water includes rivers transporting water downstream, evaporative losses of blue water still represent a significant fraction.
It was previously reported in the popular press in the United Kingdom that 'the 12 largest flower firms [on the northern slopes of Mount Kenya] which farm hundreds of hectares of flowers, fruit and vegetables in the region and supply supermarkets such as Tesco, Sainsbury's and M&S and the European market, may be taking as much as 25% of water normally available to more than 100 000 small farmers' (The Guardian, 2006). On an annual basis, our data indicate that this percentage for flower, fruit and vegetable production is lower than this previous estimate, at around 9%, or 10% if evaporation from newly built irrigation storage dams is included. Both human and livestock and wildlife consumption is estimated to be higher than greenhouse horticultural production.
For the total area under horticultural production (consisting of 1 385 ha of greenhouse flower production and open field vegetable production), Lanari (2014) estimated a dry season demand of 663-898 L∙s-1 based on whether the estimate was made using information from interviews with farmers regarding volumes pumped (leading to a lower estimate) or from calculating the potential demand assuming a 5 mm∙day-1 ETo and a kc of 0.8 (leading to the higher estimate). This is the equivalent of 4.2-5.7 Mm3 used for February and similar to our estimate of commercial field and greenhouse irrigation of 5.3 Mm3.
Mekonnen et al. (2012) estimated that the blue plus green water footprint of a single rose produced in the Lake Naivasha Basin is 6 L∙stem-1. Assuming 100 stems∙m-2∙yr-1 (Da Silva, 2018) and actual crop evapotranspiration of 684 mm∙yr-1, we estimate the blue water footprint of a rose produced in the region of Nanyuki to be 6.8 L∙stem-1. For the Upper Ewaso Ng'iro, Lanari (2014) estimated that 328 ha was dedicated to rose production which, multiplied by our values, means this crop uses 2.2 Mm3 (272 m3∙t-1 assuming 1 stem = 25 g (Mekonnen et al., 2012)), or only 0.73% of the basin's consumed blue water.
Green water consumption
Forests were estimated to use 17.5% (1333 Mm3) of green water, while woody grassland and grassland was estimated to use 50.5% (3838 Mm3) and 18.8% (1 430 Mm3) of green water, respectively. The latter two land uses would contribute vegetation for livestock and wildlife feed, so some of this green water consumption would have gone towards meat production. Rainfed cropland was estimated to use 12.9% (702 Mm3) of green water, with irrigated agriculture (excluding greenhouses) consuming the remaining 3.8% of green water (294 Mm3).
Water productivity
The monetary value per tonne of roses was estimated to be just under 20 times higher than that of 1 tonne of maize. The water footprint of maize was estimated to be 6.6 times higher for maize than for roses. This does, however, not account for any benefit gained from the non-harvested maize residues, for example, if used as animal feed. Rose production was estimated to create 8.8 times more labour opportunities than small-scale farming per hectare and 9.4 times more labour opportunities per m3 water used (Table 4). The water productivity per m3 used was estimated to be 128 times higher for roses based on selling price.
DISCUSSION
While the water footprint information generated here is subject to a number of inaccuracies due to the broad assumptions made, an advantage is that it brings together information on total water availability and consumption in the basin that can be understood by a diverse group of stakeholders. Having flow data for the basin outlet at Archer's Post proved highly valuable for testing purposes, which may not be available for many other basins in SSA. A simple model with all assumptions declared is also more straightforward to understand and apply than a more complex one that can be a 'black box', even to expert users, due to the complex interaction of parameters and other input data that such a model utilizes. Considering not only blue water consumption but also indicating and quantifying the sources of blue water can contribute to a better understanding of the inter-linkages of land uses and different activities within a basin.
Flower production was estimated to use relatively little water, at about 1.4% of blue water consumption. Measuring water use of crops growing in greenhouse tunnels is very challenging, and many of the standard techniques used on crops grown in open fields cannot be applied. Growers' use of natural and forced ventilation, the degree to which vents are opened, the thickness of plastic covers, and different warming processes utilized are some of the ways the microclimate can be strategically modified from hour to hour. More work is needed on this aspect, but since flower production currently covers such a small area of the basin and is grown in humid greenhouses where ET is reduced, overall impact in terms of consumption will be low despite any error in the assumptions. For growers that harvest rainwater, this impact on blue water availability is even lower.
In previous attempts to address irrigation's impact on river flow in the basin during the critical dry season, it was made a requirement that irrigators upstream build storage dams to capture floodwaters during the rainy season and use only this water during the low-flow periods (Lanari, 2014). One of the consequences of this, however, is that more blue water is evaporated from these dams. This is considered an unproductive loss of water as there is no financial gain to its consumption (Perry, 2007), and there is also little ecological benefit. In this case, unproductive losses from the 218 ha of horticultural dams were estimated to be almost as much as ET losses from the plants in the greenhouses. Some of the dams linked to commercial irrigation consist not just of captured floodwaters, but also water pumped from groundwater and stored in the reservoirs ready for irrigation. Moving groundwater to the surface is not ideal in water-scarce regions because of the exposure to evaporative losses. Investments in evaporation prevention measures (Hassan et al., 2015) may be an option to reduce these losses.
Small-scale irrigators are estimated to use the majority of blue water resources, with uncertainty surrounding the estimates on how much they can irrigate, the crop factor, and the area of land irrigated. Improving water use efficiency at the field level through better management and technologies will be key to increasing water productivity and food production in the basin. However, more efficient irrigation may lead to reduced return flows available to downstream users. Irrigators may also intensify their practices and expand either vertically (more intensive on the same area) or horizontally (irrigate a larger area), maintaining or increasing the demand for irrigation water unless the situation is well-governed. Rainwater harvesting has been proposed as a means of improving water availability within the basin (Ngigi et al., 2007). As with improving irrigation use efficiency, this may reduce water availability to downstream users due to reduced runoff. Despite runoff also occurring from croplands and contributing to blue water availability, it should be noted that conversion of forest areas to cropland interferes with the flow-regulating function as croplands hold water less efficiently (Ericksen et al., 2011).
For the Upper Ewaso Ng'iro Basin, the size of the groundwater resource and annual exploitable groundwater is unknown. Our blue water available minus blue water consumed minus Archer's Post outflow estimate indicates that there may be more exploitable groundwater than previously estimated, although the importance of water to people and ecosystems downstream of Archer's Post must be carefully considered. The increased water needs of developments linked to the LAPSSET corridor mega-project (http://www.lapsset.go.ke/) in and around Isiolo also need to be considered. Great caution is required, therefore, to first validate this estimate using more quantitative hydrological studies before groundwater allocations can be increased.
A water footprint linked to a specific product, for example, a bag of maize or bunches of flowers, may help the various water users better appreciate the finite amount of produce that can be produced in a season from this shared resource. With increasing competition for scarce water resources, water productivity metrics become more important to decide how to best utilize the resource. For example, labour opportunity creation per hectare and per m3 of water used was estimated to be close to 10 times higher for roses than for maize. The use of water to grow a product that cannot be consumed locally as food further needs to be considered in the context of the region being studied. Greater access to agrochemicals such as fertilisers and pesticides can be expected to increase maize yields, making these metrics even more favourable for maize, while rose production has probably been largely optimized already.
Limitations of the framework
The following are limitations of the framework presented:
•Rainfall: In the heterogeneous mountainous catchments, rainfall can vary widely and is difficult to monitor (Notter et al., 2007), adding to the uncertainty of the results. For example, based on the framework, which assigns different land uses to relevant rainfall data, 9 261 Mm3∙yr-1 of rain falls on the basin, while simply assuming an area of 15 200 km2 and an average annual rainfall of 700 mm∙yr-1, 10 640 Mm3∙yr-1 falls on the basin. So, non-representative rainfall estimates can be a source of significant inaccuracy.
•Runoff estimations: Runoff fraction will differ for different rainfall intensities and initial soil water contents. Whether simple assumptions are representative of runoff dynamics at the monthly time-scale needs further investigation.
•Evaporation estimates: Surface area of dams might change between the dry and wet seasons.
•Water quality: This has not been taken into account in the framework. Intensive horticulture production may have larger negative impacts on water quality than small-scale agriculture due to the differences in intensity of agrochemicals used. This also needs to be taken into account when determining the impact on water resources.
•The ecological flow requirement was not taken into account, and is recommended for future work.
CONCLUSIONS
Mechanistic hydrological models have improved our under-standing of basin water dynamics, but require intensive input data for calibration and validation that are often not available in developing countries. Compensating errors can always be present in these models, and the interaction of an array of inputs and parameters and processes often results in the model being a 'black box' to the user. A novel approach has been proposed here to calculate the blue and green water made available and consumed according to different land uses and human activities. Its strength lies in transparency and simplicity. Its weakness lies in the general assumptions made to represent a very heterogeneous landscape. Transferability of information needs to be assessed by taking this information back to the basin's stakeholders.
While an attempt has been made here to quantify the blue and green water footprint of the Ewaso Ng'iro Basin, sustainability has not been properly assessed and is required in future work. Impact on water quality has not been included, either, but requires urgent attention. Small-scale irrigation may use the majority of water resources with relatively low economic return. Improving management practices can greatly enhance water use efficiency. Building more dams alleviates water scarcity in the dry season, but may also result in the increased unproductive loss of water upstream at the expense of users downstream, including the environment.
Such a framework's accuracy can be continuously improved as new data become available, or by dividing the region into smaller areas and calibrating accordingly. Cross-validation using water footprinting may also be possible through inverse modelling, if better agricultural production statistics become available to estimate water consumption (provided suitable crop water footprints are available). While such a framework cannot replace more complex hydrological modelling, it could play a role in focusing such studies. It can also be applied in making more urgent policy decisions while hydrological studies are underway, and compatibility with water productivity studies could also lead to better initial policy decisions on scarce water resource allocations.
ACKNOWLEDGMENTS
The authors would like to thank Dr Hanspeter Liniger (Centre for Development and Environment, University of Bern) and Dr Boniface Kiteme and staff of the Centre for Training and Integrated Research in Arid and Semi-Arid Lands Development (CETRAD) for providing weather and streamflow data and GIS maps. This research was part of the Afgroland project (www.afgroland.net). It was financed jointly by the Agence Nationale de la Recherche, France; National Research Foundation, South Africa; and Swiss National Science Foundation, Switzerland through the Belmont Forum and Joint Programming Initiative on Agriculture, Food Security and Climate Change (FACCE-JPI).
REFERENCES
AESCHBACHER J, LINIGER H and WEINGARTNER R (2005) River water shortage in a highland-lowland system: a case study of the impacts of water abstraction in the Mount Kenya region. Mount. Res. Dev. 25 (2) 155-162. https://doi.org/10.1659/0276-4741(2005)025[0155:RWSIAH]2.0.CO;2 [ Links ]
ASDSP (Agricultural Sector Development Support Programme) (2014) Volume 1: Household Baseline Survey Report - Laikipia County. Ministry of Agriculture, Livestock and Fisheries, Kenya. [ Links ]
AFFA (Agriculture, Fisheries and Food Authority) (2014) Horticulture Validated Report 2014. http://www.agricultureauthority.go.ke/wp-content/uploads/2016/05/Horticulture-Validated-Report-2014-Final-copy.pdf (Accessed 16 May 2018). [ Links ]
ALLEN RG, PEREIRA LS, RAES D and SMITH M (1998) Crop evapotranspiration - Guidelines for computing crop water requirements. FAO Irrigation and Drainage Paper 56. FAO, Rome. [ Links ]
ANSEEUW W, WILY LA, COTULA L and TAYLOR M (2012) Land rights and the rush for land: Findings of the global commercial. ILC, Rome. [ Links ]
DA SILVA M (2018) Potential on- and off- site environmental impacts of large agricultural investments versus small-scale farming in Kenya and Mozambique. MSc(Agric) dissertation, University of Pretoria, South Africa. [ Links ]
DE LEEUW J, SAID MY, KIFUGO S, MUSYIMI Z, MUTIGA JK and PEDEN D (2012) Benefits of riverine water discharge into the Lorian Swamp, Kenya. Water. 4 (4) 1009-1024. https://doi.org/10.3390/w4041009 [ Links ]
DELL'ANGELO J, D'ODORICO P, RULLI MC and MARCHAND P (2017) The tragedy of the grabbed commons: Coercion and dispossession in the global land rush. World Dev. 92 1-12. https://doi.org/10.1016/j.worlddev.2016.11.005 [ Links ]
DOS SANTOS S, ADAMS E, NEVILLE G, WADA Y, DE SHERBININ A, BERNHARDT EM and ADAMO S (2017) Urban growth and water access in sub-Saharan Africa: Progress, challenges, and emerging research directions. Sci. Total Environ. 607 497-508. https://doi.org/10.1016/j.scitotenv.2017.06.157 [ Links ]
ECKERT S, KITEME B, NJUGUNA E and ZAEHRINGER JG (2017) Agricultural expansion and intensification in the foothills of Mount Kenya: A landscape perspective. Remote Sens. 9 (8) 784. https://doi.org/10.3390/rs9080784 [ Links ]
ERICKSEN P, SAID M, LEEUW JD, SILVESTRI S, ZAIBET L, KIFUGO S, SIJMONS K, KINOTI J, NGANGA L and LANDSBERG F (2011) Mapping and valuing ecosystem services in the Ewaso Ng'iro watershed. Nairobi, Kenya: ILRI. URL: https://hdl.handle.net/10568/12483 (Accessed 5 July 2021). [ Links ]
FUKA DR, WALTER MT, MACALISTER C, DEGAETANO AT, STEENHUIS TS and EASTON ZM (2014) Using the Climate Forecast System Reanalysis as weather input data for watershed models. Hydrol. Process. 28 (22) 5613-5623. https://doi.org/10.1002/hyp.10073 [ Links ]
GICHUKI FN (2002a) Water scarcity and conflicts: A case study of the Upper Ewaso Ng'iro North Basin. In Blank HG, Mutero CM and Murray-Rust H (eds) The Changing Face of Irrigation in Kenya: Opportunities for Anticipating Change in Eastern and Southern Africa. IWMI, Colombo. 113-134. [ Links ]
GICHUKI FN (2002b) Water conflicts in the Upper Ewaso Ng'iro North Basin: Causes, impacts and management strategies. World Bank Water Week Conference Session 24. URL: https://hdl.handle.net/10568/38469 (Accessed 5 July 2021). [ Links ]
HASSAN MM, PEIRSON WL, NEYLAND BM and FIDDIS NM (2015) Evaporation mitigation using floating modular devices. J. Hydrol. 530 742-750. https://doi.org/10.1016/j.jhydrol.2015.10.027 [ Links ]
HOEKSTRA AY, ALDAYA MM, CHAPAGAIN AK and MEKONNEN MM (2011) The Water Footprint Assessment Manual: Setting the Global Standard. Routledge, London. https://doi.org/10.4324/9781849775526 [ Links ]
KAUFMANN F (2017) Land cover/land use classification in the Mount Kenya region and critical reflection on the production of knowledge. Philosophisch-naturwissenschaftliche Fakultät der Universität Bern. [ Links ]
KITEME BP and GIKONYO J (2002) Preventing and resolving water use conflicts in the Mount Kenya highland-lowland system through water users' associations. Mount. Res. Dev. 22 (4) 332-337. https://doi.org/10.1659/0276-4741(2002)022[0332:PARWUC]2.0.CO;2 [ Links ]
LANARI N (2014) Development of the commercial horticulture sector northwest of Mount Kenya from 2003 to 2013 and its impact on river water resources of the Upper Ewaso Ng'iro Basin. https://doi.org/10.1659/MRD-JOURNAL-D-16-00135 [ Links ]
LANARI N, SCHULER R, KOHLER T and LINIGER H (2018) The impact of commercial horticulture on river water resources in the Upper Ewaso Ng'iro River Basin, Kenya. Mount. Res. Dev. 38 (2) 114-125. [ Links ]
LE ROUX B, VAN DER LAAN M, GUSH MB and BRISTOW KL (2018) Comparing the usefulness and applicability of different water footprint methodologies for sustainable water management in agriculture. Irrig. Drain. 67 (5) 790-799. https://doi.org/10.1002/ird.2285 [ Links ]
LE ROUX B, VAN DER LAAN M, VAHRMEIJER T, BRISTOW KL and ANNANDALE JG (2017) Establishing and testing a catchment water footprint framework to inform sustainable irrigation water use for an aquifer under stress. Sci. Total Environ. 599 1119-1129. https://doi.org/10.1016/j.scitotenv.2017.04.170 [ Links ]
LUNDGREN L (1980) Comparison of surface runoff and soil loss from runoff plots in forest and small-scale agriculture in the Usambara Mts., Tanzania. Geografiska Annaler: Series A, Phys. Geogr. 62 (3-4) 113-148. https://doi.org/10.1080/04353676.1980.11880005 [ Links ]
MATI BM, MUCHIRI JM, NJENGA K, DE VRIES FP and MERREY DJ (2006) Assessing water availability under pastoral livestock systems in drought-prone Isiolo District, Kenya. Working Paper 106. International Water Management Institute, Colombo. [ Links ]
MEKONNEN M, HOEKSTRA AY and BECHT R (2012) Mitigating the water footprint of export cut flowers from the Lake Naivasha Basin, Kenya. Water Resour. Manage. 26 (13) 3725-3742. https://doi.org/10.1007/s11269-012-0099-9 [ Links ]
MESSERLI P, GIGER M, DWYER MB, BREU T and ECKERT S (2014) The geography of large-scale land acquisitions: Analysing socio-ecological patterns of target contexts in the global South. Appl. Geogr. 53 449-459. https://doi.org/10.1016/j.apgeog.2014.07.005 [ Links ]
MUTIGA J, ZHONGBO S and WOLDAI T (2011) Impacts of agricultural intensification through upscaling of suitable rainwater harvesting technologies in the upper Ewaso Ng'iro North basin, Kenya. Hydrol. Earth Syst. Sci. Discuss. 8 (2) 2477-2501. https://doi.org/10.5194/hessd-8-2477-2011 [ Links ]
MUTIGA JK, MAVENGANO ST, ZHONGBO S, WOLDAI T and BECHT R (2010b) Water allocation as a planning tool to minimise water use conflicts in the Upper Ewaso Ng'iro North Basin, Kenya. Water Resour. Manage. 24 (14) 3939-3959. https://doi.org/10.1007/s11269-010-9641-9 [ Links ]
MUTIGA JK, SU Z and WOLDAI T (2010a) Using satellite remote sensing to assess evapotranspiration: Case study of the upper Ewaso Ng'iro North Basin, Kenya. Int. J. of Appl. Earth Obs. Geoinform. 12 S100-S108. https://doi.org/10.1016/j.jag.2009.09.012 [ Links ]
MUTUNGA C (1995) The influence of vegetation cover on runoff and soil loss - a study in Mukogodo, Laikipia district, Kenya. MSc thesis, University of Nairobi. [ Links ]
MUYANGA M and JAYNE TS (2014) Effects of rising rural population density on smallholder agriculture in Kenya. Food Policy. 48 98-113. https://doi.org/10.1016/j.foodpol.2014.03.001 [ Links ]
NGIGI SN, SAVENIJE HH and GICHUKI FN (2007) Land use changes and hydrological impacts related to up-scaling of rainwater harvesting and management in upper Ewaso Ng'iro river basin, Kenya. Land Use Polic. 24 (1) 129-140. https://doi.org/10.1016/j.landusepol.2005.10.002 [ Links ]
NGIGI SN, SAVENIJE HH and GICHUKI FN (2008) Hydrological impacts of flood storage and management on irrigation water abstraction in upper Ewaso Ng'iro river basin, Kenya. Water Resour. Manage. 22 (12) 1859-1879. https://doi.org/10.1007/s11269-008-9257-5 [ Links ]
NJERU JLG (2004) Monitoring and modeling crop growth, water use and production under dry-land environment north-west of Mount Kenya. PhD thesis, University of Bern. [ Links ]
NOTTER B, MACMILLAN L, VIVIROLI D, WEINGARTNER R and LINIGER H-P (2007) Impacts of environmental change on water resources in the Mt. Kenya region. J. Hydrol. 343 (3) 266-278. https://doi.org/10.1016/j.jhydrol.2007.06.022 [ Links ]
OBERLACK C, GIGER M, ANSEEUW W, ADELLE C, BOURBLANC M, BURNOD P, ECKERT S, FITAWEK W, FOUILLEUX E, HENDRIKS SL, KITEME B, MASOLA L, MAWOKO ZD, MERCANDALLI S, REYS A, DA SILVA M, VAN DER LAAN M, ZAEHRINGER JG, MESSERLI (2021) Why do large-scale agricultural investments induce different socio-economic, food security, and environmental impacts? Evidence from Kenya, Madagascar, and Mozambique. Ecol. Soc. (accepted for publication). [ Links ]
PERRY C (2007) Efficient irrigation; inefficient communication; flawed recommendations. Irrig. Drain. 56 (4) 367-378. https://doi.org/10.1002/ird.323 [ Links ]
RATIN (Regional Agricultural Trade Intelligence Network) (2018) http://ratin.net/site/page/kenya (Accessed 16 May 2018). [ Links ]
UNHCR (United Nations High Commissioner for Refugees / UN Refugee Agency) (2019) Dadaab refugee complex. https://www.unhcr.org/ke/dadaab-refugee-complex (Accessed 29 April 2019). [ Links ]
ZAEHRINGER JG, WAMBUGU G, KITEME B and ECKERT S (2018) How do large-scale agricultural investments affect land use and the environment on the western slopes of Mount Kenya? Empirical evidence based on small-scale farmers' perceptions and remote sensing. J. of Environ. Manage. 213 79-89. https://doi.org/10.1016/j.jenvman.2018.02.019 [ Links ]
 Correspondence:
Michael van der Laan
EMAIL: michael.vanderlaan@up.ac.za
Received: 23 November 2019
Accepted: 3 July 2021


