


Servicios Personalizados
Articulo
 Inglés (pdf)
 Articulo en XML
 Referencias del artículo
Indicadores

Links relacionados
-
 Citado por Google
 -
 Similares en Google
Compartir

 Permalink
Water SA
versión On-line ISSN 1816-7950
versión impresa ISSN 0378-4738
Water SA vol.47 no.3 Pretoria jul. 2021
http://dx.doi.org/10.17159/wsa/2021.v47.i3.11862
RESEARCH PAPER
A new modified spatial approach for monitoring non-perennial river water availability using remote sensing in the Tankwa Karoo, Western Cape, South Africa
Dylan Seaton; Timothy Dube
Institute for Water Studies, Department of Earth Sciences, University of the Western Cape, Bellville, South Africa
ABSTRACT
Non-perennial rivers (N-PRs) make up two thirds of all rivers in South Africa, yet many are ungauged. Traditionally, it has been assumed that when a flow is recorded, there is water throughout that river. These assumptions have led to incorrect estimations of available water resources. This work thus aimed at developing a new spatially explicit framework, for monitoring river water availability in a N-PR system. The Tankwa River in South Africa was used for testing this approach. The length of the river reach with water was determined using the Sentinel-1 and Sentinel-2 data derived indices. Image thresholding was applied to Sentinel-1, and the normalised difference water index (NDWI) to Sentinel-2. Sentinel-2 yielded an overall accuracy (OA) of 85%, whereas Sentinel-1 yielded an OA of 38%. The analysed reach of the Tankwa River had an actual length of 9 244 m. Based on the performance of Sentinel-2 data, further analysis was undertaken using Sentinel images acquired during the months of February, May and July of 2016. The results indicated that the lengths of the reaches of inundated Tankwa River were 2 809 m, 3 202 m and 2 890 m, respectively. Overall, the findings of this study show that an estimated length of a river inundated by water can be determined using new-generation Sentinel data and these results provide new insights on the dynamics of N-PRs - a previously challenging task with broadband multispectral satellite datasets.
Keywords: non-perennial rivers; remote sensing; water resource management; semi-arid environments; Sentinel-1 and -2 data; South Africa; synthetic aperture radar (SAR)
INTRODUCTION
Non-perennial rivers (N-PRs) make up two thirds of all rivers in semi-arid environments, yet many are ungauged. Also, these rivers are very unpredictable and complex due to the associated highly variable flow regimes (Seaman et al., 2016). However, their range of flow variability is important for the surrounding ecosystems. For example, the onset and duration of wet and dry periods within N-PRs influences the surrounding ecological patterns and processes (Cid et al., 2017). For example, the natural high flows of N-PRs facilitate the mixing of gene pools, as well as the transportation of sediments, nutrients and organisms to downstream rivers (Seaman et al., 2016). During extreme floods these rivers are able to recharge aquifers, ensuring water availability for the growth of riparian vegetation during dry seasons (Jacobson et al., 1995; Rossouw and Watson, 2005). The natural low-flow characteristics of these rivers allow for sediment and nutrient deposition (King et al. 2003; Poff et al. 1997). During periods of no flow, isolated pools form along the channels of N-PRs, which play a significant role in flood control, groundwater recharge, pollution filters, provide refuge for aquatic biota, as well as provide a primary water source for wildlife and livestock (USEPA., 2015; Rhazi et al., 2011; Rossouw and Watson, 2005).
Despite their significance, N-PRs have often been overlooked in the past as these rivers are generally regarded as being of low economic and ecological relevance (Datry et al., 2017; Skoulikidis et al., 2017; McDonough et al., 2011). This is worrying as N-PRs make up about two-thirds of all rivers in South Africa (Rossouw, 2011). Most of these rivers are ungauged and measured flow data are often unavailable, making it difficult to account for the quantity of water resources available in these rivers (Haas et al., 2009; Makungo et al., 2010). Measuring river flows has been the main approach for monitoring water resource availability in a river. Traditionally, it has been assumed that when a flow is recorded in a river, there is water available throughout the course of that river. This is not always the case, and these assumptions can lead to incorrect estimation of available water resources as they fail to capture information related to the extensive use of river water, thus causing ecological degradation and the loss of biological diversity and, more importantly, aquatic life (King et al., 2004; Poff et al., 1997). Additionally, the installation of flow gauges for in-situ monitoring is labour-intensive and costly (Omute et al., 2012), and inadequate funding for the development of hydrological networks restricts the assessment of water resources in most countries (Hughes et al., 2014; Kapangaziwiri et al., 2012; Smakhtin et al., 2004; Solander et al., 2016). Therefore, alternative methods for surface water monitoring need to be explored in data-scarce areas, especially in developing countries.
Remote sensing is widely used for hydrological monitoring (Omute et al., 2012) and the monitoring of water resources using remote sensing is well-documented (Avisse et al., 2017). Satellite remote sensing has arguably become the most practical method of mapping and monitoring surface water. Optical and radar datasets have been used extensively to provide information on surface water availability and open water dynamics (Montgomery et al., 2018; Sarp and Ozcelik, 2017). However, the problem of selecting a suitable remote-sensing dataset, in terms of its spatial resolution, return period, classification method, and ability to overcome environmental factors such as cloud cover, can be challenging (Seaton et al., 2020; Soti et al., 2009). There is an inevitable trade-off between the satellite used, the spatial resolution, the classification method, the return period and the acquisition cost.
Coarse resolution datasets, such as MODIS, offer daily revisit times across any region of the world, but are not feasible for mapping small surface water features that range from less than one square metre to several thousand square metres. Very-high-resolution datasets, such as SPOT, offer more detailed information and, thus, more accurate mapping; however, the cost, and limited number of spectral bands, make it impractical to apply a wide range of satellite image classification techniques. Medium-resolution sensors, such as the Sentinel-1 Synthetic Aperture Radar (SAR) satellite and the optical Sentinel-2 Multispectral Imager (MSI) offer freely available data, with weekly revisit times. Several SAR and optical-based water detection methods have been developed over the years, but no single classification method has been shown to be the most suitable for monitoring and mapping waterbodies (Fisher et al., 2016). This has led to uncertainties as to which dataset and method is most suitable for mapping surface water.
For SAR image analysis, various methods have been developed to discriminate water and non-water areas. These methods include: thresholding, supervised, unsupervised, object-based and hybrid analysis. Of these methods, thresholding is the most widely adopted (Bioresita et al., 2018). Thresholding is based on the contrast of low backscatter (darker features) from water bodies and high backscatter (lighter features) from surrounding terrains. Flat-water surfaces act as mirrors, reflecting almost all incoming radiation, and cause very low backscatter. Therefore, by applying a threshold to separate low backscatter values, surface water can be separated from background features (Bioresita et al., 2018; Pham-Duc et al., 2017). SAR data also has the ability to map the earth's surface in any weather conditions, making it highly favourable for continuous surface water monitoring (Pham-Duc et al., 2017).
Semi-automatic image classification methods for optical data are commonly grouped into three categories. The first category involves single-band threshold methods, which make use of the spectral values of single bands by applying a threshold value to discriminate water from non-water features (Feyisa et al., 2014; Jiang et al., 2014; Rokni et al., 2014; Sawunyama et al., 2006). The second category involves the use of machine-learning classification techniques to identify water from multispectral imagery (Jiang et al., 2014), such as 'maximum likelihood'. The third category consists of multiband methods, which combine spectral bands using mathematical models to enhance water features, while simultaneously restricting or eliminating surrounding features (Sisay, 2016). These methods are the most commonly adopted approaches for mapping surface water (Fisher et al., 2016; Jiang et al., 2014; Rokni et al., 2014; Seaton et al., 2020). The normalised difference water index (NDWI), developed by McFeeters (2013), is the most well-known of these methods, which makes use of the near infrared (NIR) and green bands to enhance water while suppressing the surrounding vegetation and land.
Therefore, we investigated the use of the Sentinel-1 and Sentinel-2 remotely sensed datasets in detecting, mapping and monitoring surface water availability along a N-PR. In addition, we also determined to what extent the length of a river inundated with water can be estimated. Further, we explored the possibility of determining and measuring the river stretches that exhibited pool connectivity. We selected a reach along the Tankwa River, as the monitoring and experimental site, due to its significance to the Tankwa Karoo National Park and surrounding ecosystems, as well as its contribution to the Oudebaaskraal Dam which attracts over 100 species of birds (Strauss et al., 2014; Van der Merwe et al., 2015).
METHODS AND MATERIALS
Study area
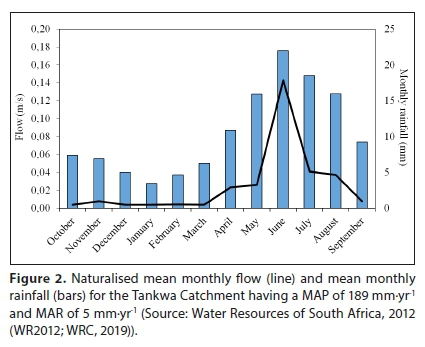
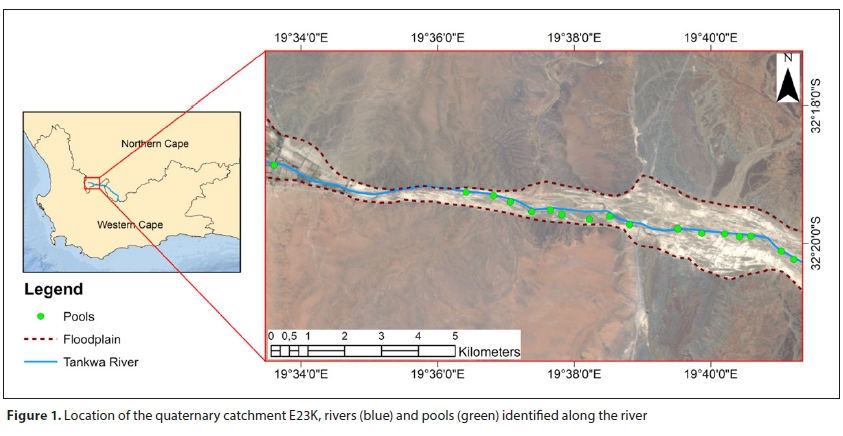
The Tankwa River is situated in the Olifants/Doorn drainage region of the Western Cape, partially within the boundaries of the Tankwa Karoo National Park (Fig. 1). Annual rainfall for the Tankwa region falls in the range of 0-500 mm, with 25% of the rainfall falling in summer (Strauss et al., 2014). The mean minimum winter temperature is 6°C, while the mean maximum summer temperature is 39°C (Strauss et al., 2014). The study area lies within the South African quaternary catchment E23K, with a drainage area of 6 445 km2. Using data provided by the Water Resources of South Africa, 2012 study (WR2012) of the South African Water Research Commission (WRC, 2019: https://waterresourceswr2012.co.za/), catchment E23K experiences a mean annual precipitation (MAP) of 126 mm∙yr-1 and mean annual runoff (MAR) of 9 mm∙yr-1. Rainfall follows a broad seasonal pattern, increasing gradually from February to June, peaking in June, and decreasing significantly from July to January (Fig. 2). Naturalised mean monthly river flows also show the same general seasonal pattern. Almost no flow is recorded from September to March, and flow only starts increasing in April, eventually peaking in June and decreasing thereafter (Fig. 2).
Ancillary data
This study used rainfall data to determine when the greatest chance of water throughout the Tankwa River would occur. Rainfall data for the Brakfontein: Die Bos Calvinia weather station were collected for 2016 (Fig. 3), from the Agricultural Research Council (ARC). Periods of high rainfall were identified and the subsequent remote-sensing datasets were downloaded to identify the highest chances of water being present throughout the river. The Tankwa region experienced several relatively large rainfall events in 2016, with the largest occurrences in January, May and July of 2016 (Fig. 3).

Sentinel data and pre-processing
Sentinel-1 and Sentinel-2 are sun-synchronous constellation satellites. The spatial resolution of Sentinel-1 ranges from 5-100 m, while the spatial resolution of Sentinel-2 ranges from 10-60 m. Both constellations have short revisit times, from 5-12 days. Sentinel-1 has a swath width of 400 km, while Sentinel-2 has a swath width of 290 km, which makes it suitable for catchment-scale monitoring. The Sentinel-1 satellites carry a C-band synthetic aperture radar instrument, capable of taking images in any weather conditions and time of day (Pham-Duc et al., 2017), making it a more desirable dataset for consistent surface water monitoring. Sentinel-1 also has dual polarization capabilities (HH, VV, HH + HV and VV + VH), allowing for a large variety of applications, including surface water monitoring. Sentinel-2 is a multispectral imager (MSI) capable of taking images in the near-infrared (NIR), visible and shortwave-infrared (SWIR) parts of the spectrum (ESA, 2015). The specifications of both these sensors result in the provision of promising data for mapping large areas in detail. This is important as rivers are often hundreds of kilometres long and their widths vary significantly.
The Sentinel-1 and 2 data were downloaded from the European Spaces Agency's Copernicus Open Access Hub (ESA, 2021). Sentinel-1 was downloaded as Level-1 GRD products and Sentinel-2 was downloaded as Level-1C TOA reflectance products (ESA, 2015). Sentinel-1 underwent several pre-processing steps before analysis, while Sentinel-2 was used directly for analysis (Seaton et al., 2020). The pre-processing steps for Sentinel-1 are outlined in the 'SAR Basics with the Sentinel-1 Toolbox in SNAP tutorial' (Pham-Duc et al., 2017). The Sentinel Application Platform (SNAP) is free-to-download software designed to utilise Sentinel products in a user-friendly manner.
Firstly, the dataset was calibrated to convert the raw digital number values to a radar backscatter coefficient (σ0). Secondly, the Lee filter was applied to reduce the speckle noise and to smooth the radar backscatter coefficient data because this filter maintains details of the standing water boundary. The Refined Lee, Lee Sigma and Median were also tested, but showed little differences in terms of water detection. Thirdly, terrain correction was used to compensate for distortions in the Sentinel-1 images, so that the geometric presentation of the image will be as close as possible to the real world. Finally, the images were re-projected from the satellite projection to the Earth geographic projection. The dates of the Sentinel-1 and Sentinel-2 datasets that were downloaded are given in Table 1. Cloud cover restricted the availability of Sentinel-2 datasets, therefore the closest available Sentinel-2 cloud-free image to the rainfall event was selected.
Sentinel-1 surface water classification
Flat surfaces, such as water, act like mirrors and reflect incoming energy. This causes a low backscatter value for water. Thus, we can detect surface water based on this principle and use their low backscatter values to identify water features. This is achieved by selecting a threshold value on the SAR backscatter coefficient (Kuenzer et al., 2013; Nguyen and Bui, 2001; Pierdicca et al., 2013; Y. Wang, 2004). However, effects such as aquatic vegetation and wind-induced surface roughness influence the backscatter values (Kuenzer et al., 2013; Pham-Duc et al., 2017). Prigent et al. (2015) also noted the ambiguities between surface water and other very flat surfaces. In essence, the study found that the backscatter values of surface water bodies were similar to the backscatter values of other flat surfaces, such as arid regions. Although not all arid regions are flat, this is important to note, as the Tankwa Karoo is classified as an arid region (Strauss et al., 2014), and may show similar backscatter values between water surfaces and surrounding land surfaces.
Pham-Duc et al. (2017) found that water and non-water features were well separated with thresholds of -22 dB and -15 dB for the VH and VV polarizations, respectively, and the use of multiple-polarization for image classification, i.e., VH and VV, yielded accurate results. Based on their criteria, this approach was followed and the dB values for the VH and VV bands were extracted from the Sentinel-1 in SNAP, and then plotted to identify any separation between the bands to select a threshold value.
Sentinel-2 surface water classification
Due to its ease of use and high accuracy (Rokni et al., 2014; Seaton et al., 2020), the NDWI was selected to map surface water along the reach of the Tankwa River. The NDWI operates on a threshold whereby all pixels with a value greater than 0 are considered water, while all pixels with NDWI less than or equal to 0 are not considered water. The NDWI was applied to the Sentinel-2 Top-of-Atmosphere data using the raster calculator in ArcMap 10.4. The formula is shown below:
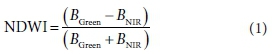
where Bgreen indicates the green band, BNIR indicates the near-infrared band.
Mapping the length of river inundated with water
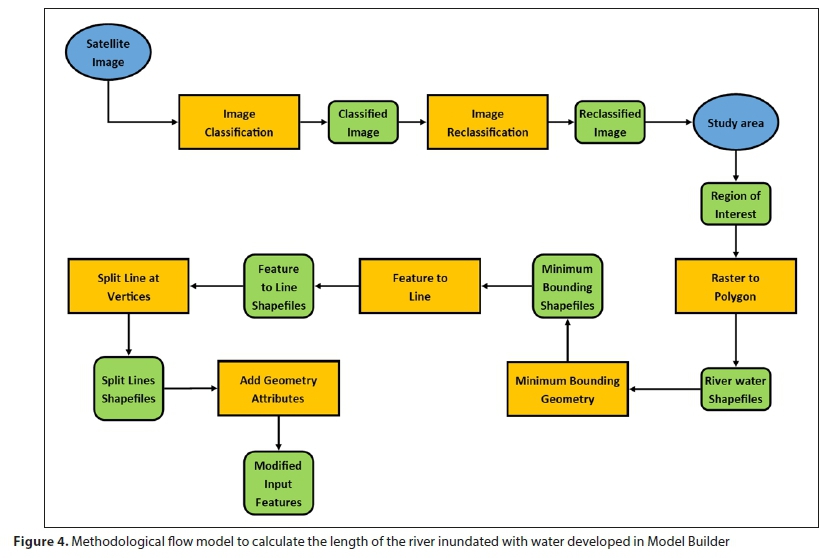
A reach of the Tankwa River was digitised using Google Earth and field verifications. GPS points were collected along the reach of the river where water was identified, during field verifications, and specific dates were sampled in Google Earth Pro to align with the dates of the Sentinel data. The approach of calculating the length of the Tankwa River inundated with water was then automated using Model Builder in ArcMap 10.4 (Fig. 4). The selected images were reclassified and converted into vector data. Minimum bounding geometry was calculated around the surface area of the river water, and then converted to feature polygons. The polygons were then converted to line features and the longest stretch was taken as the maximum length of that particular water feature/pool. This length was then calculated and added to all the other maximum lengths of the other water features to obtain the total length of the river inundated with water.
RESULTS
Sentinel-1 SAR data evaluation
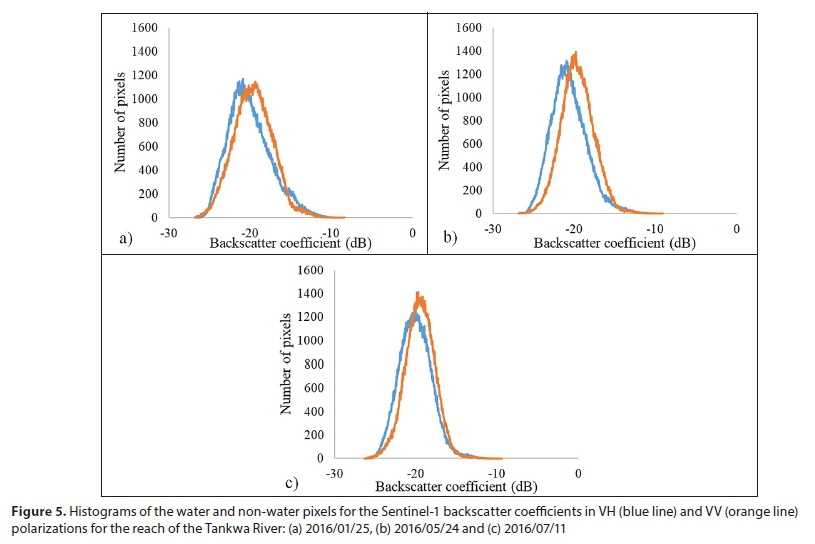
Figure 5 illustrates the variability of the backscatter for the VH and VV bands on 2016/01/25 (4a), 2016/05/24 (4b) and 2016/07/11 (4c) for distinguishing water pixels from non-water pixels. As indicated by Pham-Duc et al. (2017) and Henry et al. (2006), for each band (VH and VV), there should be a clear separation of pixel values that separate water from non-water. Figure 5 however shows almost no separation between the VH and VV bands. This may be an indication of several factors. Either the surface water bodies are too small to be identified by Sentinel-1 and by speckle-filtering the noise, the backscatter values of the water bodies were suppressed, or the uncertainty between the water and the flat arid regions of the Tankwa Karoo led to very similar backscatter signatures. Therefore, through trial and error, a threshold of 23 dB for the VH band was selected to separate water from non-water areas, as only the VH band showed a more promising result of separating water from non-water.
Sentinel-1 and Sentinel-2 data performance in the detection of water
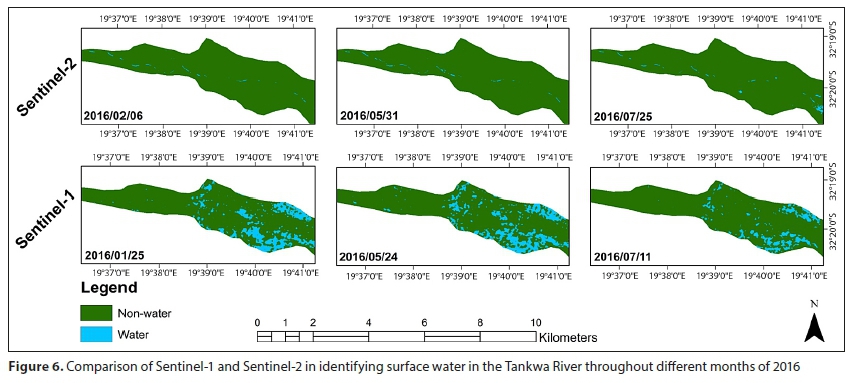
The results of the surface water classification methods applied to Sentinel-1 and Sentinel-2 are illustrated in Fig. 6. The results showed that the NDWI, applied to Sentinel-2 data, yielded more accurate results in discriminating water from non-water areas for February, May and July of 2016 in the area of interest. The results suggested that the river was not continuous and there was no water flowing throughout the reach. Water was mostly identified along the river in February and May; however, in July water was also identified along the banks. The discontinuity of water identified is expected for N-PRs (Rossouw and Watson, 2005).
The results of Sentinel-1 did not accurately discriminate between water and non-water areas (Fig. 6). Large sections of the region did not accurately identify surface water due to the similar backscatter values of VH and VV (Fig. 4). The similar dB ranges are caused by several factors, namely, the surrounding land surface having a flat terrain, similar to that of surface water (Montgomery et al. 2018), as well as the imagery being unable to distinguish between water and dry riverbed material. This is the case in the Tankwa River where the surrounding land is relatively flat.
Accuracy assessment of Sentinel-1 and Sentinel-2
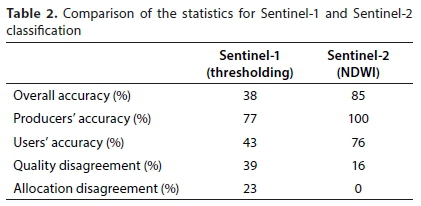
An accuracy assessment was undertaken for the classified images of Sentinel-1 and Sentinel-2, using high-resolution Google Earth Pro imagery and field verification of known water points as reference during January and February of 2016. Table 2 illustrates the overall accuracy (proportionality of correct classification in a map), quantity (difference between the reference map and classified map, due to a less-than-perfect match in the proportions of the classes) and allocation disagreements (difference between the reference map and classified map, due to the less-than-optimal match in the spatial allocation of the classes), as well as the users' (probability that the class on the map will be present on the ground, i.e., reliability) and producers' accuracies (probability that a particular land cover type of an area on the ground is classified correctly) (Pontius and Millones, 2011) for the classified maps of Sentinel-1 and Sentinel-2. The NDWI applied to the Sentinel-2 data had an overall accuracy of 85%. A 100% producers' accuracy, 76% users' accuracy, 16% quality disagreement and no allocation disagreement. The high performance of the NDWI agreed with the results of Masocha et al. (2018); Seaton et al. (2020) and Wang et al. (2018). Sentinel-1 underperformed in distinguishing water from non-water within the study area. Sentinel-1 showed an OA of 38%, producers' accuracy of 77%, users' accuracy of 43%, quality disagreement of 39% and allocation disagreement of 23%. This, again, is due to the similar dB ranges and the relatively flat terrain of the study area. Based on the results in Fig. 6, and the statistics in Table 2, the NDWI applied to Sentinel-2 was the most superior method for mapping surface water along the study area.
Estimated length of the river inundated by water
Sentinel-2 displayed a higher accuracy in distinguishing water from non-water in the study area. Therefore, we used Sentinel-2 and the NDWI to calculate the length of the reach inundated with water along the Tankwa River. Figure 7 illustrates the actual length of the reach for the Tankwa River, against the calculated lengths of the surface water identified for the selected dates. Figure 7a shows the reach with an actual length of 9 244 m (blue), as well as the surrounding floodplain (brown). Figures 7b, c and d show the surface water classified from Sentinel-2 images with the calculated lengths of water inundated in the Tankwa River for February, May and July of 2016, respectively. This was calculated according to the method in Model Builder shown in Fig. 4. The classified water present was seen in similar regions across all three images, indicating the presence of permanent pools.
Figure 8 shows the actual length of the reach in the Tankwa River (dark blue) and the accumulated lengths of water inundating the reach for each date of image capture (light blue). The actual length of the reach for the Tankwa River was 9 244 m. The calculated length of surface water for February was 2 809 m, indicating only 30% of the river was inundated with water. The calculated length for May was 3 202 m, accounting for only 35% of the river inundated with water. The calculated length for July was 2 890 m, indicating only 31% of the river inundated with water. The calculated length of water in the reach only increased slightly in May 2016, but decreased again in July. This indicates that there was no flow throughout the Tankwa River during the times of image capture.

DISCUSSION
Implications of the study to water resources monitoring along N-PRs
In this study, we explored the potential of using two different satellite datasets, namely, the Sentinel-1 SAR, and the Sentinel-2 MSI optical, to map and monitor surface water availability along the Tankwa River, a N-PR. A thresholding technique was selected to identify surface water for the Sentinel-1 data, as it is the most common method (Bioresita et al., 2018; Montgomery et al., 2018), while the NDWI was used for Sentinel-2 data, as it is one of the most widely used water index methods for multispectral datasets (Jiang et al., 2014; Seaton et al., 2020; Zhou et al., 2017). We assessed the accuracy of these approaches along a reach of the Tankwa River, to determine if we could identify the length of the wetted river channel, and to measure if there was connectivity between pools along a N-PR system. Overall, the NDWI performed well in distinguishing water from non-water areas. Sentinel-1 performed poorly as there was no clear separation between the VH and VV, making it difficult to separate water from non-water. The poor performance of Sentinel-1 appeared to mostly be influenced by the effects of the surrounding aridity of the Tankwa Karoo region. Due to the classification methods of SAR data, the ambiguities between water and flat surfaces, such as those found in arid regions, produce similar backscatter values (Prigent et al., 2015). This phenomenon may explain the poor identification achieved using Sentinel-1 to map surface water along the Tankwa River.
Calculating the length of rivers using remote sensing is well documented (Liu et al., 2009); however, calculating the actual length of water occupied in a river has rarely been studied. Thus, using Model Builder, we developed a tool to calculate and measure the length of the river occupied by water, instead of assuming there is water throughout a river through traditional approaches (Haas et al., 2009; Makungo et al., 2010). Our results showed that within a reach of 9 244 m of the Tankwa River, only an estimated third of the river was actually inundated with water. These results accurately depict the characteristics of a N-PR where there is disconnectivity (Rossouw and Watson, 2005), despite the images being captured soon after rainfall events. The calculated lengths of water within the reach were between 2 809 and 3 202 m between February and July of 2016, suggesting no surface water connectivity along the region of study at the times of image capture.
The use of satellite imagery for mapping surface water has the potential to contribute towards water resource management (Fernandez-Prieto and Palazzo, 2007; Sheffield et al., 2018), especially in regions where there is a lack of baseline information, such as the Tankwa River. This study used freely available satellite information to provide a deeper understanding on the dynamics of the Tankwa River, as well as a new spatial approach for monitoring N-PRs using remote sensing. These results may assist in the long-term monitoring and management of localised water use, as well as provide a deeper understanding of the statuses N-PRs and their surrounding ecosystems (Seaton et al., 2020).
Although not addressed in this study, other recent studies have used fusion techniques of Sentinel-1 and Sentinel-2 for surface water mapping in large rivers (Bioresita et al., 2018). Perhaps further studies could test this in the arid regions for smaller N-PRs. With the long-time-running Landsat series, there is great potential of using remote-sensing datasets for long-term N-PR monitoring. By using multiple datasets, more accurate monitoring of N-PR dynamics can be achieved over the short term and long term. This could greatly increase our understanding of water resource availability along N-PRs as well as N-PR dynamics. This could also aid in more frequent and cost-effective monitoring.
There is a need for future scientific research to test the applicability of this approach in other N-PR systems and floodplain-inundated areas across South Africa and beyond. This will help provide further insights on the transferability and applicability in different environments with unique hydrological settings. For instance, it will be interesting to establish how the Sentinel-1 approach performs in cases where floodplain inundation can have a major impact on the attenuation of high flows in the river channel. So far, its performance is well documented in vegetation and landscape characterisation (Rajah et al., 2019), but Sentinel-1 still has limited information on the ability to quantify how much of a floodplain wetland is inundated during different parts of the season. This could be beneficial for understanding channel-floodplain exchange dynamics that is also important for managing river flow without damaging wetland ecology.
CONCLUSION
The inevitable trade-off between the satellites' specifications and the classification technique to use for mapping surface water along N-PRs remains a challenge. In this study, we experimented with a method to compute the availability and length of water within a reach of the Tankwa River, as well as to assess whether and when there is connectivity between pools along N-PRs. The use of Sentinel-2 satellite imagery and the NDWI proved to be suitable to classify surface water along the Tankwa River, as well as measure the length of surface water available in a river. The tested spatially explicit approach was capable of detecting and mapping pools along the river. However, connectivity between pools was not detected. Although there was no continuous water throughout the river, the length of the river occupied with water did change, with the month of May showing more surface water present. Overall, these results imply that the growing technology of GIS and remote-sensing techniques are becoming more useful for mapping and monitoring of surface water availability across various surface water bodies, particularly N-PRs. The tool developed in this study opened up a new approach for river water monitoring and assessing the connectivity between isolated pools that form along these complex river systems, and can therefore be used for obtaining a deeper understanding of N-PRs.
REFERENCES
AVISSE N, TILMANT A, FRANÇOIS MÜLLER M and ZHANG H (2017) Monitoring small reservoirs' storage with satellite remote sensing in inaccessible areas. Hydrol. Earth Syst. Sci. 21 (12) 6445-6459. https://doi.org/10.5194/hess-21-6445-2017 [ Links ]
BIORESITA F, PUISSANT A, STUMPF A and MALET JP (2018) A method for automatic and rapid mapping of water surfaces from Sentinel-1 imagery. Remote Sens. 10 (2). https://doi.org/10.3390/rs10020217 [ Links ]
ESA (2018) Copernicus Open Access Hub. https://scihub.copernicus.eu/ (Accessed 15 June 2018). [ Links ]
ESA (2015) Sentinel-2 User Handbook. 64 pp. URL: https://doi.org/10.13128/REA-22658 [ Links ]
FERNANDEZ-PRIETO D and PALAZZO F (2007) The role of Earth observation in improving water governance in Africa: ESA's TIGER initiative. Hydrogeol. J. 15 (1) 101-104. https://doi.org/10.1007/s10040-006-0118-0 [ Links ]
FEYISA GL, MEILBY H, FENSHOLT R and PROUD SR (2014) Automated Water Extraction Index: A new technique for surface water mapping using Landsat imagery. Remote Sens. Environ. 140 23-35. https://doi.org/10.1016/j.rse.2013.08.029 [ Links ]
FISHER A, FLOOD N and DANAHER T (2016) Comparing Landsat water index methods for automated water classification in eastern Australia. Remote Sens. Environ. 175 167-182. https://doi.org/10.1016/j.rse.2015.12.055 [ Links ]
HAAS EM, BARTHOLOMÉ E and COMBAL B (2009) Time series analysis of optical remote sensing data for the mapping of temporary surface water bodies in sub-Saharan western Africa. J. Hydrol. 370 (1-4) 52-63. https://doi.org/10.1016/j.jhydrol.2009.02.052 [ Links ]
HUGHES DA, DESAI AY, BIRKHEAD AL and LOUW D (2014) A new approach to rapid, desktop-level, environmental flow assessments for rivers in South Africa. Hydrol. Sci. J. 59 (3-4) 673-687. https://doi.org/10.1080/02626667.2013.818220 [ Links ]
JACOBSON PJ, JACOBSON KM and SEELY MK (1995) Ephemeral rivers and their catchments - Sustaining people and development in Western Namibia. Desert Research Foundation of Namibia. 164 pp. [ Links ]
JIANG H, FENG M, ZHU Y, LU N, HUANG J and XIAO T (2014) An automated method for extracting rivers and lakes from Landsat imagery. Remote Sens. 6 (6) 5067-5089. https://doi.org/10.3390/rs6065067 [ Links ]
KAPANGAZIWIRI E, HUGHES DA and WAGENER T (2012) Incorporating uncertainty in hydrological predictions for gauged and ungauged basins in southern Africa. Hydrol. Sci. J. 57 (5) 1000-1019. https://doi.org/10.1080/02626667.2012.690881 [ Links ]
KING J, BROWN C and SABET H (2003) A scenario-based holistic approach to environmental flow assessment for rivers. River Res. Appl. 19 (5-6) 619-639. https://doi.org/10.1002/rra.709 [ Links ]
KING JM, BROWN CA, PAXTON BR and FEBRUARY RJ (2004) Development of DRIFT, a scenario-based methodology for environmental flow assessments (Issue December). WRC Report No. 1159/1/04. Water Research Commission, Pretoria. 159 pp. [ Links ]
LIU S, LU P, LIU D, JIN P and WANG W (2009) Pinpointing the sources and measuring the lengths of the principal rivers of the world. Int. J. Dig. Earth. 2 (1) 80-87. https://doi.org/10.1080/17538940902746082 [ Links ]
MAKUNGO R, ODIYO JO, NDIRITU JG and MWAKA B (2010) Rainfall-runoff modelling approach for ungauged catchments: A case study of Nzhelele River sub-quaternary catchment. Phys. Chem. Earth. 35 (13-14) 596-607. https://doi.org/10.1016/j.pce.2010.08.001 [ Links ]
MASOCHA M, DUBE T, MAKORE M, SHEKEDE MD and FUNANI J (2018) Surface water bodies mapping in Zimbabwe using landsat 8 OLI multispectral imagery: A comparison of multiple water indices. Phys. Chem. Earth. 106 63-67. https://doi.org/10.1016/j.pce.2018.05.005 [ Links ]
MCFEETERS SK (2013) Using the normalized difference water index (NDWI) within a geographic information system to detect swimming pools for mosquito abatement: A practical approach. Remote Sens. 5 (7) 3544-3561. https://doi.org/10.3390/rs5073544 [ Links ]
MONTGOMERY JS, HOPKINSON C, BRISCO B, PATTERSON S and ROOD SB (2018) Wetland hydroperiod classification in the western prairies using multitemporal synthetic aperture radar. Hydrolog. Process. 32 (10) 1476-1490. https://doi.org/10.1002/hyp.11506 [ Links ]
NGUYEN TL and BUI DT (2001) Flood monitoring of Mekong river delta,Vietnam using ERS Sar data. 22nd Asian Conference on Remote Sensing, 5-9 November 2001, Singapore. [ Links ]
OMUTE P, CORNER R and AWANGE JL (2012) The use of NDVI and its derivatives for monitoring lake victoria's water level and drought conditions. Water Resour. Manage. 26 (6) 1591-1613. https://doi.org/10.1007/s11269-011-9974-z [ Links ]
PHAM-DUC B, PRIGENT C and AIRES F (2017) Surface water monitoring within cambodia and the Vietnamese Mekong Delta over a year, with Sentinel-1 SAR observations. Water. 9 (6) 1-21. https://doi.org/10.3390/w9060366 [ Links ]
PIERDICCA N, PULVIRENTI L, CHINI M, GUERRIERO L and CANDELA L (2013) Observing floods from space: Experience gained from COSMO-SkyMed observations. Acta Astronaut. 84 122-133. https://doi.org/10.1016/j.actaastro.2012.10.034 [ Links ]
POFF NL, ALLAN JD, BAIN MB, KARR JR, PRESTEGAARD KL, RICHTER BD, SPARKS RE and STROMBERG JC (1997) The natural flow regime: A paradigm for river conservation and restoration. BioScience. 47 (11) 769-784. https://doi.org/10.2307/1313099 [ Links ]
PONTIUS RG and MILLONES M (2011) Death to Kappa: Birth of quantity disagreement and allocation disagreement for accuracy assessment. Int. J. Remote Sens. 32 (15) 4407-4429. https://doi.org/10.1080/01431161.2011.552923 [ Links ]
PRIGENT C, AIRES F, JIMENEZ C, PAPA F and ROGER J (2015) Multiangle backscattering observations of continental surfaces in Ku-band (13 GHz) from satellites: Understanding the signals, particularly in arid regions. IEEE Trans. Geosci. Remote Sens. 53 (3) 1364-1373. https://doi.org/10.1109/TGRS.2014.2338913 [ Links ]
RAJAH P, ODINDI J, MUTANGA O and KIALA Z (2019) The utility of Sentinel-2 Vegetation Indices (VIs) and Sentinel-1 Synthetic Aperture Radar (SAR) for invasive alien species detection and mapping. Nat. Conserv. 35 41-61. https://doi.org/10.3897/natureconservation.35.29588 [ Links ]
RHAZI L, GRILLAS P, SABER ER, RHAZI M, BRENDONCK L and WATERKEYN A (2011) Vegetation of Mediterranean temporary pools: A fading jewel? Hydrobiologia. 689 (1) 23-36. https://doi.org/10.1007/s10750-011-0679-3 [ Links ]
ROKNI K, AHMAD A, SELAMAT A and HAZINI S (2014) Water feature extraction and change detection using multitemporal landsat imagery. Remote Sens. 6 (5) 4173-4189. https://doi.org/10.3390/rs6054173 [ Links ]
ROSSOUW L, AVENANT MF, SEAMAN MT, KING JM, BARKER CH, DU PREEZ PJ, PELSER AJ, ROOS JC, VAN STADEN JJ, VAN TONDER GJ and WATSON M (2005) Environmental water requirements in non-perennial systems. WRC Report No. 1414/1/05. Water Research Commission, Pretoria. 318 pp. [ Links ]
ROSSOUW L (2011) Determining the water quality ecological reserve for non-perennial rivers a prototype environmental water assessment methodology. PhD thesis, University of the Free State. [ Links ]
SARP G and OZCELIK M (2017) Water body extraction and change detection using time series: A case study of Lake Burdur, Turkey. J. Taibah Univ. Sci. 11 (3) 381-391. https://doi.org/10.1016/j.jtusci.2016.04.005 [ Links ]
SAWUNYAMA T, SENZANJE A and MHIZHA A (2006) Estimation of small reservoir storage capacities in Limpopo River Basin using geographical information systems (GIS) and remotely sensed surface areas: Case of Mzingwane catchment. Phys. Chem. Earth. 31 (15-16) 935-943. https://doi.org/10.1016/j.pce.2006.08.008 [ Links ]
SEAMAN M, WATSON M, AVENANT M, JOUBERT A, KING J, BARKER C, ESTERHUYSE S, GRAHAM D, KEMP M, LE ROUX P, PRUCHA B, REDELINGHUYS N, ROSSOUW L, ROWNTREE K, SOKOLIC F, VAN RENSBURG L, VAN DER WAAL B, VAN TOL J and VOS T (2016) DRIFT-ARID: Application of a method for environmental water requirements (EWRs) in a non-perennial river (Mokolo River) in South Africa. Water SA. 42 (3) 368-383. https://doi.org/10.4314/wsa.v42i3.02 [ Links ]
SEATON D, DUBE T and MAZVIMAVI D (2020) Use of multi-temporal satellite data for monitoring pool surface areas occurring in non-perennial rivers in semi-arid environments of the Western Cape, South Africa. ISPRS J. Photogram. Remote Sens. 167 375-384. https://doi.org/10.1016/j.isprsjprs.2020.07.018 [ Links ]
SHEFFIELD J, WOOD EF, PAN M, BECK H, COCCIA G, SERRAT-CAPDEVILA A and VERBIST K (2018) Satellite remote sensing for water resources management: potential for supporting sustainable development in data-poor regions. Water Resour. Res. 54 (12) 9724-9758. https://doi.org/10.1029/2017WR022437 [ Links ]
SISAY A (2016) Remote sensing based water surface extraction and change detection in the central Rift Valley region of Ethiopia. Am. J. Geogr. Inf. Syst. 5 (2) 33-39. https://doi.org/10.5923/j.ajgis.20160502.01 [ Links ]
SMAKHTIN V, REVENGA C and DÖLL P (2004) A pilot global assessment of environmental water requirements and scarcity. Water Int. 29 (3) 307-317. https://doi.org/10.1080/02508060408691785 [ Links ]
SOLANDER C, REAGER J and FAMIGLIETTI J (2016) How well will the SurfaceWater and Ocean Topography (SWOT) mission observe global reservoirs? Water Resour. Res. 52 2123-2140. https://doi.org/10.1002/2016WR019804 [ Links ]
SOTI V, TRAN A, BAILLY JS, PUECH C, SEEN DL and BÉGUÉ A (2009) Assessing optical earth observation systems for mapping and monitoring temporary ponds in arid areas. Int. J. Appl. Earth Obs. Geoinf. 11 (5) 344-351. https://doi.org/10.1016/j.jag.2009.05.005 [ Links ]
STRAUSS C, DE KOCK G, SONGELWA N, MABUNDA D and DLAMIN KD (2014) Tankwa Karoo National Park, draft management plan for stakeholder comment for the period 2014-2024, SANParks, Pretoria. 107 pp. [ Links ]
USEPA (United States Environmental Protection Agency) (2015) Connectivity of streams and wetlands to downstream waters: a review and synthesis of the scientific evidence (Final Report). EPA/600/R-14/475F, 2015. USEPA, Washington, DC. [ Links ]
VAN DER MERWE H, BEZUIDENHOUT H and BRADSHAW PL (2015) Landscape unit concept enabling management of a large conservation area: A case study of Tankwa Karoo National Park, South Africa. S. Afr. J. Bot. 99 44-53. https://doi.org/10.1016/j.sajb.2015.03.187 [ Links ]
WANG X, XIE S, ZHANG X, CHEN C, GUO H, DU J and DUAN Z (2018) A robust Multi-Band Water Index (MBWI) for automated extraction of surface water from Landsat 8 OLI imagery. International J. Appl. Earth Obs. Geoinf. 68 73-91. https://doi.org/10.1016/j.jag.2018.01.018 [ Links ]
WANG Y (2004) Seasonal change in the extent of inundation on floodplains detected by JERS-1 Synthetic Aperture Radar data. Int. J. Remote Sens. 25 (13) 2497-2508. https://doi.org/10.1080/01431160310001619562 [ Links ]
WRC (Water Research Commission) (2019) Water Resources of South Africa, 2012 study (WR2012). URL: https://waterresourceswr2012.co.za/ (Accessed 3 August 2019). [ Links ]
ZHOU Y, DONG J, XIAO X, XIAO T, YANG Z, ZHAO G, ZOU Z and QIN Y (2017) Open surface water mapping algorithms: A comparison of water-related spectral indices and sensors. Water. 9 (4). https://doi.org/10.3390/w9040256 [ Links ]
 Correspondence:
Dylan Seaton
EMAIL 3346279@myuwc.ac.za
Received: 19 January 2021
Accepted: 3 July 2021

