


Services on Demand
Article
 English (pdf)
 Article in xml format
 Article references
Indicators

Related links
-
 Cited by Google
 -
 Similars in Google
Share

 Permalink
Water SA
On-line version ISSN 1816-7950
Print version ISSN 0378-4738
Water SA vol.47 n.3 Pretoria Jul. 2021
http://dx.doi.org/10.17159/wsa/2021.v47.i3.11861
RESEARCH PAPER
Chemical composition of rain at a regional site on the South African Highveld
L KokI; PG van ZylI; JP BeukesI; J-S SwartzI; RP BurgerI; Suria EllisII; M JosipovicI; V VakkariI, III; L LaaksoI, III; M KulmalaIV
IChemical Resource Beneficiation, North-West University, Potchefstroom, South Africa
IISchool of Mathematical and Statistical Science, North-West University, Potchefstroom, South Africa
IIIFinnish Meteorological Institute, Helsinki, Finland
IVDepartment of Physics, University of Helsinki, Helsinki, Finland
ABSTRACT
Relatively limited data have been published on the chemical composition of wet deposition for South Africa, which is considered an important source region for atmospheric pollutants. Concentrations and wet deposition fluxes of ionic species determined in rain samples collected from December 2014 to April 2018 at a regional site, Welgegund, are presented, and contextualised by wet deposition composition in the north-eastern interior of South Africa. 89% of rain samples collected during the sampling period complied with the data quality objectives of the World Meteorological Organisation. The total ionic concentration of rainwater at Welgegund was similar to that at two regional sites located within proximity of industrial activities. The pH of rainwater (4.80) was comparable to that determined at two rural background sites, which indicated increased neutralisation. Similarly to the other sites located in the South African interior, SO42- was the most abundant species in rain, with concentrations thereof in the same order as SO42- levels determined at the two industrially influenced sites. Lower sulphur and nitrogen fluxes at Welgegund were attributed to lower average annual rainfall. The anthropogenic (industrial) source group had the largest contribution to wet deposition chemical composition, which signified the influence of major source regions in the South African interior that impact Welgegund. Relatively large contributions were also calculated from marine and crustal sources. The influence of agricultural activities was also evident, while biomass burning had the lowest contribution due to open biomass burning occurring mainly during the dry season
Keywords: precipitation; wet deposition; atmospheric fluxes; inorganic ions; Welgegund
INTRODUCTION
Atmospheric deposition is important in removing species from the atmosphere, which contributes to the earth-atmosphere biogeochemical balance (Galy-Lacaux et al., 2009; Laouali et al., 2012; Akpo et al., 2015). Deposition of chemical species from the atmosphere can either introduce nutrients (e.g. N-species) or toxic components (e.g. mineral acids) into terrestrial and aquatic ecosystems (Galy-Lacaux et al., 2009; Akpo et al., 2015). Wet deposition of atmospheric species occurs mainly through precipitation events. The chemical composition of precipitation is controlled by various ecosystem-specific and complex factors, which include emission source strengths, atmospheric transport and chemical reactivity (Akpo et al., 2015). Long-range transport of aerosols, for example, can affect rainwater composition in a region distant from the original emissions, while ecosystem characteristics, such as being in proximity to an ocean, will also affect the ionic content of precipitation (Galy-Lacaux et al., 2009). A recent comprehensive assessment of atmospheric deposition of biogeochemically important compounds and precipitation chemistry placed new emphasis on the importance of deposition measurements (Vet et al., 2014), which have also been identified by the National Academies of Sciences, Engineering and Medicine in the United States as key priorities for future atmospheric chemistry research (National Academies of Sciences and Medicine, 2016).
Certain atmospheric pollutants in precipitation contribute to the acidification of rainwater. The main cause of acid rain is the emission of sulphur (S) and nitrogen (N) compounds such as SOx and NOx into the atmosphere. Globally, sulphuric acid is considered the most important acidifying species (Rodhe et al., 2002), while the influence of nitric acid on rainwater acidity has also increased in recent years (Xiao, 2016). Acid rain contributes to the acidification of surface water bodies, soil and vegetation (Bravo et al., 2000), which could lead to leaching of essential nutrients and the mobilisation of heavy metals into soil (Schindler, 1988). Basic atmospheric species such as calcium (Ca), magnesium (Mg) and ammonium are, however, capable of neutralising acidic precipitation or even favouring alkaline rainwater composition (Galy-Lacaux et al., 2009).
South Africa is the largest industrialised economy in Africa and is an important source region of atmospheric pollutants. South Africa is regarded as the 9th-largest S-emitting country (Stern, 2006), while satellite images reveal a nitrogen dioxide (NO2) hotspot over the Mpumalanga Highveld, mainly attributed to coal-fired power stations located in this region (Lourens et al., 2012). Recent satellite images retrieved from TROPOMI on the European Space Agency's Sentinel 5P satellite again highlighted the extent of pollution in this region (Meth, 2018). Southern Africa is also characterised by the occurrence of widespread open biomass burning, which is an important source of atmospheric pollutants in this region (Chiloane et al., 2017).
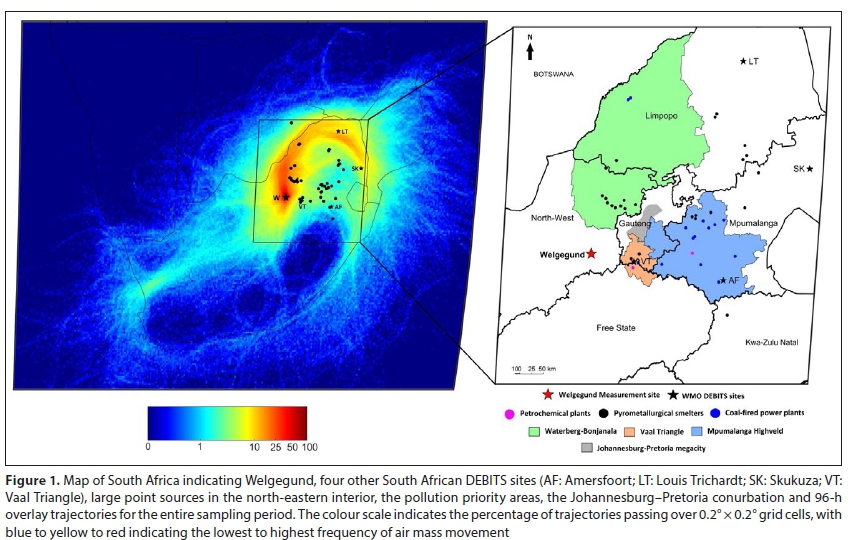
Very limited data have been published on the chemical composition of wet deposition for South Africa. A recent study by Conradie et al. (2016) reported on the chemical composition of rainwater collected from 2009 to 2014 at four regional sites considered to be representative of the north-eastern interior of South Africa. Two of these sites were within proximity of industrial activities (Amersfoort and Vaal Triangle) and two were rural sites (Louis Trichardt and Skukuza) (Fig. 1). Measurements at these sites were conducted within the framework of the long-term monitoring of biogeochemical species in the subtropics network established through the Deposition of Biogeochemically Important Trace Species (DEBITS) task endorsed by the International Global Atmospheric Chemistry (IGAC) programme of the Global Atmosphere Watch (GAW) network of the World Meteorological Organisation (WMO) (Lacaux et al., 2003). Conradie et al. (2016) also compared rainwater composition and wet deposition fluxes to a previous study conducted by Mphepya et al. (2004, 2006) at three of these South African DEBITS sites, which indicated an increase in S- and N-wet deposition fluxes from 1986 to 2014, as well as more rain events with lower pH. Rainwater collection was discontinued at these four South African DEBITS sites in 2015 due to financial constraints. However, in 2014, Welgegund - a comprehensively equipped regional atmospheric measurement station impacted by the major source regions in the South African interior - was included in the DEBITS network under the renamed African component of the DEBITS task, i.e., the International Network to study Deposition and Atmospheric chemistry in Africa (INDAAF) network. Therefore, the main aims of this study were to determine the chemical composition of rainwater, as well as S- and N-wet deposition fluxes at Welgegund, while also relating wet deposition chemistry at Welgegund to the other South African DEBITS sites. In addition, the major sources of ionic species in rain at Welgegund were also assessed.
SAMPLING SITE
Rainwater sampling was conducted from December 2014 to April 2018 at the Welgegund atmospheric measurement station (26°34'10"S, 26°56'21"E; 1 480 m amsl) for which detailed site descriptions have been reported in a number of studies, e.g., Jaars et al. (2014), Jaars et al. (2016), and Räsänen et al. (2017). Welgegund is a regional site located on the Highveld on a privately owned farm approximately 25 km north-west of Potchefstroom and 100 km west of the Johannesburg-Pretoria megacity, as indicated in Fig. 1. The site is located in a grazed savannah-grassland agricultural landscape (Jaars et al., 2016), while being surrounded by heterogeneous soil types derived from the Ventersdorp Supergroup geological structures in the area (Cairncross, 2004) that are rich in calcium, magnesium and carbonate minerals (Cairncross, 2004; Jaars et al., 2016).
Figure 1 also indicates overlaid back trajectories representing the predominant air mass movement prior to arrival at Welgegund during the sampling period. Back trajectories were calculated using the National Oceanic and Atmospheric Administration (NOAA) Air Resource Laboratory's (ARL) Hybrid Single-Particle Lagrangian Integrated Trajectory (HYSPLIT) model (version 4.8) (Stein et al., 2015), while meteorological data were retrieved from the Global Data Assimilation System (GDAS) archive of the US National Weather Service's National Centre for Environmental Prediction (NCEP). Hourly arriving 96-hour back trajectories at an arrival height of 100 m above ground level were calculated and overlaid on a map using fit-for-purpose programmable software. A colour scale indicates the number of back trajectories passing over a grid cell, with dark red indicating the highest percentage of back trajectory overpasses. The dominant anticyclonic recirculation of air masses in the South African interior (Tyson et al., 1996) is evident from the overlaid back trajectories presented. Figure 1 also indicates the major pollution point sources, which clearly show the impact of major source regions in the South African interior on air masses measured at Welgegund. These source regions are located in areas declared pollution hotspots by the South African Government, i.e. the Vaal Triangle Airshed (RSA, 2009), the Mpumalanga Highveld (RSA, 2007) and the Waterberg-Bojanala (RSA, 2015) Priority Areas. Main industries in the Vaal Triangle Priority Area include a large petrochemical smelter and pyrometallurgical smelters, while, as mentioned previously, a large number of coal-fired power stations are located in the Mpumalanga Highveld Priority Area. The industrialised Bushveld Complex, which houses several large pyrometallurgical smelters is located in the Waterberg-Bojanala Priority Area (Hirsikko et al., 2012; Venter et al., 2012), while two large coal-fired power stations are also located in this region (Pretorius et al., 2015). In addition to these priority areas, Welgegund is also influenced by air masses passing over the Johannesburg-Pretoria conurbation (Lourens et al., 2012), while the impact of air masses passing over a relatively clean sector north to south-west of the site is also evident.
The weather of the South African Highveld is controlled by seasonal shifts of a high-pressure system, which is pronounced over the Highveld during winter (June, July, August) and causes low-level inversions that reduce vertical mixing and trap pollutants near the surface (Tyson et al., 1996; Laakso et al., 2012). During summer (December, January, February), the high-pressure system shifts southwards, allowing tropical easterly flow to be prevalent, causing increased dispersion of pollutants. The South African Highveld is characterised by distinct wet and dry seasons with the wet season coinciding with the warmer months from October to April. Rainfall during the wet season mainly comprises convective precipitation (Harrison, 1986). In Fig. 2, the monthly rainfall depths measured during the entire sampling period are presented, with the total annual rainfall depths also indicated. Rain depths were measured with a graduated funnel-shaped rain gauge that limits evaporation. The percentage of rain event depths measured with the rain gauge during the sampling period, i.e., the percentage precipitation covering length (%PCL) (WMO, 2004), is 100%. The distinct seasonal pattern of precipitation is evident from Fig. 2, while inter-annual fluctuations in rainfall depth are also apparent. Figure 2 also indicates significantly lower rain depths measured during the wet season from October 2015 to May 2016, with a total rain depth of 261 mm measured, which corresponds to a period of severe drought in this region (Simpson and Dyson, 2018). In addition, an uncharacteristically high rain depth value was measured during July 2016, which corresponded with a low-pressure system over the south-eastern coast of South Africa that typically causes rainfall in the South African interior (Tyson and Preston-Whyte, 2017).
MATERIALS AND METHODS
Rainwater sampling
Similar to Mphepya et al. (2004, 2006) and Conradie et al. (2016), rain sample collection at Welgegund adhered to field protocols of the WMO for precipitation chemistry measurements (WMO, 2004). A custom-made automated wet-only rain sampler, based on the Aerochem Metrics model 301 precipitation sampler, was used to collect rain samples on an event basis in a collection vessel comprising a plastic bag fitted into a high-density polyethylene (HDPE) bucket. The sampler uses a light-refracting sensor switch, which activates a mechanism to open the lid of the collection vessel with the onset of rainfall and closes the lid after the rain event. In this manner, contamination of precipitation events is limited, while disadvantages associated with manual operation are minimised. Contamination was also limited by changing plastic bags in the collection bucket once a week during dry periods, while the lid of the bucket also sealed tightly. Rain samples collected in plastic bags were removed from the collection vessel by an on-site operator as soon as possible after a rain event (within 24 h hours after the event), after which the samples were transferred to 50 mL HDPE bottles that were frozen immediately up until they were analysed.
Analytical methods and data quality
Chemical analysis, quality control and quality assurance procedures similar to that described by Conradie et al. (2016) were followed, which are briefly summarised below. After the samples had been defrosted overnight, the pH and conductivity of 25 mL aliquots were immediately measured (HI 255 combined meter, Hanna Instruments), after which filtered (EconoClear 0.45 µm filter) samples were analysed with a Dionex ICS 3000 suppressed ion chromatograph system. The species measured included nitrate (NO3-), sulphate (SO42-), chloride (Cl-), fluoride (F-), ammonium (NH4+), calcium (Ca2+), potassium (K+), magnesium (Mg2+) and sodium (Na+), as well as water-soluble organic acids (OAs), i.e., acetic- (CH3COO-), formic- (HCOO-), oxalic- (C2O42-) and propionic acid (C3H5O2-). Detailed descriptions of the column set-up, separation modes, calibration procedures and detection limits of instrumentation are presented by Conradie et al. (2016).
Data quality was ensured by complying with the WMO Data Quality Objectives (DQOs) for precipitation chemistry (WMO, 2004). Visible contaminants were removed from the samples by filtration (0.2 mm filter, Sigma-Aldrich). Ionic balances were also considered by calculating the ion difference percentage (ID%) as follows:

with AE and CE representing the total concentrations (μeq∙L-1) of anions and cations, respectively. Acceptance ranges indicated by the WMO were applied and only samples that passed WMO criteria were considered. In addition, all analytical techniques (IC, pH and conductivity) were also verified through participation in the bi-annual inter-laboratory comparison study (LIS) managed by the WMO (QA/SAC-Americas, 2018).
Calculations
Conradie et al. (2016) used a combination of empirical calculations and statistical evaluations to estimate source contributions of ionic species in wet deposition, which was also performed in this study. A brief summary of these calculations is presented below.
The annual volume weighted mean (VWM) concentration (µeq∙L-1) and annual mean wet deposition fluxes (kg∙ha-1∙year-1) were calculated with the following equations, respectively (Laouali et al., 2012)

where ci represents the concentration of a specific ion in the ith rain sample and pi the rainfall depth of the ith sample, while n indicates the total number of samples complying with the WMO criteria. The average annual wet deposition fluxes for the sampling period were calculated from the mean annual rainfall from 2015 to 2017, while the total annual rainfall included all rain events during a year and not only rain events passing the WMO data quality criteria (WMO, 2004).
The sea salt and non-sea salt fractions of K+, Mg2+, Ca2+, Cl- and SO42- were calculated as follows (Keene et al., 1986):

where SSFx is the sea salt fraction of ion X, [Na+]rain is the Na+ concentration in rain, [X/Na+]seawater the seawater concentration reference ratio of ion X to Na+ presented by Keene et al. (1986), nSSFx the non-sea salt fraction of ion X, and [X]rain the concentration of ion X in the rain sample. In these calculations, it is assumed that all Na+ in rain is of marine origin. Enrichment factors of these ions (EFx) with regard to [X/Na+]seawater were calculated as follows (Quiterio et al., 2004):

where [X/Na+]rainwater is the ratio of ion X in relation to Na+ in rain.
Conradie et al. (2016) used two methods to estimate the anthropogenic contribution to SO42- in precipitation, which is important within the South African context. The first method assumes that SO42- concentrations in excess of that supplied by gypsum is of anthropogenic origin (Delmas, 1981), i.e.:

where [SO42-]nss and [Ca+]nss are the calculated non-sea salt concentrations of SO42- and Ca+ (Eq. 5). The second method uses an estimate of 7.0 µeq∙L-1 for background SO42- concentrations, which is subtracted from the [SO42-]nss. This background SO42- level was indicated by studies in West Africa (Galy-Lacaux et al., 2009) and agrees with global models.
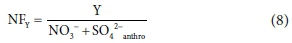
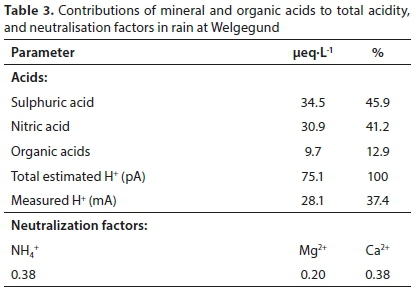
Acidic potential (pA) was calculated by summation of anthropogenic SO42-, NO3- and OA concentrations, while neutralisation factors (NFy) for sulphuric and nitric acids with regard to base cations Mg2+, Ca2+ and NH4+ (Y) were calculated as follows (Laouali et al., 2012):
Statistical evaluation included principal component analysis (PCA) and Spearman correlations to indicate similar sources of chemical species.
RESULTS AND DISCUSSION
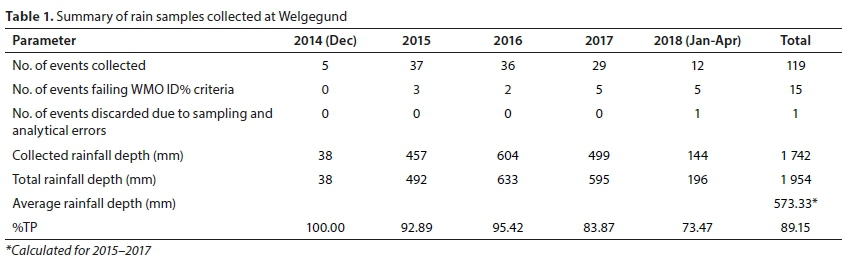
In Table 1, the total number of rain events collected and chemically analysed are presented. Also indicated are the numbers of samples passing the WMO ID% criteria, as well as samples discarded due to analytical and sampling errors (e.g. contamination), or not being of sufficient volume (<2 mm) for analysis. All wet deposition samples collected represent a single rain event. The percentage of the samples that passed the WMO ID% criteria and not discarded, i.e., 89.3%, were in the WMO percentage total precipitation (%TP) acceptance range (%TP ≥ 70%) and can be considered a very good representation of wet deposition (WMO, 2004). The %TP is the percentage of the total measured rainfall depth considered valid precipitation chemistry data.
Ionic composition, wet deposition fluxes and acidity
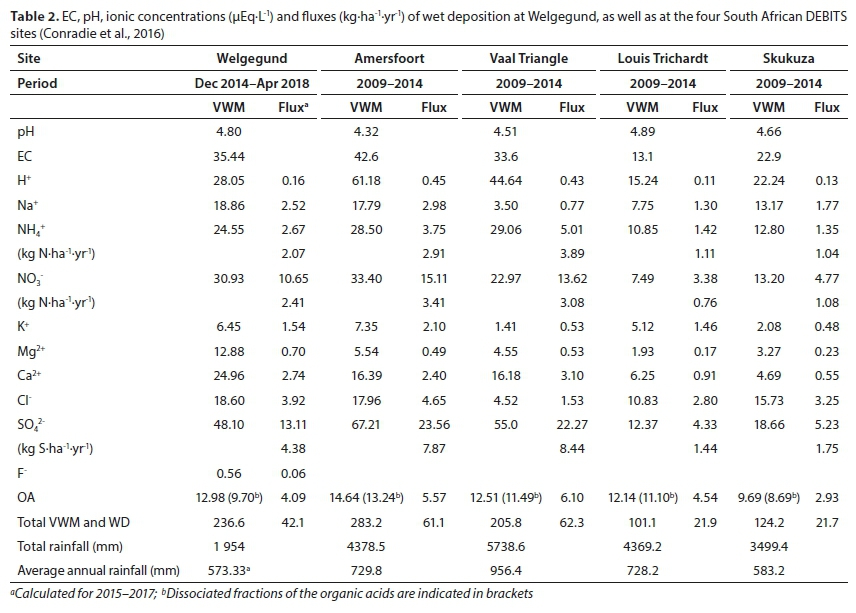
In Table 2, the VWM ionic concentrations and wet deposition flux values, together with the average pH and mean electrical conductivity (EC) measured at Welgegund, are listed for the entire sampling period. Similar to Conradie et al. (2016), the concentrations of the water-soluble OAs (CH3COO-, HCOO-, C2O42- and C3H5O2-) were combined and presented as a total. Also indicated in Table 2 are the VWM concentrations and wet deposition fluxes of rain samples collected at the four South African DEBITS sites from 2009 to 2014 in order to contextualise the ionic composition of wet deposition at Welgegund within this region. Amersfoort is located 50 to 100 km south-east of the major industrial activities on the Mpumalanga Highveld, while the Vaal Triangle is a highly industrialised and densely populated region. Louis Trichardt is a rural site surrounded by agricultural activities, while Skukuza is located within the Kruger National Park (Conradie et al., 2016; Mphepya et al., 2004, 2006).
It is evident from Table 2 that SO42- had the highest VWM concentration at Welgegund. SO42- was also the most abundant ionic species at the four other South African DEBITS sites (Conradie et al., 2016). The chemical composition of rain at Welgegund signifies the large influence of S emissions, which are mainly associated with industrial activities in South Africa, on atmospheric processes on a regional scale. VWM SO42- concentrations at Welgegund were three to four times higher compared to those of the two rural background sites (Louis Trichardt and Skukuza), but slightly lower than those recorded at Vaal Triangle and Amersfoort located within proximity of industrial sources (Fig. 1). As indicated for Amersfoort and Vaal Triangle by Conradie et al. (2016), VWM SO42- concentrations at Welgegund were also much higher than VWM SO42- levels at other African DEBITS sites (Galy-Lacaux et al., 2009) and most other regions in the world, with the exception of eastern North America, eastern Europe and East Asia (Vet et al., 2014).
NO3- was the second-most abundant species at Welgegund, while Ca2+ and NH4+ were the third and fourth most abundant species, respectively. NO3- and NH4+ were the second and third most abundant species, respectively, at Amersfoort and Vaal Triangle with levels of these species at Welgegund also being two to three times higher compared to levels thereof at the two rural background sites, signifying the influence of anthropogenic source regions (Fig. 1) at Welgegund. However, the smaller difference in concentrations of the N species compared to that of SO42- indicates the influence of other sources than industry, most likely regional biomass burning and agricultural activities. In addition, a modelling study conducted by Bruwer and Kornelius (2017) indicated a relatively higher than expected contribution of biogenic NOx emissions to total NOx emissions in the South African Highveld. Ca2+ levels at Welgegund were higher compared to the other South African DEBITS sites, which can most likely be attributed to the influence of wind-blown dust from the relatively clean sector (Fig. 1) (Venter et al., 2018).
A study on the size-resolved characteristics of ionic species in particulate matter (PM) collected at Welgegund by Venter et al. (2018) also indicated that SO42- dominated aerosol chemical com-position, while NH4+ and NO3- were the second- and third-most abundant species, respectively. In addition, ACSM measurements of submicron aerosols at Welgegund also revealed higher contributions of SO42- and NH4+ to the chemical composition of PM1 (Tiitta et al., 2013). Therefore, the ionic composition of rainwater at Welgegund corresponds to the chemical composition of aerosols measured at that site. Venter et al. (2018) and Tiitta et al. (2013) attributed the chemical composition of aerosols to the influence of SO2 and NO2 emissions in source regions on air masses measured at Welgegund, as well as the impacts of regional household combustion and open biomass burning.
The wet deposition fluxes of the ionic species determined at Welgegund correspond to the relative VWM concentrations of these species in rain, with species with higher VWM concentrations having higher fluxes (Table 2). The total wet deposition fluxes of N and S at Welgegund were 4.48 kg N∙ha-1∙y-1 and 4.38 kg S∙ha-1∙y-1, respectively. These wet deposition fluxes of N and S were lower than total N and S wet deposition determined at Amersfoort and Vaal Triangle, while being approximately two times higher than wet deposition fluxes of these species determined at Louis Trichardt and Skukuza. The lower N and S deposition at Welgegund, compared to the two industrially influenced sites with similar levels of SO42-, NO3- and NH4+, can be attributed to lower average annual rainfall at Welgegund during the respective sampling periods.
It is also evident from Table 2 that the total VWM ionic concentration at Welgegund was in the same order as the total VWM ionic levels at Amersfoort and Vaal Triangle, while being approximately two times higher than total ionic concentrations at Louis Trichardt and Skukuza. The total wet deposition flux at Welgegund was lower than the total wet deposition fluxes at the two industrially influenced sites, which can be attributed to lower average annual rainfall at Welgegund during the measurement period, as mentioned above. However, the total wet deposition flux at Welgegund was approximately two times higher than the total wet deposition fluxes at the two rural sites. Ionic concentrations can be considered a better indication of differences in atmospheric chemical composition between these sites, since wet deposition fluxes also depend on the rainfall amount (Conradie et al., 2016).
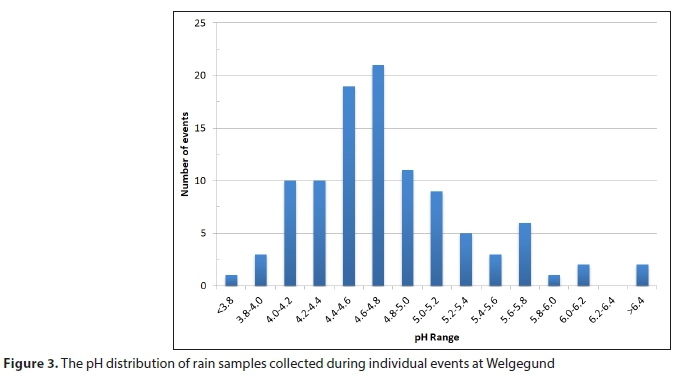
The average pH value (4.80) of rain at Welgegund was similar to the mean pH values of rain at Louis Trichardt and Skukuza, which were higher than the average pH values measured at Amersfoort and Louis Trichardt. Therefore, although VWM concentrations of species associated with acidity in rainwater, i.e., SO42- and NO3-, were similar at Welgegund to levels thereof at the industrially influenced sites, pH levels were comparable to pH values determined at the rural background sites, which suggests increased neutralisation in rainwater collected at Welgegund. The average pH at Welgegund was, however, lower than the natural pH of unpolluted rain in equilibrium with carbon dioxide (5.60), while also being lower than global pH averages (Vet et al., 2014) and pH levels in western African countries (Laouali et al., 2012). In Fig. 3, the pH frequency distribution at Welgegund is presented. 89% of rain samples collected at Welgegund had pH values below 5.60, which corresponds to 94% of all rain events measured at the other South African DEBITS sites, which have pH values lower than 5.60 (Conradie et al., 2016). The largest number of rain events at Welgegund had pH values ranging between 4.0 and 5.0 (69%), with a high frequency of rain events having pH values between 4.4 and 4.8. The pH distribution of rain at Welgegund can be compared to the pH distributions at Louis Trichardt and Skukuza, where pH values predominantly ranged between 4.4 and 5.0, with fewer than 4% of rain events having pH < 4.00.
In Table 3, the acidity potential (pA) at Welgegund is presented. The potential contribution of mineral acids to free acidity at Welgegund is calculated to be 87%, which is similar to those calculated at Amersfoort and Vaal Triangle (Conradie et al., 2016). However, it is evident that the measured H+ concentration is considerably lower than the estimated acidity at Welgegund, which signifies neutralisation of acidic species. The calculated NFs (Eq. 8) for sulphuric and nitric acids by the base cation species NH4+, Mg2+ and Ca2+, also presented in Table 3, show that acidic species at Welgegund are mainly neutralised by Ca2+ and NH4+. Comparison to NFs calculated for the other South African DEBITS sites, where NH4+ was the major neutralising agent in rain, indicates a more significant contribution of Ca2+ to the neutralisation of acidic species in rain at Welgegund.
Sources of ionic species
Statistical analysis
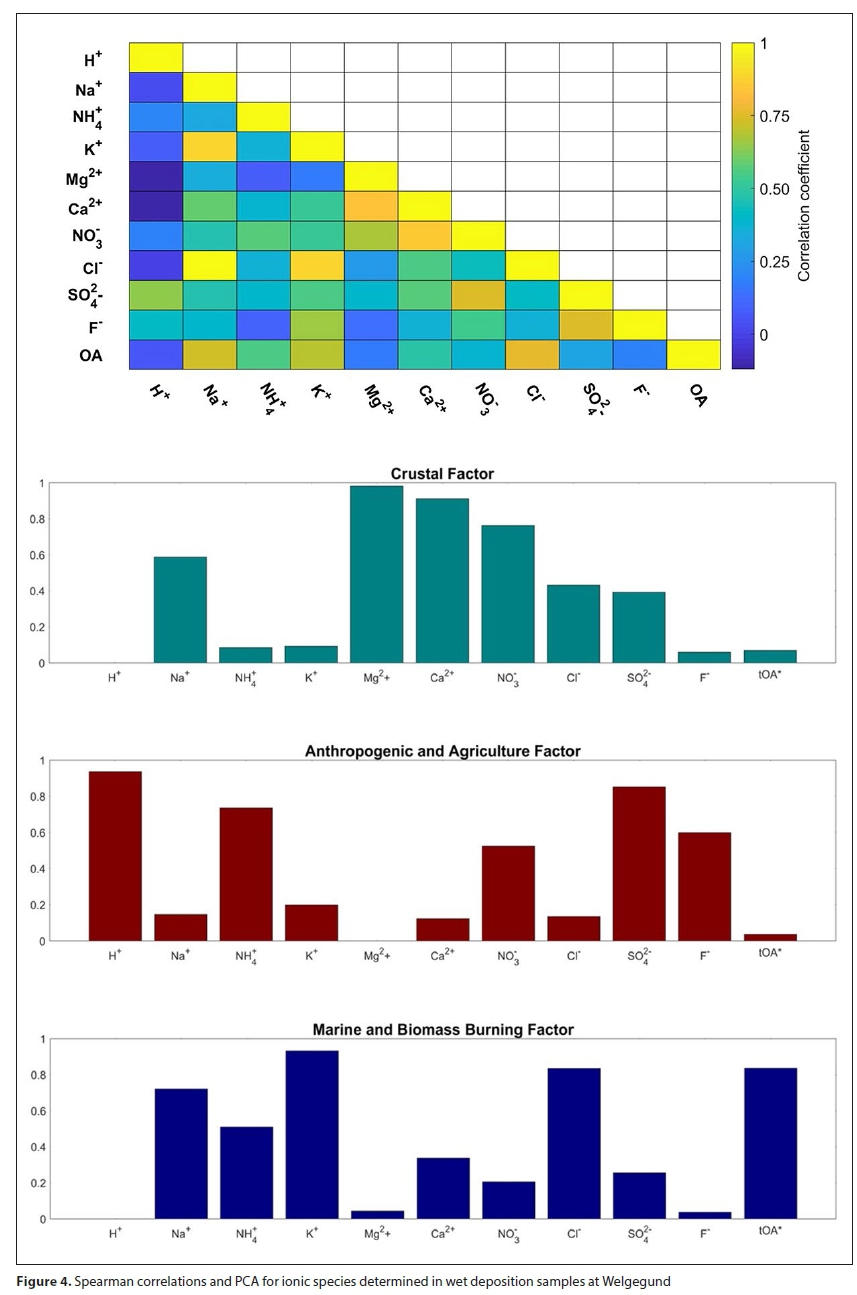
Statistical analysis can assist in determining linkages between sources and the ionic composition of rainwater as indicated by Conradie et al. (2016). Therefore, PCA and Spearman correlation calculations were applied as an explorative tool on the Welgegund precipitation dataset, which are presented in Fig. 4. In PCA, varimax rotation was applied to the Box-Cox transformed dataset in order to eliminate possible artefacts, while factors with eigenvalues larger than 1 were considered significant (Hosiokangas et al., 1999). Three meaningful factors were identified that explained 84% of the variability in the dataset.
The three factors identified with PCA corresponded to similar source groups of ionic species in rain samples collected at the four other South African DEBITS sites, i.e., marine, crustal, anthropogenic, agriculture and biomass burning (Conradie et al., 2016), which is also supported by Spearman correlations. The first PCA factor had high loadings of ionic species corresponding to crustal sources (Ca2+, Mg2+), which is also reflected by Spearman correlations of these species. This factor also had a high contribution from NO3-, which, in conjunction with strong Spearman correlation between NO3- and Ca2+, also suggests the important contribution of Ca2+ to the neutralisation of acidic species at Welgegund. The second factor is mainly related to acidity (H+), which corresponds to species associated with anthropogenic activities, i.e. NO3- and SO42-. Spearman correlations also indicate strong linkages between NO3- and SO4+. In addition, this factor also had a relatively high loading of NH4+, which is most likely associated with local and regional agricultural activities. The third PCA factor comprised mainly ionic species associated with biomass burning, i.e., OA, K+ and Cl- (Aurela et al., 2016), while this factor was also considered to be associated with marine air masses, as indicated by high loadings of Na+ and Cl-. The species in this factor were also strongly associated in the Spearman correlation analysis.
Source group contributions
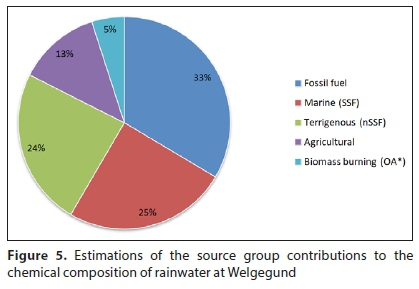
Equations 4 and 5 were used to estimate the sea-salt and non-sea-salt fractions of Cl-, SO42-, Ca2+, Mg2+and K+, from which the marine and crustal contributions of these species were estimated. The non-sea-salt SO42- fraction was separated into crustal and anthropogenic source contributions with the two methods described above. Conradie et al. (2016) assumed that anthropogenic SO42- and total NO3- were predominantly associated with fossil fuel combustion at the four other DEBITS sites. However, since Welgegund is also influenced by other regional sources, such as the pyrometallurgical smelters located in the western Bushveld Complex (Fig. 1), anthropogenic SO42- and total NO3- at Welgegund were considered to be associated with fossil fuel combustion and other industrial activities, i.e., anthropogenic (industrial). NH4+ can mainly be related to agriculture in this part of South Africa. Although the NO3- and NH4+ measured in rainwater at Welgegund can be associated with other anthropogenic and natural sources, a much larger contribution from the anthropogenic activities indicated here can be assumed. The biomass burning contribution to the chemical composition of rain was estimated by the OA VWM concentrations. In Fig. 5, estimations of the source group contributions to the chemical composition of rainwater at Welgegund are summarised.
Marine contribution
The calculated ratios and reference seawater ratios of Cl-, SO42-, Mg2+, Ca2+ and K+ with respect to Na+ (Keene et al., 1986), as well as the corresponding EFs, are listed in Table 4. The marine source contribution at Welgegund was determined by combining the sea-salt fractions calculated for these species (Eq. 4), which were estimated to be 25% (Fig. 5). This signifies a relatively substantial contribution from marine air masses on rain chemistry at Welgegund, which is similar to the marine source contribution determined by Conradie et al. (2016) at Amersfoort. The Cl-/Na+ ratio was similar to the reference seawater ratio with a corresponding EF close to 1, which, together with the strong statistical correlation (Fig. 4), indicates that air masses passing over marine environments are the major source of these species. As indicated by overlaid back trajectories in Fig. 1, Welgegund is impacted by air masses passing over oceans bordering South Africa. The calculated ratios of all other species in relation to Na+ were higher, with SO42-/Na+, Ca2+/Na+ and K+/Na+ being one to two orders of magnitude higher, while Mg2+/Na+ was three times higher. This can be attributed to other sources of these species associated with the major source regions and the relatively clean sector to the west impacting Welgegund. Venter et al. (2018) also attributed the higher contribution of Na+ and Cl- in PM2.5-10 at Welgegund to the influence of marine air masses.

Crustal contribution
The crustal contribution at Welgegund was calculated by subtracting the sea-salt fractions (Eq. 5) and anthropogenic contributions of Cl-, SO42-, Mg2+, Ca2+ and K+ from the respective VWM concentrations. Ca2+, Mg2+ and SO42- are typically indicative of African soil species with these species also being well correlated (Fig. 4). The total crustal contribution ranged between 24 and 19%, depending on the method applied to estimate the anthropogenic SO42- contribution (the source contribution presented in Fig. 5 is based on calculations from the first method). A significant crustal contribution, which is similar to that observed at the other South African DEBITS sites (Conradie et al., 2016), is evident at Welgegund. A relatively high contribution from crustal species in rain can be expected for the semi-arid southern African region, with most rainfall events being convective. As mentioned, Welgegund is frequently impacted by air masses moving over a relatively clean north to south-western sector in which the Karoo and Kalahari are located (Fig. 1). Venter et al. (2017) attributed wind-blown dust to be the most important source of particulate trace metals (Ca, Fe, Na, Mg, Al and Ti) in air masses passing over this region, while Venter et al. (2018) also indicated a larger contribution of crustal species to the ionic composition in the PM2.5-10 at Welgegund. Fly ash associated with coal combustion and pyrometallurgical activities could be additional sources of Ca2+ and Mg+ in rainwater at Welgegund (Mahlaba et al., 2011).
Anthropogenic (industrial) contribution
It is expected that emissions of gaseous SO2 and NOx associated with anthropogenic activities in source regions impacting Welgegund would contribute to the occurrence of SO42- and NO3- in rainwater at this site. Most industries in South Africa do not apply de-SOx and de-NOx technologies, while primary emissions of SO42- and NO3- are unlikely due to most industries in these regions filtering out particulates in off-gas. The major anthropogenic sources of SO2 and NOx in the north-eastern interior of South Africa are coal-fired power plants and petrochemical industries. In addition, pyrometallurgical smelters are also important sources of SO2 in this region, while vehicular emissions, open biomass burning and household combustion (for space heating and cooking) also contribute to elevated NOx (Lourens et al., 2011; Pretorius et al., 2015). The industrialised interior impacting Welgegund is also characterised by anticyclonic recirculation of air masses, which contribute to the ageing of SO2 and NO2 (Lourens et al., 2012). Although natural emissions of NOx from, e.g., biogenic sources and naturally occurring open biomass burning could also contribute to NO3- in rainwater at Welgegund, it is expected that anthropogenic sources would make a relatively large contribution.
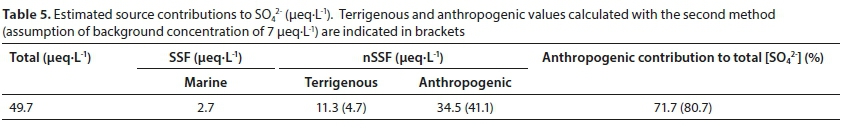
Table 5 presents the crustal and anthropogenic (industrial) source contributions to non-sea-salt SO42-, calculated with the two methods previously described, i.e., Method 1 calculating the excess SO42- to that supplied by gypsum (Eq. 7) and Method 2, where a baseline SO42- level is subtracted from the total SO42- VWM concentration. The estimated contributions of anthropogenic (industrial) SO42- to the total SO42- measured in rainwater at Welgegund, calculated with the first and second methods, are 72% and 81%, respectively. The anthropogenic (industrial) contribution to the total SO42- calculated with the first method was similar to the anthropogenic contribution calculated at the rural background site Louis Trichardt (72%) with this method. However, the estimated anthropogenic contribution calculated with the second method is slightly lower than the values estimated at the industrially influenced Vaal Triangle and Amersfoort sites (~90%) with the second method, while being significantly higher than the anthropogenic (industrial) contribution calculated at Louis Trichardt (43%) and Skukuza (62%) (Conradie et al., 2016). Notwithstanding the deficiencies associated with these estimations of anthropogenic SO42-, both methodologies signify a strong anthropogenic influence on SO42- at Welgegund.
It is evident from Fig. 5 that anthropogenic (industrial) activities have a significant influence on rainwater's chemical composition at Welgegund, with this source group contributing 33% to the total ionic content. The anthropogenic (industrial) source group contribution at Welgegund is lower than the fossil fuel source group contribution to ionic content in rain at Amersfoort (44%) and Vaal Triangle (47%), but higher than the contribution of fossil fuels at the two rural background sites (24% and 13%) (Conradie et al., 2016). As mentioned previously, Amersfoort and Vaal Triangle are located within two highly industrialised national priority areas, while the impact of air masses passing over these regions are evident at Welgegund (Fig. 1). Welgegund is also impacted by large point sources in the western Bushveld Complex, located within the Waterberg-Bojanala priority area, as well as the Johannesburg-Pretoria conurbation (Fig. 1). In addition to large point sources in these source regions, vehicular emissions and household combustion can also contribute to elevated levels of anthropogenic pollutants at Welgegund (Venter et al., 2012; Venter et al., 2018).
Agricultural contribution
The agricultural source group contribution at Welgegund was estimated to be 13% (Fig. 5), which was similar to the contribution of agricultural activities at Amersfoort, Louis Trichardt and Skukuza. A larger agricultural contribution was determined for Vaal Triangle (20%), which was attributed to the manufacturing of fertilisers in that region. As mentioned previously, Welgegund is located on a commercial farm, with the immediate area surrounding Welgegund being grazed by livestock, while the remaining area is covered by crop fields. Jaars et al. (2016) indicated the extent of cultivation in this region through a comprehensive vegetation survey conducted within a 60 km radius from Welgegund. Therefore, gaseous NH3 emissions associated with urea in animal excreta and from soils (Schlesinger and Hartley, 1992), together with the use of fertiliser for crop production, would contribute to NH4+ in rain samples collected at Welgegund. The influence of fertilisers on atmospheric NH4+ is also signified by the relatively strong statistical correlation between NH4+ and NO3- (Fig. 4). Recent studies on aerosol chemical composition at Welgegund also indicated that NH4+ was the second-most abundant species in submicron particulates (Venter et al., 2018; Tiita et al., 2014).
Biomass burning contribution
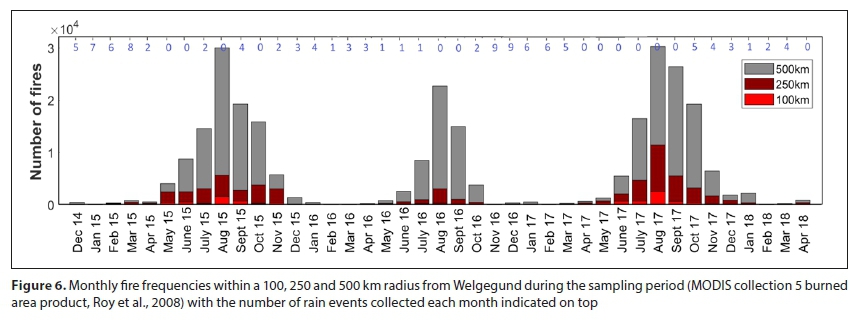
Biomass burning was estimated to contribute 5% to the total ionic content of rain at Welgegund (Fig. 5), which was similar to the biomass burning contributions estimated at Amersfoort and Vaal Triangle. The biomass burning source group contribution was higher at the rural background site, Louis Trichardt. Although Welgegund is frequently impacted by widespread regional open biomass burning plumes (Vakkari et al., 2014), the open biomass burning period typically occurs at the end of the dry season (June to mid-October). Figure 6 depicts the monthly number of fire pixels observed with the MODIS collection 5 burned area product (Roy et al., 2008) within a 100, 250 and 500 km radius of Welgegund, together with the number of rain events collected each month. It is evident that the influence of open biomass burning on rain chemistry will be less pronounced due to the open biomass burning season not coinciding with the wet season. In addition, NO3- was estimated to be of completely anthropogenic origin in this study and not considered in biomass burning contribution calculations, which could also contribute to a lower estimate of the biomass burning contribution.
Seasonal variability
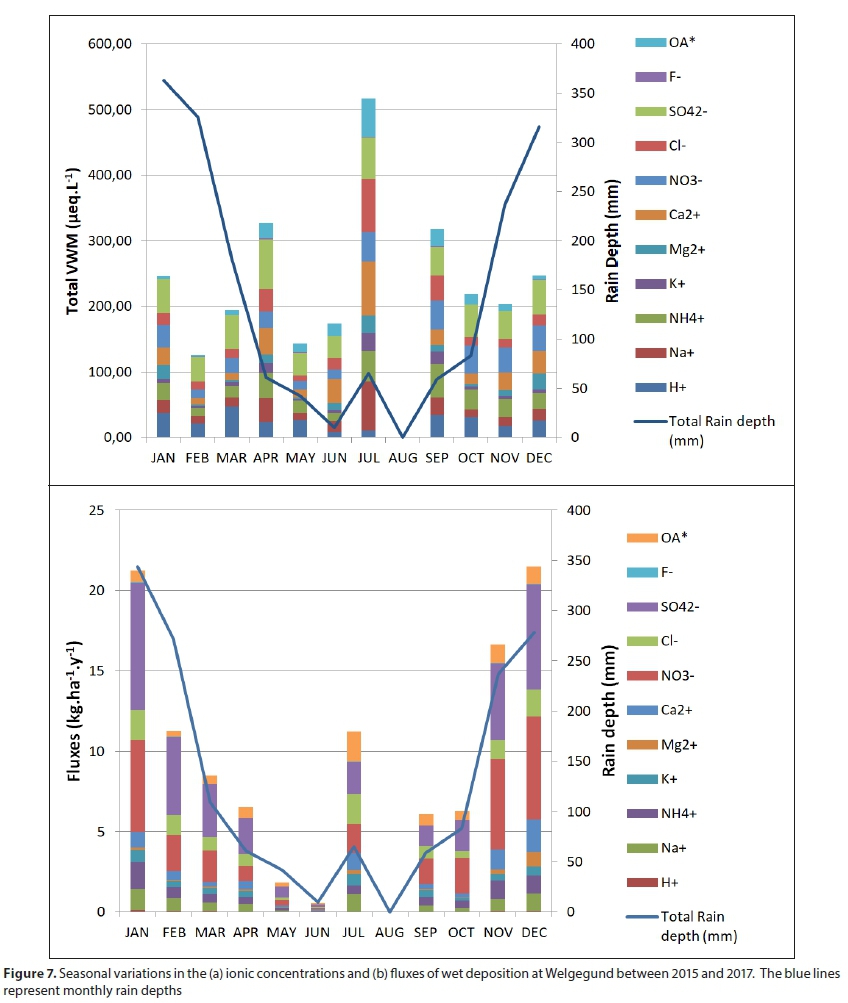
In Fig. 7, the seasonal variabilities in chemical composition and wet deposition fluxes determined during the sampling period are presented. It is evident that the VWM concentrations and the wet deposition fluxes correspond to rainfall depth, i.e., the dry season is characterised by higher ionic concentrations, while significantly higher wet deposition fluxes occur during the wet season. Lower ionic concentrations during the wet season can be attributed to cleansing of the atmosphere through rain events, while the wet removal rate decreases during the dry season. In addition, the dry season coincides with winter, which is characterised by increased air mass recirculation and more pronounced low-level inversion layers trapping pollutants near the surface (Tyson et al., 1996). Winter is also associated with additional coal and wood combustion for domestic heating (Venter et al., 2012; Vakkari et al., 2013), which is also reflected by relatively higher OA VWM concentrations during July. A denser particle distribution in the below-cloud atmosphere also promotes the scavenging efficiency of the raindrops and will increase the washout effect of the rain event (Xu et al., 2017). Therefore, the observed temporal variances in chemical composition can be attributed to seasonal changes in meteorological conditions and source strengths. It is also of interest to note that, similar to the four other South African DEBITS sites, a stronger marine signal is evident during July (higher Na+ and Cl-), which could be attributed to more cold fronts from the southern oceans passing over the region (Conradie et al., 2016).
CONCLUSION
Similar to the four other South African DEBITS sites, SO42- was the most abundant species in rainwater collected at Welgegund. The SO42- VWM concentration at Welgegund was in the same order as the SO42- levels determined at two regional sites within proximity of industrial sources, which had SO42- VWM concentrations three to four times higher compared to levels thereof at two rural background sites. NO3- was the second-most abundant species at Welgegund, with a VWM concentration similar to levels thereof at the industrially impacted sites, which was two to three times higher compared to NO3- VWM concentrations at rural background sites. The total ionic VWM concentrations at Welgegund were also similar to the total VWM concentrations of ionic species at the two industrially impacted sites. S and N wet deposition fluxes were 4.38 S kg∙ha-1∙yr-1 and 4.48 N kg∙ha-1∙yr-1, respectively, which were lower than the S and N deposition determined at the industrially influenced sites due to lower average annual rainfall at Welgegund. The pH of rainwater at Welgegund was below the natural pH of rain, and was comparable to pH levels at the rural background sites, which suggested increased neutralisation of acidic species at Welgegund. Acidic potential calculations indicated that 63% of the acidity was neutralised, mainly by Ca2+ and NH4+.
Statistical analysis and empirical calculations revealed similar major sources of ionic species in rain at Welgegund as those identified for the other South African DEBITS sites. The anthropogenic (industrial) source group had the largest contribution to ionic content at Welgegund, which indicated the significant regional influence of major sources in the north-eastern South African interior and anticyclonic recirculation of air masses. The seasonal variability in ionic content in rainwater also reflected the influence of changes in meteorology and source strength. Crustal species made a significant contribution to ionic content, which was attributed to air mass movement over an arid region in South Africa. A relatively high contribution was also determined from marine sources, while the influence of agricultural activities was also evident. A relatively small contribution was estimated for biomass burning, which was ascribed to the open biomass burning season not corresponding to the wet season. The estimated contributions of different source groups to ionic content in rainwater at Welgegund were similar to those determined at the industrially impacted Amersfoort site.
REFERENCES
AKPO AB, GALY-LACAUX C, LAOUALI D, DELON C, LIOUSSE C, ADON M, GARDRAT E, MARISCAL A and DARAKPA C (2015) Precipitation chemistry and wet deposition in a remote wet savanna site in West Africa: Djougou (Benin). Atmos. Environ. 115 110-123. https://doi.org/10.1016/j.atmosenv.2015.04.064 [ Links ]
AURELA M, BEUKES JP, VAN ZYL PG, VAKKARI V, TEINILÄ K, SAARIKOSKI S and LAAKSO L (2016) The composition of ambient and fresh biomass burning aerosols at a savannah site, South Africa. S. Afr. J. Sci. 112 8. https://doi.org/10.17159/sajs.2016/20150223 [ Links ]
BRUWER AP and KORNELIUS G (2017) Modelling the effects of biogenic NOX on deposition for the South African Highveld and Waterberg regions. Water Air Soil Pollut. 228 326. https://doi.org/10.1007/s11270-017-3526-y [ Links ]
CAIRNCROSS B (2004) Field Guide to Rocks and Minerals of Southern Africa. Struik Nature, Cape Town. [ Links ]
CHILOANE KE, BEUKES JP, VAN ZYL PG, MARITZ P, VAKKARI V, JOSIPOVIC M, VENTER AD, JAARS K, TIITTA P, KULMALA M, WIEDENSOHLER A, LIOUSSE C, MKHATSHW GV, RAMANDH A and LAAKSO L (2017) Spatial, temporal and source contribution assessments of black carbon over the northern interior of South Africa. Atmos. Chem. Phys. 17 6177-6196. https://doi.org/10.1007/s11270-017-3526-y [ Links ]
CONRADIE EH, VAN ZYL PG, PIENAAR JJ, BEUKES JP, GALY-LACAUX C, VENTER AD and MKHATSHWA GV (2016) The chemical composition and fluxes of atmospheric wet deposition at four sites in South Africa. Atmos. Environ. 146 113-131. https://doi.org/10.1016/j.atmosenv.2016.07.033 [ Links ]
GALY-LACAUX C, LAOUALI D, DESCROIX L, GOBRON N and LIOUSSE C (2009) Long term precipitation chemistry and wet deposition in a remote dry savanna site in Africa (Niger). Atmos. Chem. Phys. 9 1579-1595. https://doi.org/10.5194/acp-9-1579-2009 [ Links ]
HARRISON MSJ (1986) A synoptic climatology of South African rainfall variations. PhD, University of the Witwatersrand. [ Links ]
HIRSIKKO A, VAKKARI V, TIITTA P, MANNINEN HE, GAGNÉ S, LAAKSO H, KULMALA M, MIRME A, MIRME S, MABASO D, BEUKES JP and LAAKSO L (2012) Characterisation of sub-micron particle number concentrations and formation events in the western Bushveld Igneous Complex, South Africa. Atmos. Chem. Phys. 12 3951-3967. https://doi.org/10.5194/acp-12-3951-2012 [ Links ]
HOSIOKANGAS J, RUUSKANEN J and PEKKANEN J (1999) Effects of soil dust episodes and mixed fuel sources on source apportionment of PM10 particles in Kuopio, Finland. Atmos. Environ. 33 3821-3829. https://doi.org/10.1016/S1352-2310(98)00400-2 [ Links ]
JAARS K, BEUKES JP, VAN ZYL PG, VENTER AD, JOSIPOVIC M, PIENAAR JJ, VAKKARI V, AALTONEN H, LAAKSO H, KULMALA M, TIITTA P, GUENTHER A, HELLÉN H, LAAKSO L and HAKOLA H (2014) Ambient aromatic hydrocarbon measurements at Welgegund, South Africa. Atmos. Chem. Phys. Discuss. 14 4189-4227. https://doi.org/10.5194/acpd-14-4189-2014 [ Links ]
JAARS K, VAN ZYL PG, BEUKES JP, HELLÉN H, VAKKARI V, JOSIPOVIC M, VENTER AD, RÄSÄNEN M, KNOETZE L, CILLIERS DP, SIEBERT SJ, KULMALA M, RINNE J, GUENTHER A, LAAKSO L and HAKOLA H (2016) Measurements of biogenic volatile organic compounds at a grazed savannah-grassland-agriculture landscape in South Africa. Atmos. Chem. Phys. 16 15665-15688. https://doi.org/10.5194/acp-16-15665-2016 [ Links ]
LACAUX J, TATHY J and SIGHA L (2003) Acid wet deposition in the tropics: two case studies using DEBITS measurements. IGACtivities Newsletter of the International Global Atmospheric Chemistry Project. [ Links ]
LAOUALI D, GALY-LACAUX C, DIOP B, DELON C, ORANGE D, LACAUX, JP, AKPO A, LAVENU F, GARDRAT E and CASTERA P (2012) Long term monitoring of the chemical composition of precipitation and wet deposition fluxes over three Sahelian savannas. Atmos. Environ. 50 314-327. https://doi.org/10.1016/j.atmosenv.2011.12.004 [ Links ]
LOURENS ASM, BEUKES JP, VAN ZYL PG, FOURIE GD, BURGER JW, PIENAAR JJ, READ CE and JORDAAN JH (2011) Spatial and temporal assessment of gaseous pollutants in the Highveld of South Africa. S. Afr. J. Sci. 107 8. https://doi.org/10.4102/sajs.v107i1/2.269 [ Links ]
LOURENS ASM, BUTLER TM, BEUKES JP, VAN ZYL PG, BEIRLE S, WAGNER TK, HEUE K-P, PIENAAR JJ, FOURIE GD and LAWRENCE MG (2012) Re-evaluating the NO2 hotspot over the South African Highveld. S. Afr. J. Sci. 108 6. https://doi.org/10.4102/sajs.v108i11/12.1146 [ Links ]
MAHLABA JS, KEARSLEY EP and KRUGER RA (2011) Effect of fly ash characteristics on the behaviour of pastes prepared under varied brine conditions. Miner. Eng. 24 923-929. https://doi.org/10.1016/j.mineng.2011.04.009 [ Links ]
METH O (2018) New satellite data reveals the world's largest air pollution hotspot is Mpumalanga - South Africa. Greenpeace. https://www.greenpeace.org/africa/en/press/4202/new-satellite-data-reveals-the-worlds-largest-air-pollution-hotspot-is-mpumalanga-south-africa/. (Accessed 29 October 2018). [ Links ]
MPHEPYA JN, GALY-LACAUX C, LACAUX JP, HELD G and PIENAAR JJ (2006) Precipitation chemistry and wet deposition in Kruger National Park, South Africa. J. Atmos. Chem. 53 169-183. https://doi.org/10.1007/s10874-005-9005-7 [ Links ]
NATIONAL ACADEMIES OF SCIENCES E and MEDICINE (2016) The Future of Atmospheric Chemistry Research: Remembering Yesterday, Understanding Today, Anticipating Tomorrow. The National Academies Press, Washington, DC. [ Links ]
PRETORIUS I, PIKETH SJ, BURGER R and NEOMAGUS H (2015) A perspective on South African coal fired power station emissions. J. Energ. South. Afr. 26 27-40. https://doi.org/10.17159/2413-3051/2015/v26i3a2127 [ Links ]
QA/SAC-AMERICAS (2018) The Quality Assurance Science Activity Centre - Lab Intercomparison Study Data [Online]. World Meteor- ological Organisation Global Atmospheric Watch. http://www.qasac-americas.org/lis/700152/57/rings (Accessed 18 January 2018). [ Links ]
RÄSÄNEN M, AURELA M, VAKKARI V, BEUKES JP, TUOVINEN JP, VAN ZYL PG, JOSIPOVIC M, VENTER AD, JAARS K, SIEBERT SJ, LAURILA T, RINNE J and LAAKSO L (2017) Carbon balance of a grazed savanna grassland ecosystem in South Africa. Biogeosciences 14 1039-1054. https://doi.org/10.5194/bg-14-1039-2017 [ Links ]
RODHE H, DENTENER F and SCHULZ M (2002) The global distribution of acidifying wet deposition. Environ. Sci. Technol. 36 4382-4388. https://doi.org/10.1021/es020057g [ Links ]
ROY DP, BOSCHETTI L, JUSTICE CO and JU J (2008) The collection 5 MODIS burned area product -Global evaluation by comparison with the MODIS active fire product. Remote Sens. Environ. 112 3690-3707. https://doi.org/10.1016/j.rse.2008.05.013 [ Links ]
RSA (Republic of South Africa) (2007) National Environmental Management: Air Quality Act, 2004 (No.39 of 2004), Declaration of the Highveld as Priority Area in Terms of Section 18(1) of the National Environmental Management: Air Quality Act, 2004 (Act No. 39 of 2004). Government Gazette 30518. Government Printer, Pretoria. [ Links ]
RSA (Republic of South Africa) (2009) National Environmental Management: Air Quality Act, 2004 (Act No.39 of 2004), Vaal Triangle Airshed Priority Area Air Quality Management Plan. Department of Environmental Affairs and Tourism, Pretoria. [ Links ]
RSA (Republic of South Africa) (2015) National Environmental Management: Air Quality Act, 2004 (No.39 of 2004), Waterberg Bojanala Priority Area Air Quality Plan. Department of Environ-mental Affairs, Pretoria. [ Links ]
SCHINDLER DW (1988) Effects of acid rain on freshwater ecosystems. Science. 239 149-157. https://doi.org/10.1126/science.239.4836.149 [ Links ]
SCHLESINGER WH and HARTLEY AE (1992) A global budget for atmospheric NH3. Biogeochemistry. 15 191-211. https://doi.org/10.1007/BF00002936 [ Links ]
STEIN AF, DRAXLER RR, ROLPH GD, STUNDER BJB, COHEN MD and NGAN F (2015) NOAA's HYSPLIT atmospheric transport and dispersion modeling system. Am. Meteorol. Soc. 2059-2077. https://doi.org/10.1175/BAMS-D-14-00110.1 [ Links ]
STERN DI (2006) Reversal of the trend in global anthropogenic sulfur emissions. Glob. Environ. Change. 16 207-220. https://doi.org/10.1016/j.gloenvcha.2006.01.001 [ Links ]
TIITTA P, VAKKARI V, CROTEAU P, BEUKES JP, VAN ZYL PG, JOSIPOVIC M, VENTER AD, JAARS K, PIENAAR JJ, NG, NL, CANAGARATNA MR, JAYNE JT, KERMINEN V-M, KOKKOLA H, KULMALA M, LAAKSONEN A, WORSNOP D and LAAKSO L (2013) Chemical composition, main sources and temporal variability of PM1 aerosols in southern African grassland. Atmos. Chem. Phys. Discuss. 13 15517-15566. https://doi.org/10.5194/acpd-13-15517-2013 [ Links ]
TYSON PD, GARSTANG M and SWAP R (1996) Large-scale recirculation of air over southern Africa. J. Appl. Meteorol. 35 2218-2236. https://doi.org/10.1175/1520-0450(1996)035<2218:LSROAO> 2.0.CO;2 [ Links ]
TYSON PD and PRESTON-WHYTE RA (2017) The Weather and Climate of Southern Africa. Oxford University Press, Cape Town. [ Links ]
VAKKARI V, BEUKES JP, LAAKSO H, MABASO D, PIENAAR JJ, KULMALA M and LAAKSO L (2013) Long-term observations of aerosol size distributions in semi-clean and polluted savannah in South Africa. Atmos. Chem. Phys. 13 1751-1770. https://doi.org/10.5194/acp-13-1751-2013 [ Links ]
VAKKARI V, KERMINEN VM, BEUKES JP, TIITTA P, ZYL PG, JOSIPOVIC M, VENTER AD, JAARS K, WORSNOP DR and KULMALA M (2014) Rapid changes in biomass burning aerosols by atmospheric oxidation. Geophys. Res. Lett. 41 2644-2651. https://doi.org/10.1002/2014GL059396 [ Links ]
VENTER AD, VAKKARI V, BEUKES JP, VAN ZYL PG, LAAKSO H, MABASO D, TIITTA P, JOSIPOVIC M, KULMALA M, PIENAAR JJ and LAAKSO L (2012) An air quality assessment in the industrialised western Bushveld Igneous Complex, South Africa. S. Afr. J. Sci. 108 10. https://doi.org/10.4102/sajs.v108i9/10.1059 [ Links ]
VENTER AD, VAN ZYL PG, BEUKES JP, JOSIPOVIC M, HENDRIKS J, VAKKARI V and LAAKSO L (2017) Atmospheric trace metals measured at a regional background site (Welgegund) in South Africa. Atmos. Chem. Phys. 17 4251-4263. https://doi.org/10.5194/acp-17-4251-2017 [ Links ]
VET R, ARTZ RS, CAROU S, SHAW M, RO CU, AAS W, BAKER A, BOWERSOX VC, DENTENER F, GALY-LACAUX C, HOU A, PIENAAR JJ, GILLETT R, FORTI MC, GROMOV S, HARA H, KHODZER T, MAHOWALD NM, NICKOVIC S, RAO PSP and REID NW (2014) A global assessment of precipitation chemistryand deposition of sulfur, nitrogen, sea salt, base cations, organic acids, acidity and pH, and phosphorus. Atmos. Environ. 93 3-100. https://doi.org/10.1016/j.atmosenv.2013.10.060 [ Links ]
WMO (2004) Manual for the GAW Precipitation chemistry programme. https://library.wmo.int/doc_num.php?explnum_id=9287. (Accessed 30 July 2019). [ Links ]
XIAO J (2016) Chemical composition and source identification of rainwater constituents at an urban site in Xi'an. Environ. Earth Sci. 75 209. https://doi.org/10.1007/s12665-015-4997-z [ Links ]
XU D, GE B, WANG Z, SUN Y, CHEN Y, JI D, YANG T, MA Z, CHENG N and HAO J (2017) Below-cloud wet scavenging of soluble inorganic ions by rain in Beijing during the summer of 2014. Environ. Pollut. 230 963-973. https://doi.org/10.1016/j.envpol.2017.07.033 [ Links ]
 Correspondence:
PG van Zyl
EMAIL pieter.vanzyl@nwu.ac.za
Received: 31 July 2020
Accepted: 16 July 2021

