


Servicios Personalizados
Articulo
 Inglés (pdf)
 Articulo en XML
 Referencias del artículo
Indicadores

Links relacionados
-
 Citado por Google
 -
 Similares en Google
Compartir

 Permalink
Water SA
versión On-line ISSN 1816-7950
versión impresa ISSN 0378-4738
Water SA vol.47 no.2 Pretoria abr. 2021
http://dx.doi.org/10.17159/wsa/2021.v47.i2.10920
RESEARCH PAPER
Fabrication of smartphone-based colorimetric device for detection of water leaks
Zodidi Gcolotela; Stanley Chibuzor Onwubu; Sindisiwe Fortunate Muthwa; Phumlane Selby Mdluli
Department of Chemistry, Durban University of Technology, PO Box 1334, Durban 4000, South Africa
ABSTRACT
South Africa is a water-scarce country due to the shortage of rainfall. This scarcity is further exacerbated by the loss of water through leakage from faulty pipes. This paper reports on the use of a simple microfluidic device in the early detection of water leakages. The microfluidic paper-based device μPADs) were prepared by printing patterns of wax (100 μm width) on the paper surface and melting the wax into the paper to form hydrophobic barriers. Solutions of lower to higher pH were also prepared and were introduced to the chlorophenol red test strips and a range of colours from yellow (lower pH) to purple (higher pH) were obtained. The digital images obtained with the μPADs were analysed using the CIELab colour system. The optimized pH range was wider than the typical grayscale-based image analysis and was successful for a wide pH range of 2-12. The QR codes attached to the strips enable tracking to obtain the real-time location from which leakage was detected. The study conclusively shows that the combination of digital image analysis and a μPAD device is highly efficient for quantitative analysis, and thus useful for the detection of household water leaks.
Keywords: chlorophenol red; microfluidic device; water leaks; QR codes; real-time
INTRODUCTION
Water supply systems play a critical role in providing quality drinking water to household consumers, for agricultural purposes, and industrial usage (Cosgrove and Rijsberman, 2014). However, water leakage and water loss from burst pipes pose a serious threat to uninterrupted water supply (Yazdekhasti et al., 2018). This has a dire consequence to the quality of life, hygiene and health of hundreds or even thousands of inhabitants (Cosgrove and Loucks, 2015). Moreover, water is one of the vital and scarce resources of life (Pfister et al., 2017). In South Africa, this water scarcity is made even worse by the amount of municipality-supplied water being lost through leaking or burst pipes and dripping taps. This is highly concerning from an economic perspective, as the leaks and pipe bursts cost municipalities a lot of money. For instance, it is estimated that water loss due to burst pipes or water leakages costs eThekwini Municipality approximately 400 million ZAR annually (Thakur et al., 2019). Equally concerning, the recent water scarcity and drought experienced in the Western Cape (Cassim, 2018)called for an urgent need for effective management of water supply in South Africa.
Despite these concerns, Hay et al. (2012) highlighted that water losses are very high in many towns in South Africa and no effective strategies are in place or have been developed by the municipalities to effectively address water losses. Consequently, Du Plessis (2017) moots that a clear understanding of the real potential for reducing water losses is needed before measures are adopted to avoid costly and ineffective demand management strategies.tab They proposed that such water management measures must be both cost effective and ultimately effective in implementing water conservation and water demand management measures, targets, and structures. Therefore, the detection, location and correction of water leakages on time would help in minimising water loss, thereby saving water and money (Seyoum et al., 2017). Unfortunately, in many South African towns and locations the infrastructure needed to adequately monitor water leaks is either non-existent or inadequate (Hay et al., 2012).
Significantly, a proactive investment in existing infrastructure and programmes to reduce the leakages is urgently required along the full cycle - from the treatment plant to tap. Hence, it is sensible for South Africa to make use of leading leakage detection technology on pressurised systems, which can rapidly alert operators to leaks and breakages, and detect leaks in old, low-pressure reticulation systems. Traditionally, detecting and identifying water leaks at household level requires the analysis of the different types of sensored data in the household piping system. Seyoum et al. (2017), however, noted that this method is expensive and difficult to implement. Equally worth mentioning is that many leaks at the domestic level contribute significantly to unaccounted-for water in many water distribution networks. These, Seyoum et al. (2017) noted, are minor but numerous, thus may go unnoticed by the traditional monitoring techniques. This present study, therefore, reports on the use of a simple, inexpensive microfluidic paper device μPAD) equipped with a trackable device for the detection of water leaks.
Meredith et al. (2016) reported that low-cost microfluidic paper-based analytical devices μPADs) offer an opportunity to tackle environmental need by increasing the frequency and geographic coverage of environmental monitoring while also reducing analytical costs and complexity of the measurement. Equally important, the fabrication of μPADs is relatively simple, requiring the use of conventional inkjet printing techniques that involve paper-sizing agents (Jayawardane et al., 2015). In recent years, μPADs have gained attention amongst researchers for their ability to sense multiplex analytes, their rapid sample analysis, and usefulness for confirming diagnostic test results, and reducing the volume of samples (Lim et al., 2017). Owing to these unique attributes, μPADs have been successfully used in the quantification of ammonia in wastewater (Jayawardane et al., 2015); blood separation (Songjaroen et al., 2012); glucose detection (Liu et al., 2016); quantification ofparticulate chromium (Rattanarat et al., 2013); detection of small size molecules (Busa et al., 2016); determination of nitrite in saliva (Bhakta et al., 2014); and detection of disease biomarkers (Lim et al., 2017). Despite these benefits, there is limited evidence of the use of μPADs for the monitoring of water leakage in South Africa.
Colorimetric methods that are based on the analysis of digital images are most commonly used as they are simple and easy to operate. Such methods require no special instrument or apparatus, only a digital camera or a smartphone. Additionally, they allow quantitative analysis by reading out the colour information in terms of red, green, and blue region (RGB) value or cyan, magenta, yellow, black (CMYK) value of the detection area of a μPAD in the digital image. The RGB colour model is device-dependent and the colour information is obtained as separate RGB colour coordinates. The CIELab colour system is device-independent and has three colour coordinates L indicating lightness, a* coordinates where +a indicates red and -a* indicates green, and b* coordinates where +b indicates yellow and -b indicates blue. Komatsu et al. (2016) demonstrated a quantitative analysis based on multiple colour changes on μPADs using the CIELab colour system to analyse the digital images. Kim et al. (2017) reported a smartphone-based optical platform for colorimetric analysis of μPADs. Hossain et al. (2015) studied a lab-in-a-phone, a smartphone-based portable fluorometer for pH measurements of environmental water. Image analysis and μPADs are a suitable combination for the point-of-care applications and testing in resource-limited locations. The mean of RGB values (grayscale) is one of the most common conditions in image-analysis-based colorimetry (Komatsu et al., 2016; Shen, 2003). However, the grayscale does not allow quantitative analysis based on multiple changes of colour such as a universal pH test strip because the grayscale cannot follow multiple colour changes (Komatsu et al., 2016).
Colour difference is a measurement of the numerical differences between colour specifications and is given by the following equation:
Chromaticity or chroma is the saturation level or intensity of a particular hue and is defined as the distance of departure of a chromatic colour from the neutral (grayscale) colour with the same value. Chroma is the dullness or vividness of colour and is given by Eq. 2. Hue angle is defined as the attribute by which we distinguish red from green, blue from yellow, etc., and is given by Eq. 3.

This study aimed to combine chemistry with technology by fabricating a colorimetric test strip that will help in detecting water leaks and alerting the municipality in near-real-time. Thus, this paper reports on a simple colorimetric pH measurement method using a μPAD based on the CIELab colour space.
MATERIALS AND METHODS
Chemicals and materials
Chlorophenol red (CAS number 4430-20-0) andsodium hydroxide were purchased at Nexor chemicals (98% purity, South Africa).
Preparation of indicators
0.1 g of chlorophenol red was dissolved in a 250 mL flask containing 23.6 mL of 0.01 M NaOH, which aids in the dissolution of chlorophenol red. Paper was soaked in this solution, drained and dried in an oven to achieve a yellow colour. The paper was then cut into small strips and stored in a desiccator with dry silica gel.
Humidity test
The prepared chlorophenol red test strip was investigated to determine its stability in a moist environment. The analysis was perform using EQ 072 and EQ 073 at different time intervals and different temperatures.
Fabrication traceable microfluidic (μPADs) paper device
Patterns of wax were printed on chromatographic paper using a wax printer. CorelDraw Home and Student X7 were used to design the colour filter. The colour filter was printed on a No.1 chromatography paper using a wax printer (ColorQube 8570DN, Xerox), and was cut to A4 size before use. The sheets of Whatman No.1 chromatography paper were directly fed into the printer. The printed paper was then heated on a hotplate at 120°C for 8 min, thereby melting the wax to form hydrophobic barriers. A drop of the prepared suitable indicator solution was introduced into hydrophilic circles of wax patterns on chromatographic paper and left to dry overnight. A quick-response code (QR code) was generated using an online QR code generator (https://www.qr-code-generator.com/) and was used to encode and decode field test results. A uniform resource locator (URL) was created, that was used to link the QR code with the Google Analytics application that was used to analyse the data. QR codes were printed and attached to the chromatographic paper and the top side covered with a clear tape to protect paper from tearing. CorelDraw Home and Student X7 was used for the design of Lovibond colour filter. The colour filter was printed on a plastic slide using a wax printer (ColorQube 8570DN, Xerox). The fabricated Lovibond colour filter was used to confirm the pH observed using both the cuvette and colorimetric filter paper. This was done to optimise the fabrication process. The complementary reading for each colour was printed at an angle of 90° to the complementary colour. These were captured with the QR scanner of a smartphone which directed the reading to Google Analytics.
Scanning electron microscopy (SEM) observation of the microfluidic paper
A scanning electron microscope (Field Emission-Carl Zeiss) operating at controlled atmospheric conditions at 20 kV was used to examine the surface structure of the developed μPAD devices. Prior to SEM observation, the surface was coated with a thin, electro-conductive gold film to prevent the build-up of electrostatic charge.
Google Analytics and location
A Google Analytics account was created. The website URL for this study is (https://zodidi68.wixsite.com/website), where one can find more information about the results obtained. AQR code was downloaded using the smartphone, which enables tracking and thus obtaining the location at which a leakage was detected. The website is tracked by Google Analytics to indicate how many leaks have been reported (real-time view) and where exactly those leaks are situated. GPS locations can be viewed by country, province, city, etc.
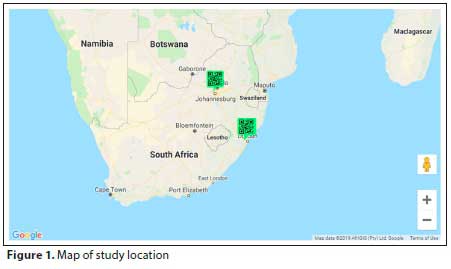
South Africa has nine provinces; however, the study location was limited to KwaZulu-Natal and Gauteng provinces. Figure 1 shows the map of the study location.
RESULTS AND DISCUSSION
Humidity detection and indicator investigations
The humidity test reveals that chlorophenol red was stable when exposed to moisture. Equally significant, the irreversible colour change observed for the chlorophenol red test when the indicator is exposed to a humidity above 55% suggests that it is suitable for use in this study, since it offers stability at high humidity. Hence it was assumed that chlorophenol-prepared test strips will not interfere with the leak detection test.
Nevertheless, the chlorophenol red colour change varies with pH; it is more yellow in highly acidic solutions and more purple in highly basic solutions. With this variation, we tried validating the colour change by treating the solutions with tap water of different pH levels with three drops of the indicator at 572 nm wavelength. It was observed that at highly acidic solutions the plotted line was level, but when approaching pH 4 the line starts rising until about pH 10, and then starts levelling off for the most basic pH solutions. This made it difficult to tell the difference in colour intensities between pH 1 and 2. There were also difficulties analysing the strip with ImageJ as the colour intensities were closely matched for pH 1 and 2 (Fig.2).

Scanning electron microscope observation of the device
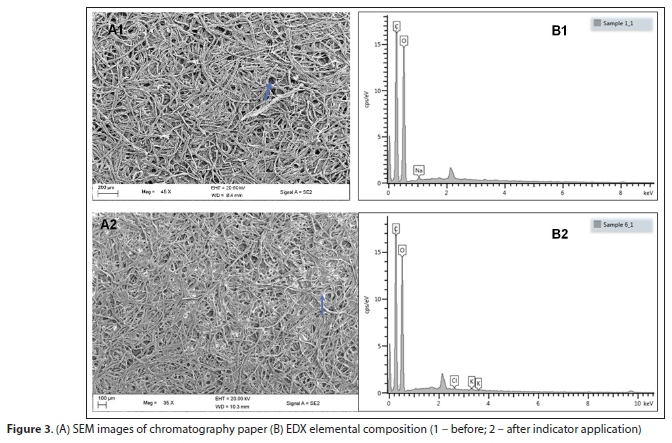
The microstructure and elemental composition of the microfluidic paper before and after chlorophenol red application are given by SEM and EDX images (Fig. 3). In Fig. 3 A1 and A2, the porous structure of the paper is visibly evident. This is in agreement with Costa et al. (2014) who showed that chromatography paper has a high porosity (~68%) with a corresponding high pore diameter (100 μm). The EDX images revealed differences in the elemental composition of the paper before and after indicator application. For example, the EDX spectrum before indicator application (B1) revealed the presence of carbon, oxygen and sodium.
The presence of these elements may be attributed to the composition of the chromatography paper, which is primarily cellulose. Chromatography paper is manufactured from high-quality cotton liners that have been treated to achieve a high cellulose content (>98%) (Costa et al. (2014). After indicator application, the presence of chlorine was evident in the EDX spectrum (B2), which may be attributed to the chlorophenol red.
Leak detection test
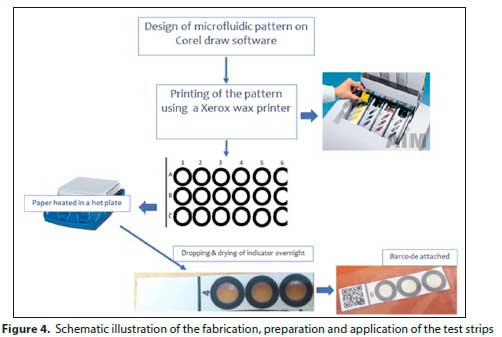
The fabricated μPADs were then used for the colorimetric detection of water leaks using the chlorophenol red indicator. Drops of chlorophenol red indicator were dropping into a reagent zone of the μPAD and allowed to dry overnight. Once the microfluidic paper dried, QR codes were attached and the surface of the microfluidic paper covered by a clear plastictape to prevent tearing when in-contact with water (Fig. 4).
The fabricated chlorophenol red test strip was then wrapped around the water pipes at various places to detect leakages. The strip turned purple/violet immediately where water leaks were observed and did not change colour on dry pipes. The monitoring system can be linked to a network of plumbers and/or municipal personnel that attends to the leaks.
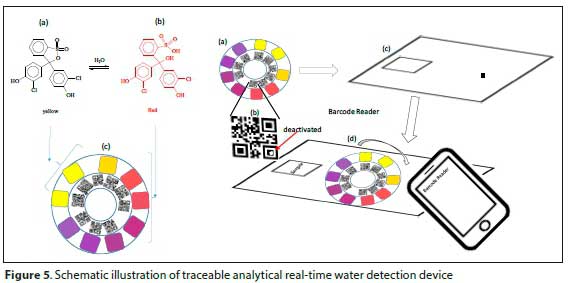
The strips are then tracked using Google Analytics for each scan done. Scanning the QR codes takes the smartphone user to a website that has information on the chlorophenol red test strips, along with contact details (Fig. 5). Whilst on the website it is possible to track the user's location using GPS, making it easier to respond in a short time on detected water leaks.
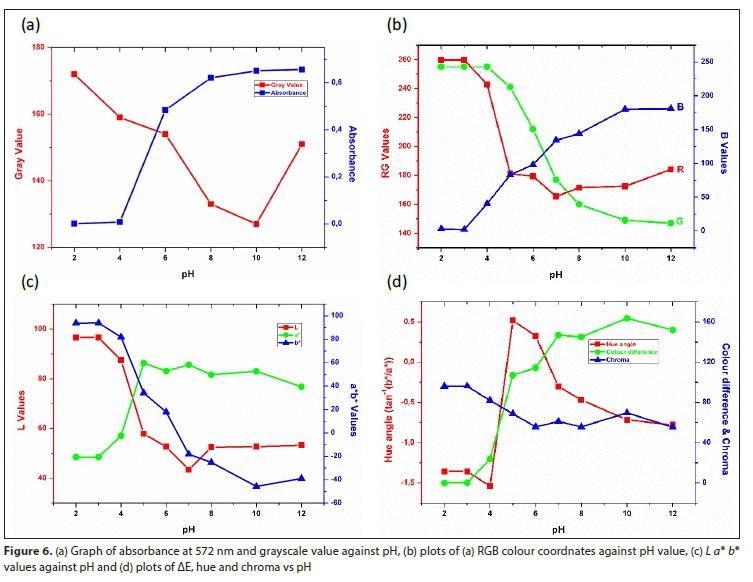
The colour change of the strip was verified using Lovibond filter as shown in Fig. 6. The colour change was compared by rotating the disk until the similar colour matches the colour that was obtained from the leakage, and was scanned using QR code scanner application. The QR code become active when it overlapped with the black dot that is printed in Fig. 6c. As result only one QR code that corresponds with the colour will be scanned. Apart from information regarding leakage of water, the disk is also designed to read the pH of the system. ImageJ software was used to measure the intensity of the colour formation in the detection zones. The RBG (red, green, blue) colour intensity profile plot was obtained passing through the centre of each detection zone. Figure 6a shows plots of grayscale and absorbance against the pH obtained from the leakage. A significant decrease was observed from the plot of grayscale against pH between 2 and 10, whereas a significant increase was noted in the plot of absorbance against pH in the range of 2-12, indicating that the absorbance is directly proportional to pH. The red and green coordinates of the RGB curves decreased rapidly while a rapid increase was noted in the blue coordinates as the pH values increased (Fig. 6b). The RGB colour coordinates for each pH value were converted to L, a* and b* values (using conversions available at http://colormine.org/convert/rgb-to-hunterlab) (McLaren, 1976; Yusufu and Mills, 2018). The L and the b* curves decreased rapidly as the pH increased (Fig. 6c), indicating that as the pH increased the water became darker.
The gradual increase at pH 5 in the a* curve suggests that the water was red; after that it started to drop, leaning towards the green region. Colour difference, chroma, and hue angle were calculated using Eqs 1-3, respectively. The L0, a0* and b0* for the ΔE were the colours produced at initial pH 2. The colour difference curve in Fig. 6d increased monotonously with an increasing pH value obtained from water sample analysis. Chroma decreased gradually with the increase in pH, indicating that the water was a dull colour. A steep rise in the hue angle was obtained between pH 4 and 5.
The real-time users from the website and their locations are shown in Table 1. This proves that the QR code scanner is conveying the message to Google Analytics.
CONCLUSIONS
Chromatographic paper is an inexpensive, biodegradable, and combustible material. The porous structure of paper makes it ideal for lateral flow assays and chromatography applications; paper devices can be easily used successfully for detection of water with the chlorophenol red strips. In this paper, the use of a simple pH measurement in the microfluidic device in the early detection of water leakages was demonstrated. A colorimetric method based on the RGB colour coordinates, CIELab colour difference (ΔΕ), hue, and chroma was successfully optimised. Multiple colour changes due to the chlorophenol red pH indicator were suitable for a colorimetric pH measurement based on the use of ΔΕ. The combination of the μPADs and image analysis facilitated quantitative analysis for multiple colour changes and confirmed high assay reproducibility. The optimized paper-based analytical method will accelerate applications to point-of-care testing and in resource-limited settings.
REFERENCES
BHAKTA SA, BORBA R, TABA JR M, GARCIA CD and CARRILHO Ε (2014) Determination of nitrite in saliva using microfluidic paper-based analytical devices. Anal. Chim. Acta. 809 117-122. https://doi.org/10.1016/j.aca.2013.11.044 [ Links ]
BUSA LSA, MOHAMMADI S, MAEKI M, ISHIDA A, TANI H and TOKESHI M (2016) Advances in microfluidic paper-based analytical devices for food and water analysis. Micromachines 7 (5) 86. https://doi.org/10.3390/mi7050086 [ Links ]
CASSIM Z (2018) Cape Town could be the first major city in the world to run out of water. In: USA Today, 22 January 2018. [ Links ]
COSGROVE WJ and LOUCKS DP (2015) Water management: Current and future challenges and research directions. Water Resour. Res. 51 (6) 4823-4839. https://doi.org/10.1002/2014WR016869 [ Links ]
COSGROVE WJ and RIJSBERMAN FR (2014) World Water Vision: Making Water Everybody's Business. Routledge, London. https://doi.org/10.4324/9781315071763 [ Links ]
COSTA M, VEIGAS B, JACOB J, SANTOS D, GOMES J, BAPTISTA P, MARTINS R, INÁCIO J and FORTUNATO E (2014) A low cost, safe, disposable, rapid and self-sustainable paper-based platform for diagnostic testing: lab-on-paper. Nanotechnology. 25 (9) 094006. https://doi.org/10.1088/0957-4484/25/9/094006 [ Links ]
DU PLESSIS A (2017) A future outlook: improved water efficiency and possible strategic actions for South Africa and the Upper Vaal WMA. In: Freshwater Challenges of South Africa and its Upper Vaal River. Springer, Cham. 129-151. https://doi.org/10.1007/978-3-319-49502-6_8 [ Links ]
HAY E, RIEMANN K, VAN ZYL G and THOMPSON I (2012) Ensuring water supply for all towns and villages in the Eastern Cape and Western Cape Provinces of South Africa. Water SA. 38 (3) 437-444. https://doi.org/10.4314/wsa.v38i3.9 [ Links ]
HOSSAIN A, CANNING J, AST S, RUTLEDGE PJ, YEN TL and JAMALIPOUR A (2015) Lab-in-a-phone: smartphone-based portable fluorometer for pH measurements of environmental water. IEEE Sens. J. 15 (9) 5095-5102. https://doi.org/10.1109/JSEN.2014.2361651 [ Links ]
JAYAWARDANE BM, MCKELVIE ID and KOLEV SD (2015) Development of a gas-diffusion microfluidic paper-based analytical device (μPAD) for the determination of ammonia in wastewater samples. Anal. Chem. 87 (9) 4621-4626. https://doi.org/10.1021/acs.analchem.5b00125 [ Links ]
KIM SC, JALAL UM, IM SB, KO S and SHIM JS (2017) A smartphone-based optical platform for colorimetric analysis of microfluidic device. Sens. Actuators B: Chem. 239 52-59. https://doi.org/10.1016/j.snb.2016.07.159 [ Links ]
KOMATSU T, MOHAMMADI S, BUSA LSA, MAEKI M, ISHIDA A, TANI H and TOKESHI M (2016) Image analysis for a microfluidic paper-based analytical device using the CIE L* a* b* color system. Analyst. 141 (24) 6507-6509. https://doi.org/10.1039/C6AN01409G [ Links ]
LIM WY, GOH BT and KHOR SM (2017) Microfluidic paper-based analytical devices for potential use in quantitative and direct detection of disease biomarkers in clinical analysis. J. Chromatogr. B 1060 424-442. https://doi.org/10.1016/j.jchromb.2017.06.040 [ Links ]
LIU S, SU W and DING X (2016) A review on microfluidic paper-based analytical devices for glucose detection. Sensors. 16 (12) 2086. https://doi.org/10.3390/s16122086 [ Links ]
MCLAREN K (1976) XIII-The development of the CIE 1976 (L* a* b*) uniform colour space and colour-difference formula. J. Soc. Dyers Colourists. 92 (9) 338-341. https://doi.org/10.1111/j.1478-4408.1976.tb03301.x [ Links ]
MEREDITH NA, QUINN C, CATE DM, REILLY TH, VOLCKENS J and HENRY CS (2016) Paper- based analytical devices for environmental analysis. Analyst. 141 (6) 1874-1887. https://doi.org/10.1039/C5AN02572A [ Links ]
PFISTER S, BOULAY A-M, BERGER M, HADJIKAKOU M, MOTOSHITA M, HESS T, RIDOUTT B, WEINZETTEL J, SCHERER L and DÖLL P (2017) Understanding the LCA and ISO water footprint: A response to Hoekstra (2016) "A critique on the water-scarcity weighted water footprint in LCA". Ecol. Indic. 72 352-359. https://doi.org/10.1016/j.ecolind.2016.07.051 [ Links ]
RATTANARAT P, DUNGCHAI W, CATE DM, SIANGPROH W, VOLCKENS J, CHAILAPAKUL O and HENRY CS (2013) A microfluidic paper-based analytical device for rapid quantification of particulate chromium. Anal. Chim. Acta. 800 50-55. https://doi.org/10.1016/j.aca.2013.09.008 [ Links ]
SEYOUM S, ALFONSO L, VAN ANDEL SJ, KOOLE W, GROENEWEGEN A and VAN DE GIESEN N (2017) A Shazam-like household water leakage detection method. Proced. Eng. 186 452459. https://doi.org/10.1016/j.proeng.2017.03.253 [ Links ]
SHEN Z (2003) Colour differentiation in digitial images. MSc dissertation, Victoria University of Technology, Australia. [ Links ]
SONGJAROEN T, DUNGCHAI W, CHAILAPAKUL O, HENRY CS and LAIWATTANAPAISAL W (2012) Blood separation on microfluidic paper-based analytical devices. Lab on a Chip. 12 (18) 3392-3398. https://doi.org/10.1039/c2lc21299d [ Links ]
THAKUR R, HARRIS G, THAKUR S and ONWUBU S (2019) Factors contributing towards high water usage within poor communities in KwaZulu-Natal, South Africa. WIT Trans. Ecol. Environ. 239 1-10. https://doi.org/10.2495/WS190011 [ Links ]
YAZDEKHASTI S, PIRATLA KR, MATTHEWS JC, KHAN A and ATAMTURKTUR S (2018) Optimal selection of acoustic leak detection techniques for water pipelines using multi-criteria decision analysis. Manage. Environ. Qual. 29 (2) 255-277. https://doi.org/10.1108/MEQ-05-2017-0043 [ Links ]
YUSUFU D and MILLS A (2018) Spectrophotometric and digital colour colourimetric (DCC) analysis of colour-based indicators. Sens. Actuators B: Chem. 273 1187-1194. https://doi.org/10.1016/j.snb.2018.06.131 [ Links ]
 Correspondence:
Stanley Chibuzor Onwubu
Email: profstan4christ@yahoo.com
Received: 26 October 2019
Accepted: 25 March 2021

