


Servicios Personalizados
Articulo
 Inglés (pdf)
 Articulo en XML
 Referencias del artículo
Indicadores

Links relacionados
-
 Citado por Google
 -
 Similares en Google
Compartir

 Permalink
Water SA
versión On-line ISSN 1816-7950
versión impresa ISSN 0378-4738
Water SA vol.47 no.2 Pretoria abr. 2021
http://dx.doi.org/10.17159/wsa/2021.v47.i2.10919
RESEARCH PAPER
Development of a flowchart method for source detection of illicit discharges into stormwater drainage systems in Cape Town
Yaw Owusu-Asante
Department of Civil Engineering and Surveying, Cape Peninsula University of Technology, PO Box 1906, Cape Town 7535, South Africa
ABSTRACT
Stormwater drainage systems discharging non-storm water add substantial pollution to urban watercourses, with negative impacts to water quality and aquatic ecosystems. Thus, the elimination of these discharges can be a highly effective non-structural best management practice (BMP) to improve water quality. This study aimed to guide local municipalities whose task it is to control polluted non-storm water entries into the stormwater drainage system. The study evaluated procedures, methodologies and techniques of illegal discharge detection and elimination (IDDE) programme components, as practised internationally, and applied these in a local condition to verify their feasibility and challenges. The paper provides guidance to identify and prioritise investigations for controlling illegal discharges into stormwater drainage systems. Challenges encountered in the study included lack of legal authority to undertake inspection, surveillance and monitoring at private and corporate properties, and to undertake requisite enforcement measures to remove sources of illegal discharges. It is recommended that local governments include in their stormwater management plan a control measure for an IDDE programme. More work is needed to better quantify the pollutant prevention and removal strategies and associated costs.
Keywords: illegal discharge; pollution source detection; outfall monitoring; non-storm water; flowchart method; stormwater quality master planning
INTRODUCTION
Illicit or illegal discharge is any non-storm water (dry weather) flow entering a stormwater drainage system, excluding those considered an insignificant source of pollution to urban watercourses. While stormwater pollution is a major contributor to current water quality problems, studies (such as Pitt and Rittenhouse, 2001; Brown et al., 2004; RHP, 2005; Irvine et al., 2011; Nel et al., 2013; Chandler and Lerner, 2015; Panasiuk et al., 2015 and 2016) have shown that dry weather discharge pollution also has a significant impact on water quality and ecosystem sustainability. Through natural or anthropogenic pathways, dry weather discharges enter stormwater conveyance systems, and comprise a wide range of non-storm water flows. According to Brown et al. (2004), illegal discharges originate from many sources and result from: illegal dumping practices, cracked sewer pipes, illegal cross-connections between sewer and drainage systems, connection of floor drains to stormwater drains, sanitary sewer overflows into storm drains, inflow/infiltration, straight pipe sewer discharge into open channels and streams, failing septic systems and sewer pump station failure. Notable and serious sources include sanitary wastewater, industrial and commercial liquid waste discharges and vehicle repair operations (Pitt et al., 1993). Illegal discharges must of necessity be considered 'unlawful' because stormwater drainage systems, in contrast with wastewater sewer systems, are not planned, designed and constructed to receive and/or discharge contaminated non-storm water.
Provisions of the National Water Act (RSA, 1998) require water use permits or licenses for polluted non-storm discharges to watercourses. A requirement to adequately prevent polluted non-storm discharges into the stormwater drainage systems is linked to the provisions of water use licenses in the Act. This would suggest that emphasis should be focused on the control of illegal connections and discharges to municipal stormwater drainage systems. This would require all municipalities to detect sources of illegal discharges into the stormwater drainage system so that they may implement corrective measures to eliminate them. Improvement of the water quality of receiving waters requires attention to both dry-weather loadings as well as wet-weather or stormwater loadings. The identification and removal of illegal discharges is an essential element of water quality master planning. The study aims to outline methodologies and techniques for identification, detection, monitoring and removal of illegal discharges.
Case study description
A study by Nel et al. (2015) for the City of Cape Town (CoCT) undertook a risk assessment of catchments in the City's water management areas to determine their vulnerability to pollution, and prioritised the catchments, rivers and wetlands for management intervention. The Diep River catchment and its watercourses were ranked as among the most vulnerable to pollution and accorded a high priority for management actions. Owusu-Asante (2019) undertook a risk analysis and risk mapping to assess the severity of illegal discharge potential in the Diep River catchment and determine which sub-catchments merit priority investigation. Over 85% of the urbanised sub-catchments were classified as medium to high risk for illegal discharge potential. Based on these two studies, the Diep River catchment (Fig. 1) was selected as a case study demonstration project site.
The Diep River originates outside the municipal area of Cape Town, with its source in the Riebeek-Kasteel Mountains, from where it flows in a south-westerly direction through Malmesbury where it receives effluent from Swartland Wastewater Treatment Works (WWTW). In its middle, undeveloped reaches, it flows through agricultural lands (livestock and crops). Lower downstream, near Cape Town; it flows through informal settlement areas including Doornbach and Dunoon and residential areas of Table View and Blaauwberg. The mouth of the Diep River is at the Milnerton Lagoon where it discharges to the Atlantic Ocean after flowing through the Rietvlei and Zoarvlei. The Milnerton Lagoon is located adjacent to the residential suburb of Milnerton and is used extensively for recreational purposes, particularly by canoeists. Rietvlei is a large wetland complex in the floodplain of the Diep River between the suburbs of Milnerton and Table View. The wetland drains into Table Bay via the Milnerton Lagoon. The wetland complex comprises areas of reed beds, seasonal pans and a large deepwater lake. Zoarvlei, in the Paarden Eiland industrial area, receives runoff from the suburbs of Rugby and Brooklyn. Its outlet is located in the Milnerton Estuary near the mouth (Owusu-Asante, 2019 p. 87). The Diep River delivers goods and services such as: ecotourism and recreation; water supply for irrigation; flood attenuation at Rietvlei; and breakdown and dilution of pollutants (RHP, 2005 p. 33).
METHODS
Outfall inspection
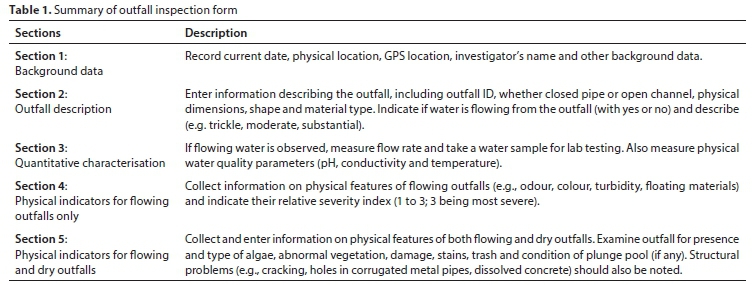
Outfall inspection is a popular and effective method to identify illegal discharges to select sub-catchments for further investigations, and is an indispensable component of an IDDE program to effectively and comprehensively manage illegal discharges in larger municipalities with different land uses. Outfall inspections comprise physically locating and recording geographic positions of all stormwater outfalls discharging to receiving waters, documenting their physical and discharge characteristics to evaluate their illegal discharge potential and severity. The inspection involved walking the Diep River to measure and record requisite information about each outfall, such as GPS location, dimensions of the pipe, odour, colour, litter, flow rate, water quality characteristics, and other visual indicators. The basic tool used for outfall inspection was the outfall inspection form (also known as the outfall reconnaissance inventory (ORI) form, Brown, et al, 2004). The inspections were conducted during dry weather conditions when there has been no runoff producing rainfall for the previous 48 hours. Visual inspections were performed to locate indicators of illegal discharge (evidence of toilet paper, grease, excessive plant growth, foul odour). Where there was no flow at the time of inspection, but if visual or olfactory evidence of illegal discharge was observed, the outfall was re-visited. The outfall inspection data were used to characterise outfalls as having an unlikely, potential, suspect or obvious illegal discharge potential. Information on the outfall inspection form is categorised into 5 sections as summarised in Table 1. The information in Table 1 was applied in the outfall characterisation according to the following criteria:
• Unlikely: non-flowing outfalls with no physical indicators of illegal discharge.
• Potential: presence of two or more indicators in Section 5 (Table 1).
• Suspect: presence of one or more indicator(s) in Section 4 (Table 1) with a severity index of 3.
• Obvious: presence of one or more water quality indicators in Section 3 (Table 1) exceeding recommended limit.
The result of the outfall inspection was used to provide direction as to which outfall drainage area or stormwater drain segment warranted further investigation to locate the source of the illegal discharge.
Sampling of flow types and development of a flowchart method
Flow types refer to discharges of different natures or sources, such as wastewater, wash water (laundry and car wash), industrial effluent, landscape irrigation return flows, groundwater or tap water. The analysis of water quality characteristics provides a technique or decision-making tool to distinguish between flow types, which is necessary for tracing illegal discharges to their sources. This entails the collection and analysis of representative samples from the source of major flow types in the catchment to build what is often called a 'fingerprint library. This library is simply a statistical summary of water quality characteristics (or signatures, or 'fingerprints') from various flow types. Based on this library, a decision-making tool (or flowchart method) is developed to identify illegal discharges and to distinguish them according to flow types. The design and implementation of indicator monitoring of flow types involve the following methodology and techniques: (i) selection of indicator parameters that could provide a 'fingerprint' of illegal discharges, (ii) sampling protocol and methods to analyse sample, (iii) development of a 'fingerprint' library and (iv) flowchart method to distinguish between flow types.
Detection of illegal discharges into stormwater drains necessitates selection and measurement of particular parameters of the identified outfall discharge. Indicator parameters of greatest concern should be unique for each flow type so that their presence in a discharge can be used to infer likely flow-type source (Pitt and Rittenhouse, 2001). A methodology used in this study is based on detection and quantification of clean waters (e.g. tap and spring waters) and dirty waters (e.g. wastewaters, wash-waters, irrigation return flows, etc.). If the relative concentrations of these flow types are known, then the outfall discharge can be assessed as polluted or not. According to Brown et al. (2004:121), an ideal indicator parameter should meet the following notable criteria: (i) for major flow types, there should be significant variation in concentrations among them (ii) within each flow type, there should be fairly minor variations in concentrations, (iii) parameter should be conservative (i.e. physical, chemical or biological processes do not result in changes in concentration), (iv) parameter measurements should be easy and repeatable. The following sampling guidelines were adopted in this study:
• SANS 5667-1, Water Quality - Sampling - Part 1: Guidance on the design of sampling programmes and sampling techniques.
• SANS 5667-3, Water Quality - Sampling - Part 3: Guidance on the preservation and handling of water samples.
• SANS 5667-5, Water Quality - Sampling - Part 5: Guidance on sampling of rivers and streams.
• SANS 5667-10, Water Quality - Sampling - Part 10: Guidance on sampling waste waters.
• SANS 5667-11, Water Quality - Sampling - Part 11:
Guidance on the sampling of groundwaters.
• SANS 5667-14, Water Quality - Sampling - Part 14:
Guidance on quality assurance and quality control of environmental water sampling and handling.
All samples (including those from flowing outfalls) were iced and delivered to the laboratory for analysis. Physical parameters, including temperature, conductivity, and pH, were measured and recorded in the field. Chemical and microbiological analyses were conducted at Cape Peninsula University of Technology, duplicates were analysed at Bemlab and AL Abbott laboratories in Cape Town. Basic analytical methods applied in this study and suitable for an IDDE programme in terms of cost-effectiveness, ease and rapidity of analysis, minimum staff training requirements and high-level precision, are discussed extensively in Pitt (2001 p. 78-95). The purpose of the 'fingerprint library' was to locally characterise these flow types in the community. Due to project time and financial constraints, 10 sample sizes were used to compile the fingerprint library as per recommendation by Brown et al. (2004). Data from the library were analysed to: (i) determine which parameters contributed unique and significant information to the flow type characterisations and (ii) determine the degree to which individual flow types could theoretically be separated and identified based on these flow type characterisations. This was achieved using statistical analyses such as the use of box and whisker plots. Where the data distribution was not normal, log-transformed data were used in the analyses to approximate a normal distribution. A box-and-whisker plot of each parameter graphically summarises the concentrations at which one indicator parameter occurs within each flow type category. Comparisons of source box plots were made to visually assess significant differences. At least at 95% confidence level, boxes are generally and significantly different if they do not overlap.
Trackdown investigations
The purpose of tracking down or isolating illegal discharges is to implement corrective measures to remove them. A variety of methodologies and techniques are available to achieve this purpose; however, two methods, namely, drainage area and storm drain investigations, were employed in this study. For the drainage area investigation, GIS data were analysed to identify likely generating sites (after matching outfall discharge characteristics with operation and waste streams of industrial and commercial facilities in the drainage area) to identify the potential source of the illegal discharge. This is based on the fact that some industries and commercial establishments usually produce discharges with a distinct colour, smell or unusual indicator parameter sample reading (Brown et al., 2004:158). Storm drain investigation involved progressive inspection and sampling at manholes further up or down the drainage network to locate the pipe segment flow source.
CASE STUDY RESULTS AND DISCUSSION
Initial outfall inspection and data analysis
About 42 outfalls on the Diep River were located, numbered and inventoried. Outfall diameters ranged from 100 to 1 800 mm (with a median value of 450 mm), excluding open channels. Non-storm flows were observed at a total of 27 outfalls (64%). Of the 42 outfalls, 5 (12%) had flows that were described as trickle (< 0.5 L/s); 4 (10%) as moderate (0.5 to 5 L/s); and 18 (43%) as substantial (>5 L/s). The mean and median flow rates were 22 and 3 L/s respectively. Outfall inspection and data analysis resulted in the following characterisation:
• 7 outfalls were characterised as 'potential', that is having two or more physical indicators (e.g., presence of algae, abnormal vegetation, damage, stains, litter, and condition of plunge pool if any).
• 9 outfalls were characterised as 'suspect', that is having one or more physical indicators (e.g., presence and relative severity of the odour, colour, turbidity, and floating materials).
• 21 outfalls were characterised as 'obvious', that is having one or more quantitative water quality indicator parameter exceeding the recommended limit of South African Water Quality Guidelines, DWAF (1996).
The characterisation was used to validate the outcome of risk mapping in Diep River catchment (Owusu-Asante, 2019). It was also used to prioritise and develop a monitoring strategy for problem outfalls.
Development of a flowchart method
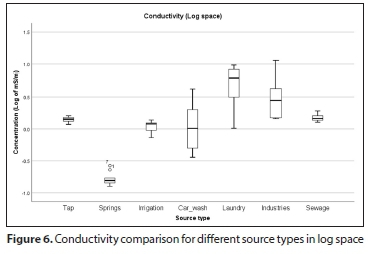
Data from the 'fingerprint library' were used to create box-and-whisker plots to establish a concentration pattern for each indicator parameter. For example, Fig. 2 shows the box-and-whisker plots for the ammonia/potassium ratio parameter. The box for sewage does not overlap with any of the other flow-type box plots. The inference here is that the ammonia/potassium ratio for sewage is significantly different and could be used to distinguish sewage flows from wash-waters and all other flow types, at least at the 95% confidence level. Library data from the flow types (tap, spring, irrigation, car wash, laundry, industries and sewage) were analysed to define a suitable threshold value for each parameter to use as an indicator of illegal discharge. The library tabular data and box plots were studied in detail to select concentration values as 'indicators' of illegal discharges. The process of defining the threshold values is described extensively in Brown et al. (2004 p. J3-5). Examination of the box plots indicated that uncontaminated waters (tap and spring waters) could be distinguished from the contaminated waters (irrigation, car wash, laundry and sewage) by the following indicator parameters: detergents (anionic surfactants), fluorescence (optical brighteners), potassium, total chlorine, total hardness and turbidity. These inferences were made because the uncontaminated flow types' box plots for these parameters do not overlap with the contaminated box plots. Of these parameters, detergents and fluorescence are of much interest as they result from the use (anthropogenic) of water and are in various ways present in wastewater (sewage) and wash waters. Box plots for detergents, fluorescence, ammonia and conductivity are shown in Figs 3, 4, 5 and 6, respectively.
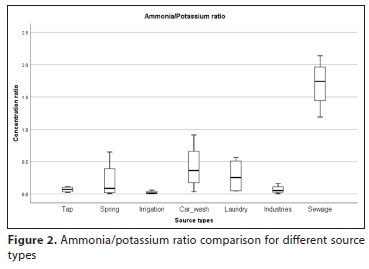


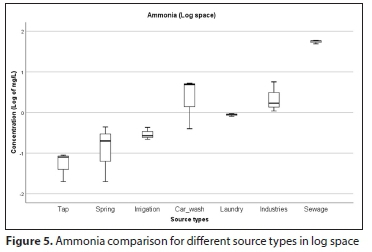
Further, among the contaminated waters, the box plots revealed that irrigation waters could be distinguished from sewage and wash-waters by ammonia and detergent (Figs 3 and 5). Wash-waters could be distinguished from sewage by ammonia, ammonia/potassium ratio and detergents. Analysis of 1-year records of raw sewage data from the CoCT, showed that ammonia/potassium ratio was always greater than 1. This observation has been noted by Pitt and Ritten-house (2001) in several studies in the US, but they could not establish such an observation for wash waters and neither could this study. It was, therefore, logical to give preference to ammonia/potassium ratio as a parameter to distinguish between sewage and wash waters.
Between the uncontaminated waters, the box plots revealed that tap water may be distinguished from spring water by the following parameters: conductivity (Fig. 6), detergents, and fluorescence. In uncontaminated waters, however, detergents and fluorescence (caused by optical brighteners) are least expected. Preference was thus given to conductivity as a parameter to distinguish between local tap and spring waters.
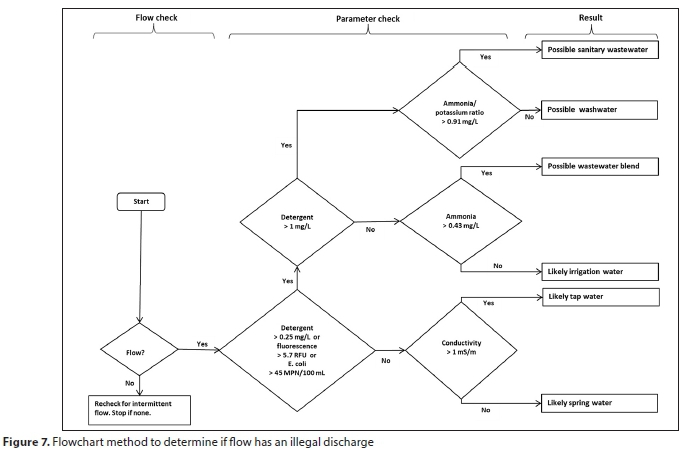
Results of threshold estimations for parameters to distinguish between different flow types are summarised in Table 2. The threshold indicators in Table 2 are based on local data from the CoCT; however, other thresholds established by other researchers such as Brown et al. (2004), CWP (2017), and Pitt and Rittenhouse (2001) are also indicated for comparison. Based on these results, a flowchart was developed (Fig. 7) as a decision-making tool or a guide for identifying illegal discharges in the City of Cape Town. The flowchart was a primary tool to isolate specific sources of illegal discharges.
Case study trackdown investigations
The results of outfall investigation (described above) identified many outfalls as 'obvious' for illegal discharges. The drainage networks connected to some of these outfalls were selected for undertaking a source tracing investigation.
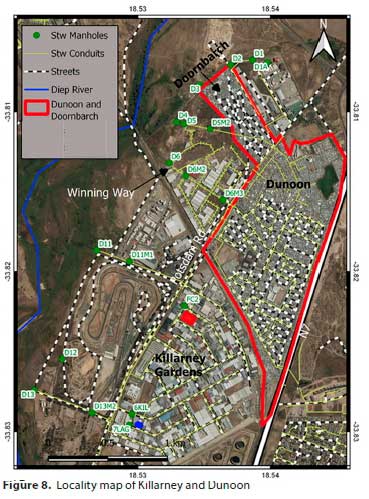
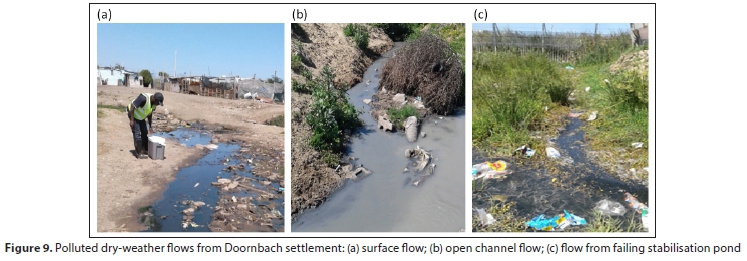
Drainage area investigation of Outfalls D1 to D6
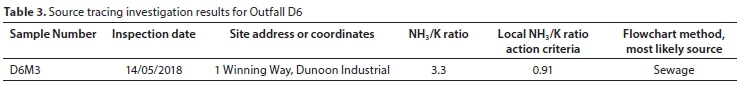
Dry weather discharges from Outfalls D1 to D6 (Fig. 8) are mainly from diffuse sources of the two informal settlements of Doornbach and Dunoon. Lack of basic water and sanitation services and poor operation and maintenance of the inadequate systems in place have contributed to litter, overflowing toilet systems and discharge of greywater onto streets (Figs 9a and b). Outfall D2 was found to be receiving discharges from a failing stabilisation pond (Fig. 9c) located within the premises of the MyCity Bus Services yard. Common observation and characteristic indicators of discharges in these areas revealed that the source type was sewage. The colour, odour, and floatables are all indicators of sewage flow. The water quality characteristics in Outfall D6 were identical to that measured in Manhole D6M3 (upstream of the industrial area), confirming the discharge originates mainly from the Dunoon settlement. Results of chemical analyses revealed high ammonia concentrations (73.4 mg/L) as well as an ammonia-potassium ratio (3.3), all exceeding the local threshold or action criteria limit (Table 2). Table 3 indicates the likely source type is sewage.
Drainage area investigation of Outfall D11
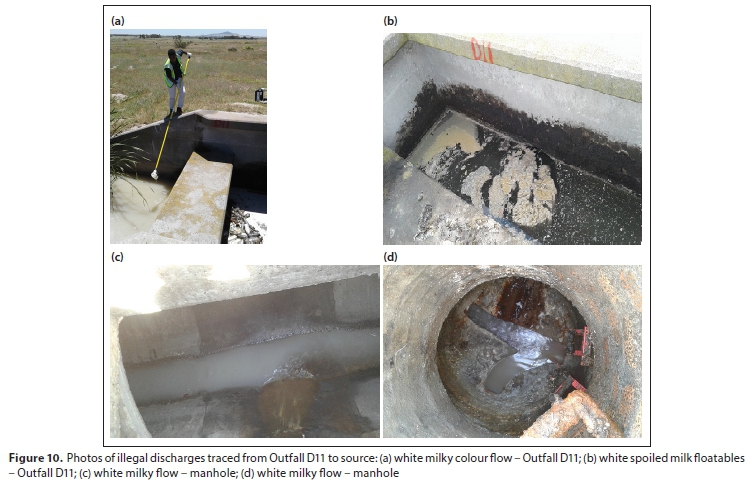
A photo of Outfall D11 is shown in Figs 10a and b. Physical indicators observed at the outfall included: white colour, spoiled milk and rancid odour, as well as spoiled milk products as floatables, and excessive vegetation. A drainage area investigation was initiated and two manholes in front of a dairy factory were inspected. A fresh white and warm (temperature = 30.4°C) discharge was observed coming from the factory premises (Figs 10c and d) to confirm the suspicion. The physical observations at the outfall matched those observed in the manholes in front of the dairy factory. The next upstream manhole from the factory was dry.
Drainage area investigation of Outfall D13
Outfall D13 (Fig. 8) has similar physical indicators as Outfall D11: white colour spoiled milk and rancid odour, as wells as spoiled milk products as floatables, and excessive vegetation. Several inspections were done in manholes around the premises of a dairy factory but most of them were dry. Manholes numbered 6KIL and 7LAG (Fig. 8) were flowing but had no physical indicators matching that of Outfall D13. It is possible that discharges take place at night and could not be identified during the daylight hours of the inspection. Manholes 6KIL and 7LAG had detergents (3.39 and 0.99 mg/L as MBAS, respectively) and fluorescence (115 and 105.9 RFU, respectively) values exceeding action criteria and indicating a washwater source type. Both manhole samples also indicated high COD values (1 040 and >2 000 mg/L, respectively). The City is advised to monitor night discharges from DF2 to confirm the physical indicators at Outfall D13 and investigate the source(s) of wash-waters observed in Manholes 6KIL and 7LAG.
Drainage area investigation of Outfall D12
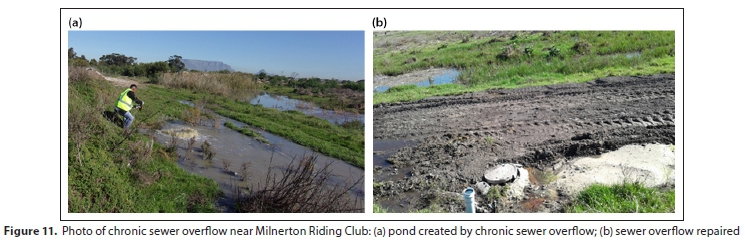
A surface flow was observed near Outfall D12; however, a review of the stormwater drainage map could not reveal any stormwater pipe or channel discharging to the proximity of the surface ponding. A drainage area investigation was initiated to find the source of the discharge to be a chronic sewer overflow (Fig. 11a), which has created a pond upstream of the outfall location. The location of the overflow is on the sewer mains from Dunoon industrial area to Potsdam Wastewater Treatment Works. The incident was reported to the City and the site was restored (Fig. 11b).
Drainage area investigation at carwash centres
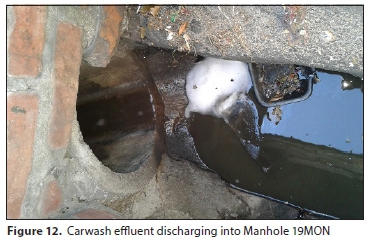
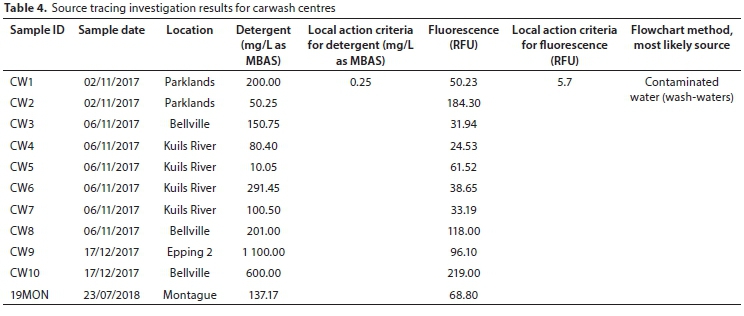
Drainage area investigations for carwash centres in Diep- and Kuils River catchments were undertaken concurrently with 'fingerprint library' monitoring for carwash flow type. During the sampling exercises, the car-wash centres' drainage infrastructures were inspected to ascertain whether the discharges were connected to the stormwater drains or sanitary sewers. For all the carwash centres visited, it was found that their discharges were routed to stormwater drainage systems (example in Fig. 12). Table 4 presents some results of detergents and fluorescence measured in comparison with local action criteria. A comprehensive strategy to clamp down on illegal connections of carwash discharges to the stormwater drainage system is required. This could include a regulatory framework such as a plumbing code that addresses illegal connections of carwash discharges to storm drains. For such an enforcement practice to be effective, the penalty must be a deterrent.
Storm drain investigation
Montague Gardens industrial area discharges through Montague channel to Outfall D20 (not shown on map). Due to the vastness of this area, the drainage network was split into segments and storm drain investigation was conducted for selected segments and manholes. Concentrations of detergent (10.23 mg/L as MBAS) and fluorescence (79.76 RFU) at Outfall D20 exceeded the action criteria and since the ammonia-potassium ratio was very small (0.03 and less than action criteria), the source type was inferred to be wash-waters and the field crew task was to look for their sources. Discussion of some of the results from the investigation are summarised as follows:
Storm drain investigation on Stella Road segment (Manhole 1STE and Inlet 27STE)
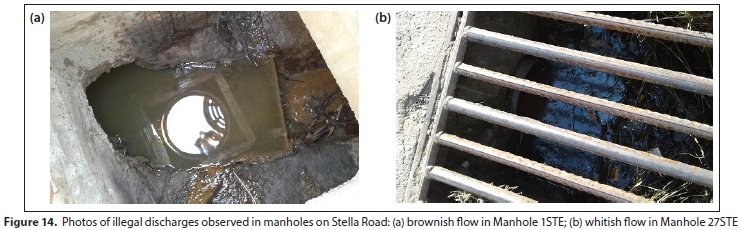
Locations of Manholes 1STE and 27STE are shown in Fig. 13. Manhole 1STE is at a junction between Stella Road and Stella Cove and the discharge observed in this manhole had a brownish-grey colouration (Fig. 14a). Inlet 27STE is in front of Unit 27 (chemical factory) on Stella Cove and a whitish discharge (Fig. 14b) was observed in the drain flowing from the factory premise. Concentrations of detergent for Manholes 1STE and 27STE are 35 and 109 mg/L as MBAS, respectively. Concentrations of fluorescence for 1STE and 27STE manholes are 168.6 and 104.4, respectively. These concentrations exceeded the established local action criteria and with low ammonia concentrations at each location, a wash-water source type was confirmed. The City is advised to conduct a site investigation to identify the culprit(s) of discharge in 1STE manhole.

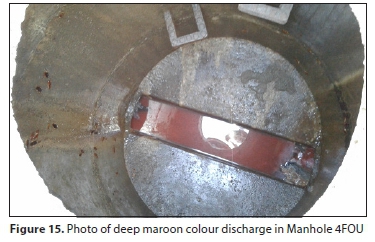
Storm drain investigation on Fourth Street segment (Manhole 4FOU)
Locations of Manholes 4FOU and 10FOU are shown in Fig. 13. Manhole 4FOU is located on 4 Fourth Street in Montague. The discharge rate was substantial and had a deep maroon colour (Fig. 15). Concentrations of detergent and fluorescence were 31.5 mg/L as MBAS and 164.32 RFU, respectively, both exceeding local action criteria limit. The source type is inferred as factory wash-water. The next upstream manhole (10FOU) had a small and clear discharge. The potential culprit may be discharging into the pipe segment between these two manholes.
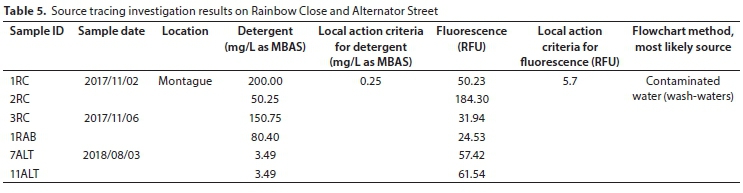
Storm drain investigation on Rainbow Close segment (Manholes 1RC, 2RC, 3RC and 1Rainbow)
These manholes are located on Rainbow Close in Montague industrial area (Fig. 13). Manhole 1RC is at the upstream part of the segment followed by 2RC, 3RC and 1Rainbow towards the downstream section. Concentrations of detergent and fluorescence (Table 5) exceed local action criteria, whereas ammonia-potassium ratios are all lower than action criteria for sanitary wastewater. Wash-water source type is inferred, and an effort must be made by the City to identify the industries responsible for the discharges.
Storm drain investigation on Drill Avenue segment (Manholes 1DRL and 2DRL)
These manholes are located on Drill Avenue in Montague industrial area (Fig. 13). Manhole 1DRL is downstream of 2DRL. During the inspection, there was a trickling flow in 1DRL whereas a white milky discharge was observed in 2DRL. Detergent and fluorescence concentrations in 2DRL are 3.49 mg/L as MBAS and 140 RFU, respectively; all exceeding the local action criteria. Further site investigation to identify the industry discharging wash-water into 2DRL manhole is recommended.
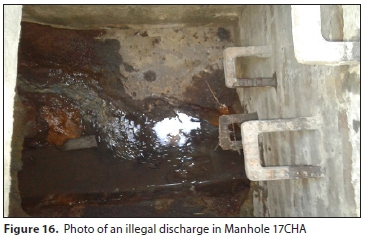
Storm drain investigation on Chain Avenue segment (Manholes 1CHA, 5CHA and 17CHA)
These manholes are located on Chain Avenue in Montague industrial area (Fig. 13). Manhole 17CHA is downstream of 1CHA whilst 5CHA is on the upstream part of the segment. Detergent and ammonia-potassium ratio in all three manholes are low but fluorescence concentration exceeds the local action criteria. The concern with discharge in 17CHA manhole (Fig. 16) is high conductivity (7.096 mS/m) and COD concentration (470 mg/L). Wash water may not be the source type, but high conductivity and COD concentrations suggest industrial discharge and must be further investigated.
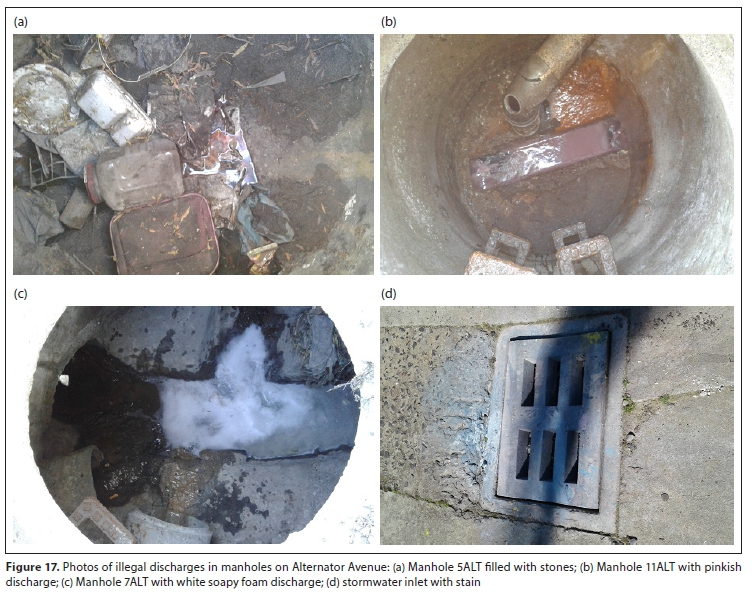
Storm drain investigation on Alternator Avenue segment (Manholes 5ALT, 7ALT and 11ALT)
These manholes are located on Alternator Avenue in Montague industrial area (Fig. 13). Manhole 5ALT is upstream followed by manholes 7ALT and 11ALT further downstream. Manhole 5ALT was blocked and filled up with stones and litter (Fig. 17a). Discharge rates of about 2.5 and 10 L/s were measured in 7ALT and 11ALT, respectively. The colour of the discharge in 11ALT was pinkish (Fig. 17b), whereas 7ALT, which was about 40 m away, upstream, had clear water flowing. A white soapy foam was observed in manhole 7ALT (Fig. 17c) and with concentrations of detergent and fluorescence exceeding local action criteria (Table 4), it was not difficult to confirm that the source type in Manhole 7ALT is wash-water. A stormwater inlet in front of Alternator Park complex connected to Manhole 7ALT indicated stains of paint (Fig. 17d) which suggest dumping has been taking place into the stormwater drainage system. The COD measured in both manholes was more than 2 000 mg/L, also confirming that the discharges are of industrial origin. The discharge source type is inferred in Table 5.
Quality control and quality assurance results
Quality control and quality assurance were imp ortant considerations for the routine analytical methodologies in this study, to safeguard precision or repeatability of analytical results. In order to enhance confidence in the study outcomes, measures were taken to ensure that results from multiple analyses of a given sample agree with each other. These measures included frequent calibration of the photometer and the use of a certified laboratory as discussed below.
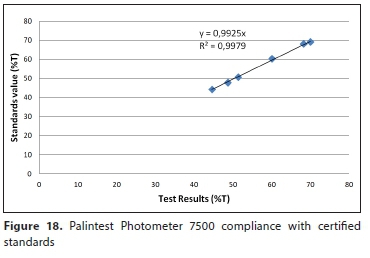
Certified standard analysis with Palintest photometer
A calibration certificate supplied with Palintest Photometer 7500 Bluetooth validates the performance of the instrument. 'Palintest Check Standards set is supplied with certified values expressed as %T (Transmission), derived from traceable reference materials. Acceptable tolerances defined on the certificate are automatically specified within the Photometer 7500 Bluetooth', (www.palintest.com). Routine validation was conducted to check standard values and measurements to ensure the instrument was operating within the defined specification and that the results were credible. Results of check standard values and measurements (Fig. 18) indicate that the Palintest photometer was capable of producing reliable results.
Comparison of results between Palintest photometer and certified laboratory
Thirty per cent of the 'fingerprint library' (i.e., 21 water samples) were analysed in duplicates using the Palintest Photometer and at a certified laboratory (Bemlab). The results are summarised in Table 6. Apart from copper and total hardness, which showed substantial differences in the results, the rest of the parameters generally showed relatively close correlations. Irvine et al. (2011), however, obtained a poor comparison between a Hanna photometer and a certified laboratory in a similar study. Recommendations by Irvine et al. (2011) to improve reliability were implemented in this study and included flagging anomalous result values and repetition in triplicate. Other photometric testing hints and tips are discussed in detail in the Palintest Photometer 7500 Bluetooth manual, which were always applied to improve the accuracy of the results. These included:
• Filtering samples with dispersed solids as they cause interference which affects the quality of the results.
• Using genuine Palintest photometer reagents (expired reagents were discarded).
• Always correcting for blank values as the colour in a sample can affect the accuracy of the result.
• Always adhering to the recommended reaction time specified in the manual for each parameter.
• Diluting samples with high concentrations before analysis.
• Calibrating/validating the photometer frequently; checking standard values and measurements using procedures described in the manual.
Limitations of the flowchart method
Limitations of the flowchart method included the following:
• Monitoring was conducted over several months as field schedules and weather allowed. Temporal variations in water quality may impact on results.
• The sample size (10) used to compile the 'fingerprint library' and subsequently to develop the flowchart technique was based on a resource-driven approach (cost, time and/or personnel constraints) and recommendations by Brown et al. (2004). Additional sampling to increase the sample size of the library is required.
• Discharges in storm drainage systems are often mixtures of different flow types; however, the mixing condition was not evaluated and considered in developing the flowchart technique. The flowchart technique would, therefore, be effective in identifying the presence and most dominant flow type. Contributions from different categories of flow types may not be identified by this technique.
• The flowchart technique was developed using local data from Cape Town. Use of the flowchart outside Cape Town may result in 'false positives' or 'false negatives'.
CONCLUSIONS AND RECOMMENDATIONS
As population, urbanisation and industrialisation continue and pollution problems increase amidst climate change impacts on water availability, illegal discharges will move further into the spotlight of environmental, water and sanitation regulators in the developing world. Enforcement and public awareness campaigns will be critical components of local government's plans to affect changes in human behaviours and practices that lead to many illegal discharges. Local governments and national regulatory institutions need to appreciate the importance of an illegal discharge detection and elimination programme as a non-structural best management practice (BMP) to meet resource water quality objectives and the requirements for ecosystem sustainability. The study reviewed methodologies and techniques of IDDE programme components as practised internationally and applied these to local conditions to verify their feasibilities and challenges. Methodologies and techniques for identification, detection and monitoring of illegal discharges were evaluated successfully in the Diep River case study catchment. The paper contains useful information to guide municipalities to develop and implement local investigations of illegal discharges into stormwater drainage systems. A flowchart method was developed for the Cape Town locality to determine the most likely flow type for the dry weather flows observed at the outfalls (or anywhere in the stormwater drainage system) as an illegal discharge. A flowchart method is a primary tool to detect and to assist with the isolation of specific sources of illegal discharges. The findings of the report support the notion that illegal discharges contribute significantly to pollutant loads to receiving waters in Cape Town and require urgent intervention. Challenges encountered in the study include lack of legal authority to undertake inspection, surveillance and monitoring at private and corporate properties and to undertake requisite enforcement measures to remove sources of illegal discharges.
The following recommendations are made: (i) local governments should include in their stormwater management plan a control measure for an illegal discharge detection and elimination (IDDE) programme; (ii) similar research studies in different municipalities across the country are recommended; (iii) more work is needed to better quantify the pollutant removal intervention and costs associated with correction of illegal discharges, to evaluate the effectiveness of proactive prevention strategies (e.g. inspection of laterals) that rely on systematic inspections of the system rather than on only outfall monitoring, and to develop improved strategies for tracking down and eliminating these discharges.
ACKNOWLEDGEMENTS
The author gratefully acknowledges assistance from:
• The Water Research Commission, Pretoria, South Africa (WRC Project No. K5/2600//3).
• Cape Peninsula University of Technology (University Research Fund).
• Intern students from CPUT who contributed to the research effort in various ways are thanked: Sivuyile Nkata, Famous George Kato, Kholekile Somtsewu, Cynthia Onyeaka and Xolisa Fumba assisted in different phases of field inspections and sampling; Alex Kuhudzai assisted on map preparations.
ORCID
Yaw Owusu-Asante
https://orcid.org/0000-0002-4023-8529
REFERENCES
BROWN E, CARACO D and PITT R (2004) Illicit discharge detection and elimination: a guidance manual for program development and technical assessments. Center for Watershed Protection and University of Alabama. EPA X-82907801-0. USEPA Office of Wastewater Management, Washington, D.C. [ Links ]
CWP (Centre for Watershed Protection) (2010) IDDE monitoring in Baltimore Watersheds. Technical Memorandum.https://owl.cwp.org/mdocs-posts/cwp_2010_idde_monitoring/ (Accessed June 2017). [ Links ]
CWP (Centre for Watershed Protection) (2017) Illicit discharge detection and elimination field guide for the coastal plain: Hampton Roads Planning District Commission MS4 Communities. April 2017. [ Links ]
CHANDLER DM and LERNER DN (2015) A low cost method to detect polluted surface water outfalls and misconnected drainage. Water Environ. J. 29 202-206. https://doi.org/10.1111/wej.12112 [ Links ]
DWAF (Department of Water Affairs and Forestry, South Africa) (1996) South African Water Quality Guidelines, 2nd edition. Vol. 7. Aquatic ecosystems. DWAF, Pretoria. [ Links ]
IRVINE K, ROSSI MC, VERMETTE S, BAKERT J and KLEINFELDER K (2011) Illicit discharge detection and elimination: Low cost options for source identification and trackdown in stormwater systems. Urban Water J. 8 (6) 379-395. https://doi.org/10.1080/1573062X.2011.630095 [ Links ]
NEL N, PARKER A and SILBERNAGL P (2015) Improving water quality in stormwater & river systems: an approach for determining resources. J. S. Afr. Inst. Civ. Eng. 55 (1) 22-35. [ Links ]
OWUSU-ASANTE Y (2019) Analysis and determination of optimum risk factors to prioritize illegal discharge potential in urban catchments. Phys. Chem. Earth A/B/C. 111 86-99. https://doi.org/10.1016/j.pce.2019.04.007. [ Links ]
PANASIUK O, HEDSTROM A, ASHLEY RM, and VIKLANDER M (2016) Detection of wastewater discharges into stormwater sewers: Effects of travel distance on parameters. J. Environ. Eng. 142 (5) 04016016. https://doi.org/10.1061/(ASCE)EE.1943-7870.0001086 [ Links ]
PANASIUK O, HEDSTROM A, MARSALEK J, ASHLEY RM, and VIKLANDER M (2015) Contamination of stormwater by wastewater: A review of detection methods. J. Environ. Manage. l52 241-250. https://doi.org/10.1016/j.jenvman.2015.01.050 [ Links ]
PITT R and RITTENHOUSE B (2001) Methods for detection of inappropriate discharges to storm drainage systems - background literature and summary of findings. USEPA, Washington, D.C. [ Links ]
PITT R, LALOR M, FIELD R, ADRIAN DD and BARBE D (1993) A user's guide for the assessment of non-stormwater discharges into separate storm drainage systems. United States Environmental Protection Agency, Storm and Combined Sewer Program, Risk. USEPA, Washington DC. [ Links ]
RHP (River Health Programme) (2005) State of Rivers Report: Greater Cape Town's Rivers. Department of Water Affairs and Forestry, Pretoria. ISBN No: 0-620-34026-6. [ Links ]
RSA (Republic of South Africa (1998) National Water Act, Act No. 36 of 1998. Government Gazette. 19182. Government Printer, Cape Town. [ Links ]
 Correspondence:
Yaw Owusu-Asante
Email: Owusu-asantey@cput.ac.za
Received: 15 April 2020
Accepted: 22 March 2020

