


Services on Demand
Article
 English (pdf)
 Article in xml format
 Article references
Indicators

Related links
-
 Cited by Google
 -
 Similars in Google
Share

 Permalink
Water SA
On-line version ISSN 1816-7950
Print version ISSN 0378-4738
Water SA vol.47 n.2 Pretoria Apr. 2021
http://dx.doi.org/10.17159/wsa/2021.v47.i2.10918
RESEARCH PAPER
Temporal and spatial variations of organochlorine pesticides (OCPs) and phthalates affecting the quality of water and sediment from Loskop Dam, South Africa
Mathapelo P SeopelaI, *; Robert I McCrindleI; Sandra CombrinckII; Wilma AugustynI
IDepartment of Chemistry, Tshwane University of Technology, Private Bag X680, Pretoria 0001, Gauteng, South Africa
IIDepartment of Pharmaceutical Sciences, Tshwane University of Technology, Private Bag X680, Pretoria 0001, Gauteng, South Africa
ABSTRACT
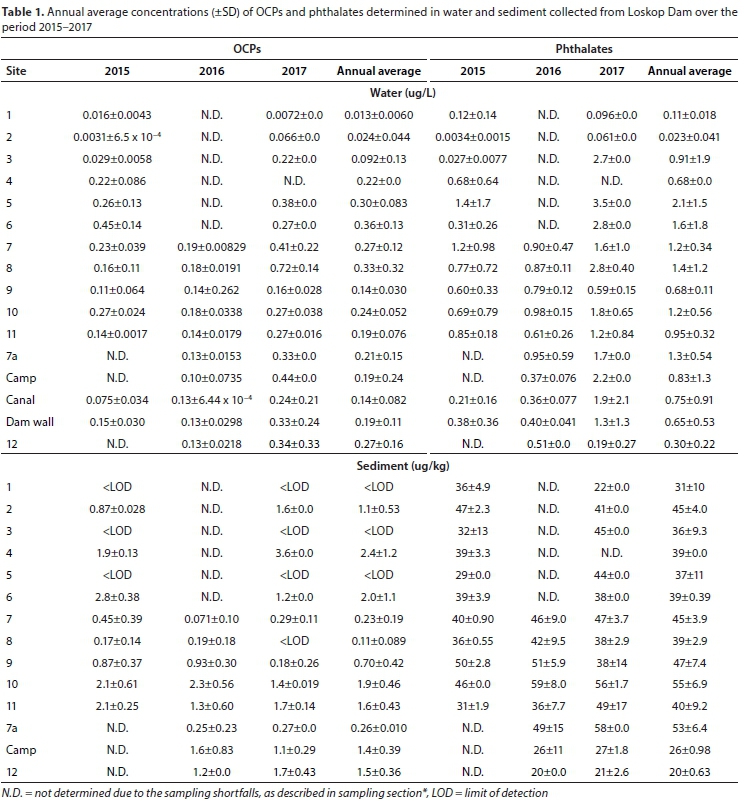
Organochlorine pesticides (OCPs) and phthalates are amongst the most emphasized man-made environmental contaminants, due to their prevalence, persistence and potential to induce adverse effects in organisms. In addition to prevailing industrial and domestic activities, their presence in the environment is exacerbated by leaching from associated materials, run-off and emissions. The Loskop Dam in the Mpumalanga Province, South Africa, is located on the Olifants River, which flows through a hub of industrial and agricultural activities. Research aimed at monitoring the levels of OCPs and phthalate contamination in South Africa, particularly in the Olifants catchment, has been limited and is restricted to short-term monitoring. In this study, the spatial and temporal variations of 21 OCPs and 7 phthalates in water and sediments from Loskop Dam were evaluated over a 3-year period (2015-2017). Annual average OCP levels ranged from 0.013±0.006 to 0.36±0.13 μg/L in water and from below the limit of detection to 2.4±1.2 μg/kg in sediments. Phthalates were present at average concentrations ranging from 0.023±0.041 to 2.1±1.5 μg/L and 20±0.63 to 55±6.9 μg/kg in water and sediments, respectively. The levels of OCPs and phthalates were greatest in autumn, attributed to higher input sources and concentration effects due to lower water levels. Phthalates were present at greater quantities at the inlet, while OCP accumulation was observed at the upper reaches of the dam. This may be an indication of the differences in input sources and translocation of these compounds, related to the topography of the dam and variability in water flow rates. These findings are important in highlighting the environmental and health concerns that may arise in the Olifants catchment area. After considering the outcomes of this study, we propose the implementation of regular and stringent monitoring strategies, which include surveys of OCPs and phthalates for Loskop Dam and similar water systems globally.
Keywords: OCPs; phthalates; monitoring; Loskop Dam; water quality
INTRODUCTION
Organic compounds, including OCPs and phthalates, are products of human activities and are associated with environmental contamination. Their presence spans the atmosphere, soils, sediment and aquatic systems, where they been found to have carcinogenic, teratogenic and/or mutagenic effects on organisms (USEPA, 2012; ECHA, 2018; UNEP, 2018). Global concerns regarding the presence of organic pollutants have resulted in the establishment of regulations to safeguard the environment and humans against exposure. These include the United States Environmental Protection Agency priority lists (USEPA, 2012; ECHA, 2018), as well as the United Nations Environmental Programme (UNEP), which established the Stockholm Convention on Persistent Organic Pollutants (POPs) (UNEP, 2018). The framework provided by these treaties aims to monitor, regulate the production, use and trade of these potential pollutants. Socio-economic disparities, high variability in water quality, and a lack of long-term monitoring and mitigation strategies, remain at the heart of environmental challenges in developing countries.
To date, approximately 500 pesticide trade names have been registered and 180 active ingredients are commercially available in South Africa for agricultural use (Quinn et al., 2011; WRC, 2015). A variety of organochlorine (OCPs) and organophosphorus (OPPs) pesticides, including benzene hexachloride, DDT, DDD, DDE, dieldrin, endosulfan, endrin, atrazine and their derivatives (Ansara-Ross et al., 2012), have been detected in environmental matrices, including, soils, water and in organisms in South Africa (Quinn et al., 2011). These compounds have been reported to induce neurotoxic effects in organisms (USEPA, 2012; ECHA, 2018; UNEP, 2018). The heavy reliance on OCPs, currently and historically, to enhance agricultural production and as a vector method for disease control, has exacerbated their presence in, and impact on, the environment (Gerber et al., 2016; Moja et al., 2017; UNEP, 2018). Ansara-Ross et al. (2012) provides a chronological account of pesticide use in South Africa and noted that fewer than 50 studies on environmental contamination by OCPs had been conducted in South Africa by 2012. These ranged from the initial use of plant-based OCPs, transitioning to synthetic compounds, including DDT in the 1940s, and finally to more labile alternative products (Quinn et al., 2011). During the period 1974 to 1989, the levels of OCPs reported in South Africa ranged between 0.06 and 4,146 μg/L in water collected from rivers and dams (Quinn et al., 2011; Ansara-Ross et al., 2012). Tissue and fat from fish collected in these water systems contained up to 14.670 μg/kg of total OCPs. In recent studies, bioaccumulation, trophic level transfer and increases in the levels of these compounds in South African aquatic systems have been demonstrated (Gerber et al., 2016; Moja et al., 2017).
Their widespread distribution is facilitated by their persistence, ability to volatilise and infiltrate the environment, directly into aquatic systems, or indirectly via run-off from soils (UNEP, 2018).
Similarly, a few studies (Adeniyi et al., 2008; Fatoki et al., 2010; Sibali et al., 2013) have determined the levels of phthalates in aquatic systems in South Africa. These compounds are used as additives in a wide range of polymeric materials (USEPA, 2012; Sun et al., 2016; Yang et al., 2019). Sibali et al. (2013) found that the levels of phthalates ranged from 40 to 100 μg/L in water and 0.10 to 4,910 ng/g in sediment from the Juskei River catchment area (Gauteng Province). These concentrations were much lower than those determined by Fatoki et al. (2010) in rivers and dams in the Venda region (Limpopo Province), where phthalate levels ranged from 160 to 10 200 μg/L and 20 to 890 ng/g in water and sediment, respectively. In both studies, the presence of these compounds was attributed to run-off from industrial processes and effluents, and household waste. Furthermore, the levels of phthalates detected in water were greater than the recommended maximum stipulated by the USEPA (3 μg/L), and higher than that reported for other water bodies, including the Ori Stream in Nigeria (1.29-938 μg/L) (Olutona and Dawodo, 2016), and the Asian Lake in Korea (below limit of detection (LOD) - 2.29 μg/L) (Lee et al., 2019).
Several studies have demonstrated the influence of wastewater treatment plants (WWTPs) on the environmental fate of phthalates, specifically in South African freshwater systems (Olujimi et al., 2012; Salaudeen et al., 2018). Results showed that phthalates are not sufficiently removed during water treatment. Direct and indirect exposure to phthalates, even at low concentrations, can delay the development of children and reduce the fertility of humans and animals (USEPA, 2012; ECHA, 2018). Currently, carcinogenicity and endocrine disruption by phthalates have been attributed to six compounds, including dimethyl phthalate (DMP), butyl benzyl phthalate (BBP), diethyl phthalate (DEP), di-«-butyl phthalate (dBP), di(2-ethylhexyl) phthalate (DEHP) and di-«-octyl phthalate (DOP) (USEPA, 2012; ECHA, 2018).
The presence of organic pollutants in South African water systems has had detrimental effects on organisms (Huchzermeyer et al., 2013; Seopela et al., 2016), resulting in a decline in aquatic organism populations in economically significant water bodies. The lack of information and sustainable and long-term monitoring of the quality of South African water bodies is concerning, particularly in relation to OCP and phthalate levels. The health impacts resulting from the presence of these compounds has been established in other regions and deserves equal attention. This important gap was flagged by a report by the Water Research Commission (WRC, 2015), as well as in reviews by Olujimi et al. (2010) and Ansara-Ross et al. (2012), which pointed out that the South African Water Quality Guidelines lacked sufficient information on OCPs and phthalates.
As a case study, the Loskop Dam, on the Olifants River (Mpumalanga, South Africa), was selected. This water body is located in the vicinity of agricultural and industrial activities, as well as human settlements, making it a basin for contamination. Sporadic crocodile and fish deaths, which remain unexplained, have occurred in this water body (Huchzermeyer et al., 2013). Previous studies have demonstrated that anthropogenic input is the key driver of contamination in the entire Olifants catchment area (Gerber et al., 2016; Seopela et al., 2016; Moja et al 2017). In this study, spatial and temporal variations in OCPs and phthalates in water and sediment from the Loskop Dam were evaluated to determine their contribution to the contamination of this water body. This information could shed light on the advent of mass mortalities recorded in this water system, but also guide regulatory bodies to enforce stringent water quality regulations.
MATERIALS AND METHODS
Standard solutions
The EPA 608 pesticides mix (Supelco, Sigma-Aldrich, USA), 1 x 1 mL in hexane:toluene (1:1), containing 20 μg/mL each of γ-lindane (γ-HCH), a-1,2,3,4,5,6-hexachlorocyclohexane (α-HCH), ß-hexachlorocyclohexane (β-HCH), δ-hexachlor-ocyclohexane (δ-HCH), heptachlor, aldrin, heptachlor exo-epoxide, a-endosulfan, 4,4'-DDE, dieldrin, endrin, 4,4'-DDD, β-endosulfan, 4,4'-DDT, endrin aldehyde and endosulfan sulfate, a 500 μg/mL chlordane mixture of isomers in methanol, the Pestanal 100 mg methoxychlor standard, as well as the EPA 506 phthalate mix (Supelco, Sigma-Aldrich, USA) 1 x 1 mL in isooctane, comprising 1.00 mg/mL each of dimethyl phthalate, diethyl phthalate, di-n-butyl phthalate, benzyl butyl phthalate, bis-2-ethylhexyl adipate (diisoctyl adipate), bis(2-ethylhexyl) phthalate (diisoctyl phthalate) and di-«-octyl phthalate, were used to prepare calibration standards. Stock solutions were prepared fresh in dichloromethane (DCM, Thembane Chemicals, RSA).
Sampling area
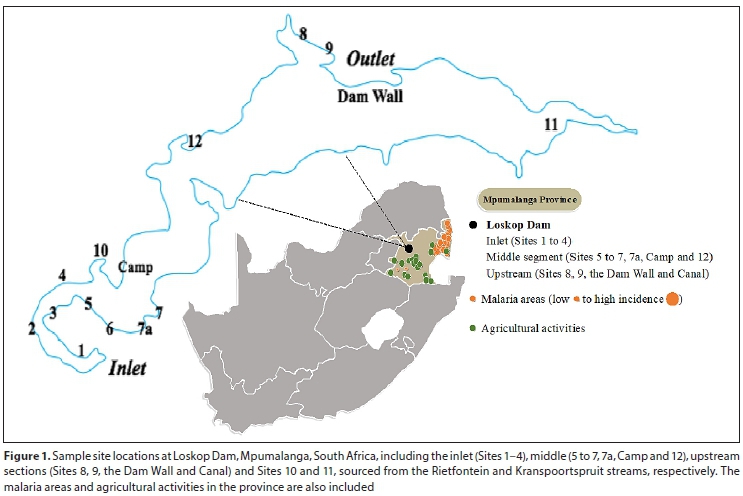
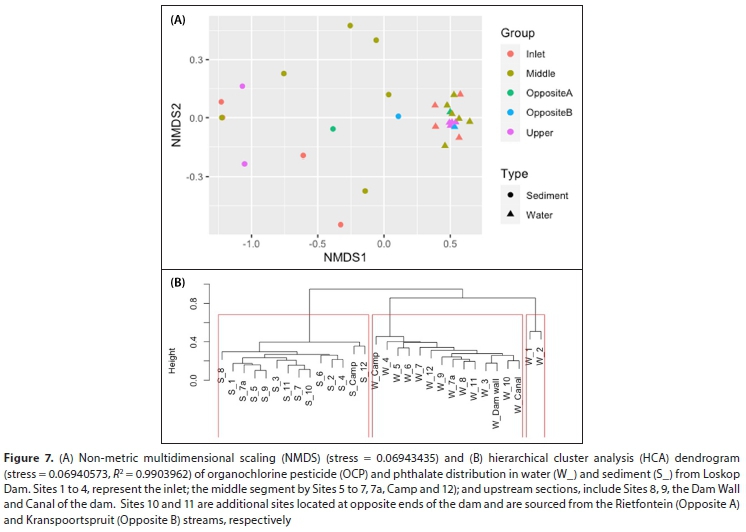
Eight sampling excursions were conducted twice in 2015 and three times a year, between May 2016 and May 2017, including winter, autumn and summer. The sampling sites were selected, as described by Seopela et al. (2020), to represent the inlet (Sites 1 to 4), middle segment (Sites 5 to 7, 7a, Camp and 12), and upstream sections (Sites 8, 9, the Dam Wall and Canal) of the dam. Sites 10 and 11 are additional sites located at opposite ends of the dam and are sourced from the Rietfontein and Kranspoortspruit streams, respectively. The location of sampling sites is indicated in Fig. 1. Access to sampling Sites 1 to 6 was not possible in 2016 due to low water levels (<50%), as a result of the most severe drought conditions experienced in South Africa for almost 70 years (DWS, 2017). Sites 12, Camp and 7a, were added to supplement this shortfall.
Sample collection and preservation
The sample collection and preservation methods applied were as described by Seopela et al. (2020). A total of three water and sediment samples were collected at each site. Water samples were collected in solvent-rinsed (acetone and hexane) 2.5 L amber bottles and extracted within a week of collection. Sediments, collected using an auger (20 x 10 cm), were frozen individually at -80°C in Ziplock bags, freeze-dried, and sieved to < 250 μm prior to extraction.
Extraction of OCPs and phthalates from water and sediment
Water samples were extracted by liquid-liquid extraction (LLE), in accordance with EPA Method 3510 using the 8000 series methods for the extraction of organic pollutants, including OCPs and phthalates. The microwave-assisted extraction (MAE) procedure reported by Seopela et al. (2016) and previously optimised for PAH extraction, was applied with some modifications. These modifications were in accordance with EPA Methods 3500 and 3546. Sample clean-up included sulfur and water removal, with the aid of pre-cleaned activated copper and drying over anhydrous Na2SO4, respectively, as described in Method 3660B. The extract was collected in a 4 mL amber vial, evaporated to dryness under a gentle stream of nitrogen, and reconstituted to 1.00 mL with DCM. A vortex was used to re-suspend and thoroughly mix the contents. The resulting solution was transferred to a 1.5 mL amber autosampler vial prior to analysis. Samples were extracted in triplicate.
Chromatographic and quantitative analysis
An Agilent 7890 series GC, fitted with a triple-axis quadrupole mass spectrometer (GC-MS), operated in the electron impact mode, was used for quantification of OCPs and phthalates. The instrument conditions are available in the Appendix. Quality control (QC) measures to validate the extraction procedures for the target analytes from water and sediment were in accordance with EPA Method 3500. Water samples were spiked with the target analytes, while PAH, PCBs and Pesticides on Sediment certified reference material (CNS391-50G CRM; Supelco, Sigma-Aldrich, USA) was used to test the robustness of the sediment extraction procedure. The complete methods are outlined in the Appendix.
Data analysis
Data analysis and statistical evaluations were computed with Excel (2017) and R-Studio (2019). All statistical analyses are reported at the 95% confidence interval. The linearity of calibration data was assessed by applying the regression analysis model in the Analysis Toolpak of Excel. The resulting least square estimates were used to calculate the limits of detection and quantification (LOD and LOQ) (Miller and Miller, 2010; Shrivastava and Gupta, 2011). Data were further subjected to analysis of variance (ANOVA), descriptive statistics, correlation plots and multivariate methods. The extraction methods for water and sediment were verified by calculating the recoveries of the target compounds.
RESULTS AND DISCUSSION
Chromatogram processing
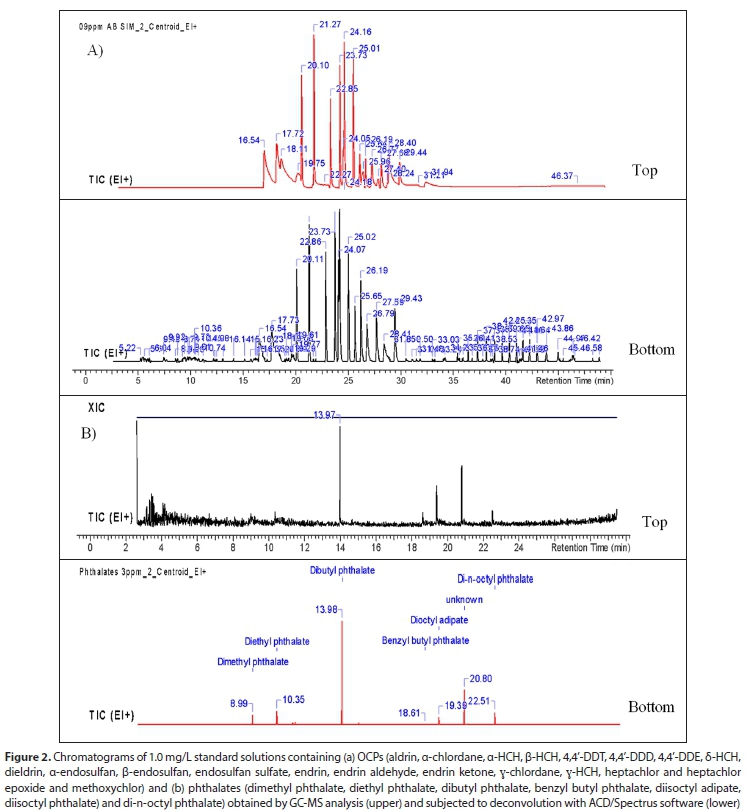
Chromatograms obtained from Agilent Chemstation were subjected to additional processing and visualisation with ACD/ Spectrus Processor software (2017). This was carried out to improve the instrument baseline and peak resolution, as well as to ensure positive analyte identification and quantification. For integration, the signal/noise (S/N) ratio and peak height were kept constant at 12 and 0.05%, respectively. Peak areas were converted and reported in abundance/ms. Additional peak processing, which included deconvolution, smoothing and reconstruction, were carried out with the Isoblend and Biller-Biemann algorithms (Biller and Biemann, 1974) in ACD/Spectrus. These improve chromatographic data, particularly for complex mixtures where spectral overlaps are common (Colby, 1992; Behrends et al., 2011). An example of the chromatograms, obtained from 1.0 mg/L standard solutions containing target OCPs and phthalates subjected to this transformation, is illustrated in Fig. 2. Improvement resulted in a reduction of background noise and flattened baselines, devoid of temperature gradient effects. This procedure also improved the resolution between target analytes and matrix components, particularly those present at low concentrations.
Calibration and method validation
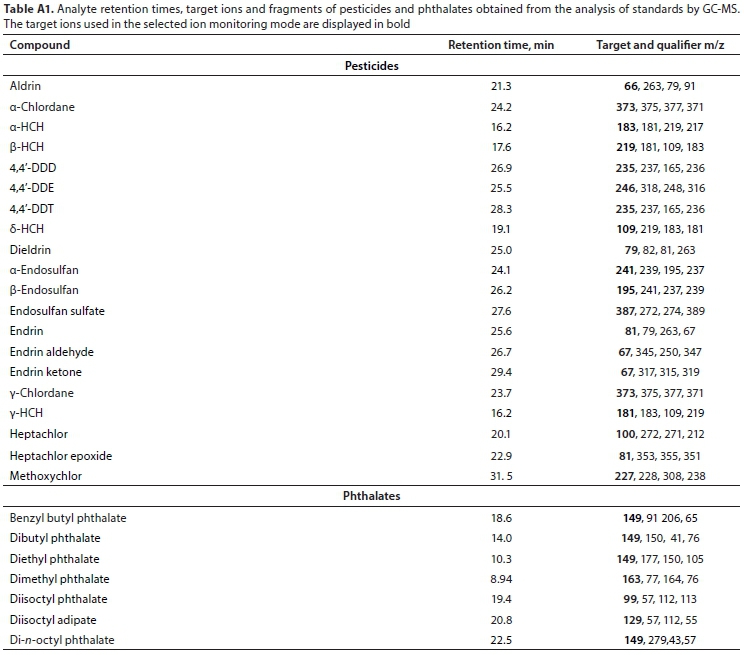
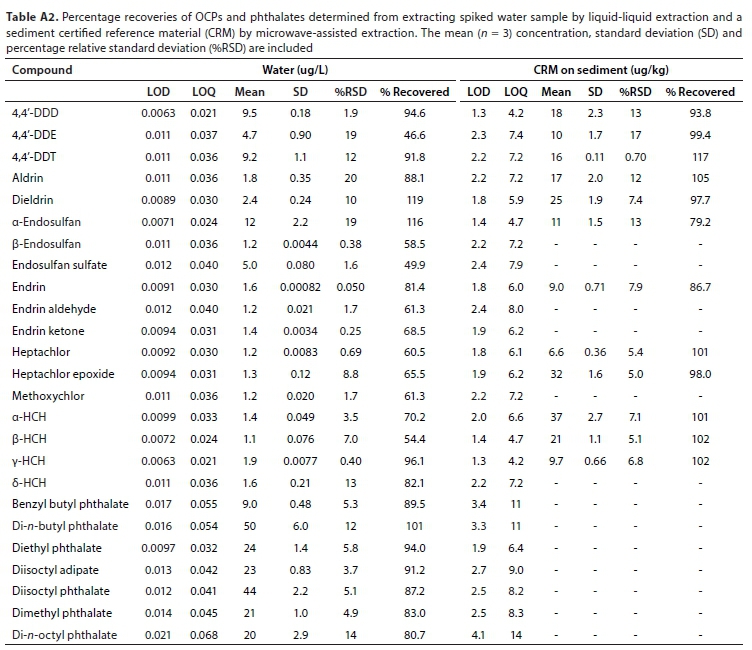
External calibrations, comprising of 15 standards for each compound, ranged from 0.080 to 50 μg/L and were used to quantify target analytes. The calibration curve correlation coefficients (R2 > 0.99), retention times, qualifier and target ions for these compounds are included in the Appendix (Table A1, Appendix). The limits of detection (LOD) for OCPs and phthalates in water and sediment ranged from 0.0063-0.021 μg/L and 1.3-4.1 μg/kg, respectively (Table A2, Appendix). For quantification, the corresponding LOQ values ranged from 0.021 to 0.068 μg/L in water and 4.2-14 μg/kg in sediment (Table A2). These values were comparable to those obtained in other studies involving quantitative determination of these compounds using GC methods (Sibali et al., 2013; Moja et al., 2013; Net et al., 2015).
On average, pesticide recoveries ranged from 46.6 to 119%, while the recoveries of phthalates were higher, ranging from 80.7 to 101% (Table A2) in water. The poorest recovery was obtained for 4,4'-DDE. This was surprising, since it was expected, as outlined by EPA guidelines (Method 8081B), that DDT and endrin were the most likely to degrade in the GC inlet. Nonetheless, it was accepted that the general recoveries were sufficient for describing the overall environment and complexity of target compound groups. The ability of LLE to extract the majority of OCPs and phthalates with good precision (Table A2), without altering the sample matrix, made it the most suitable technique to extract these compounds from water (Net et al., 2015). In addition, the recoveries obtained were comparable to those determined by previous studies (Sibali et al., 2013; Net et al., 2015; Zhao et al., 2019). The recoveries determined for the target compounds in the CRM, ranged from 79.2 to 117% (Table A2), and were within the predicted and certified confidence intervals as per the certificate of analysis.
Distribution of OCPs in water and sediment
The total pesticide concentrations in water from Loskop Dam ranged from 0.77 to 46 μg/L, and sites averaged between 0.039 and 0.65 μg/L (Table 1), with their concentrations increasing from the inlet to the upper reaches of the dam. This demonstrates that the Loskop Dam acts as a filter for contaminants entering the aquatic body from the narrow inlet, toward the upper segment. The concentrations of OCPs detected in Loskop Dam water were lower or comparable to those reported for other South African freshwater systems, which ranged from <0.006 to 1 500 μg/L (Fatoki and Awofolu, 2004; Ansara-Ross et al., 2012). However, these concentrations are far lower than those in highly urbanised and industrialised regions of Gauteng Province, where these compounds have been reported at concentrations of between 0.06 and 3 086 μg/L (Sibali et al., 2008). Globally, OCP levels range from 0.0478-0.143 μg/L in Dianshan Lake, Shanghai, China (Yang et al. 2019), <0.08 to 1 480 ng/L in the Yongding River Basin, China (Wang et al., 2018), 0.12 to 26.28 ng/L in the Nuble River in Chile (Montory et al., 2017) and from 2.89 to 128 ng/L in water from River Ravi, Pakistan (Baqar et al 2018). These were lower than those detected in water from Loskop Dam.
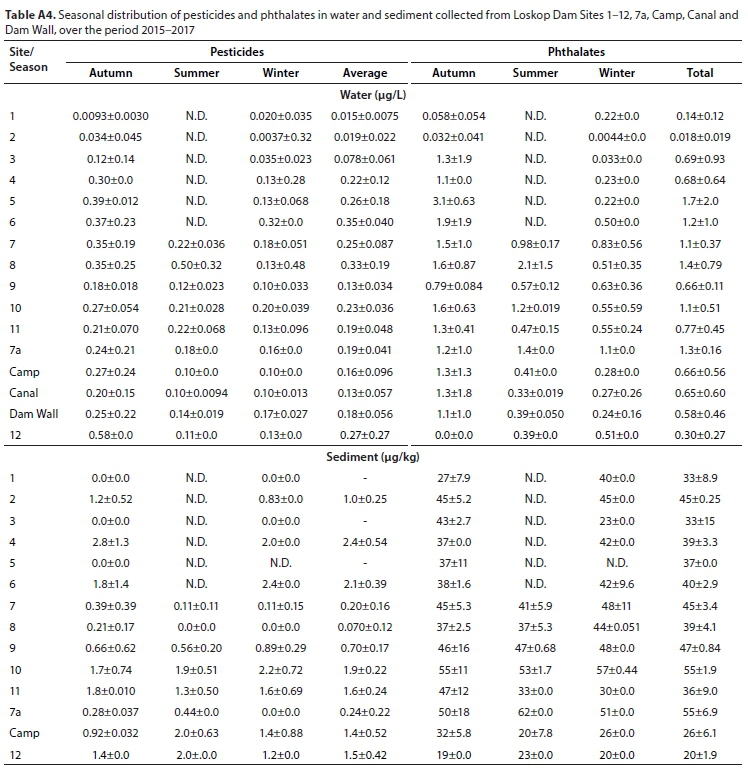
The seasonal distribution of OCPs was such that, on average, their concentrations were 0.24, 0.21 and 0.130 μg/L, in autumn, summer and winter, respectively (Table A2). Furthermore, the seasonal changes were also expected, since these correlate with increases and/or decreases in water levels, variations in climatic conditions, which may be exacerbated by run-off, as well as differences in anthropogenic activities (Montory et al., 2017; Baqar et al., 2018; Wang et al., 2018). Moja et al. (2017) found that the site closest to Loskop Dam, namely Waterval, demonstrated seasonal variability in pesticide levels. Similar temporal and spatial observations have also been made in other water bodies (Montory et al., 2017; Baqar et al., 2018; Wang et al., 2018).
The average individual compound concentrations followed the order α-chlordane < γ-chlordane < endosulfan sulfate < ß-HCH < α-HCH < 4,4'-DDD < methoxychlor < 4,4'-DDE < aldrin < β-endosulfan < δ-HCH < α-endosulfan < heptachlor < 4,4'-DDT < dieldrin < endrin < endrin aldehyde < heptachlor epoxide < endrin ketone (Fig. 3). The individual compound concentrations were lower than those set out by the South African and the World Health Organisation water quality guidelines, which range from 0.003 to 20.0 μg/L (London et al., 2005). Statistical analysis (two-factor ANOVA without replication) indicated that a significant difference in site- (p = 1.5 x 10⁻⁵) and compound-specific (p = 9.0 x 10⁻³) concentrations existed. Earlier research conducted by Van Dyk and Greef (1977), specifically at Loskop Dam, found that endosulfans were the predominant OCPs, with concentrations ranging from 10 to 4 146 μg/L, while they averaged 0.15 μg/L in the current study. This indicates a significant reduction in the presence of these compounds in water since 1977. More recently, Moja et al. (2017) found that, on average, heptachlor and endrin were the predominant compounds at the Waterval site in the Olifants Water Management Area, closest to Loskop Dam. The difference observed between the present study and the findings of Van Dyk and Greef (1977), as well as Moja et al. (2017), may be as a result of spatio-temporal variations and variations in input sources.
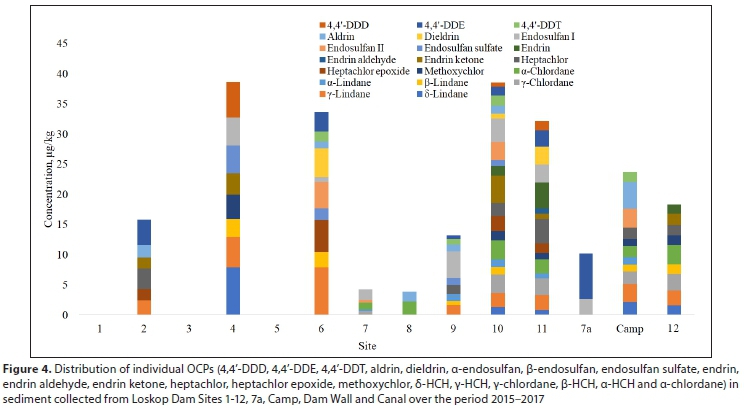
With the exception of Sites 1, 3 and 5, OCPs were detected in sediment at average concentrations of 0.95 μg/kg and a total of 1 300 μg/kg across all sites, over the entire study period (Table 1). The differences in pesticide levels between sites were significant (α = 0.05) p > α and F > Fcrit, and were attributed to fluctuations in individual compounds. While the levels at the inlet may be attributed to transportation of contaminants via inflow from the Olifants River, those observed at Camp and Site 12 correlated with those from Sites 10 and 11 (p > 0.05, F < Fcrit) in all years. This similarity was more pronounced for Site 10 and the Camp site, since individual compounds, including 4,4'-DDT, endrin, aldrin, β-endosulfan, endrin ketone, heptachlor, γ-HCH, β-HCH and δ-HCH, were detected at comparable levels (Fig. 4). These findings are consistent with the review by Olisah et al. (2020), who deduced that the most persistent OCPs in African environmental compartments included α-HCH and γ-HCH, as well as DDTs and endosulfans.
Sediment from Sites 2, 4, 6, 7, 7a, Camp and Site 12, were identified as the most contaminated. The increase in concentrations from Sites 2 to 4, followed by a decrease from Sites 6 to 7, demonstrates that prevailing physicochemical interactions hinder the translocation of these compounds further into the dam. These levels are comparable to those detected in Olifants River sediment by Gerber et al. (2016). They reported that compounds reached a maximum of 0.24 and 0.74 ng/g during low- and high-flow periods in 2010 and 2011, respectively. Similarly, Moja et al. (2017) found that water from this region contained OCPs, including aldrin, heptachlor epoxide, endrin, as well as α-endosulfan and β-endosulfan, within the same concentration range. However, in both studies, the most prevalent compounds differed. Sediments were found to contain a higher proportion of DDTs, while water was dominated by aldrin, averaging 0.730 ng/g and 0.834 μg/L, respectively (Moja et al., 2017). This is further evidence of the impact of flow on the interactions between environmental matrices and contaminants.
With the exception of Site 10, the Camp and Site 12, OCP profiles in sediment from Loskop Dam were more pronounced in the cooler months than in summer (Table A2). The average pesticide levels followed the order autumn > winter > summer, at average concentrations of 0.85, 0.75 and 0.26 μg/kg, respectively. This may imply that the low water levels in the main water body during the dry seasons contribute to their concentration effects. This is further supported by the results from Gerber et al. (2016), who found higher OCP levels during low water flow. Verhaert et al. (2017) found that sediment in the water body to the north of Loskop Dam, Flag Boshielo, contained higher concentrations of OCPs in winter than in summer. This corresponds to the general observations made at Loskop Dam. However, they found DDTs in the range <LOQ to 4.3 μg/kg (Verhaert et al., 2017), while those determined in this study were lower (0.42-1.1 μg/kg). This indicates that contamination of Loskop Dam is low, which may be related to regulatory restrictions on DDT, but also that agricultural run-off into dam systems is a cause for concern, since Flag Boshielo is in the vicinity of agricultural activities.
Source apportionment of OCPs in water and sediment
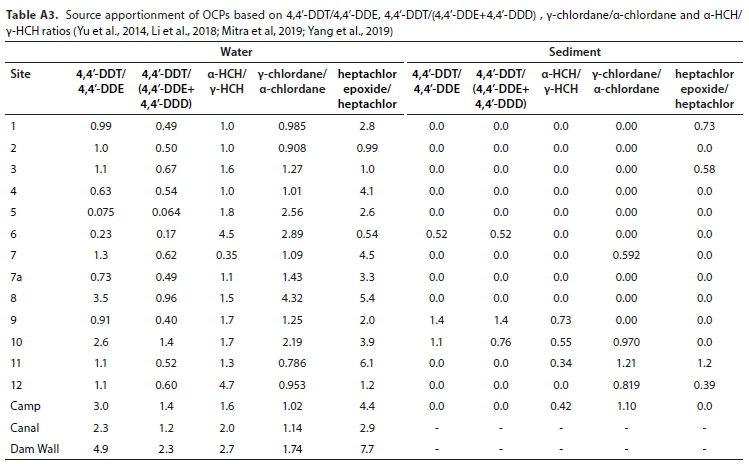
To differentiate between the recent and historic application of OCPs,the ratios of4,4'-DDT/4,4'-DDE, 4,4'-DDT/(4,4'-DDE+4,4'-DDD), α-HCH/y-HCH, γ-chlordane/a-chlordane and heptachlor epoxide/heptachlor, were employed (Yu et al., 2014, Li et al., 2018; Zhao et al., 2018; Yang et al., 2019) (Table A3, Appendix). While values were obtained for all water samples, this was not the case for sediment, since not all the target analytes were detected. The ratios of 4,4'-DDT/4,4'-DDE and 4,4'-DDT/(4,4'-DDE+4,4'-DDD), ranged from 0.064 to 4.9 and 0.52 to 1.4 for water and sediment (Table A3), respectively. For water samples, 62.5% of the sites had 4,4'-DDT/4,4'-DDE values >1, reflecting historical input (Yu et al., 2014, Li et al., 2018; Yang et al., 2019), while 75% of the sites, particularly those at the inlet and middle segment sections, revealed recent input of DDT, since 4,4'-DDT/(4,4'-DDE+4,4'-DDD) values were <1. The mixture of sources supports its previous and current uses as a disease vector control method (Fig. 1) in the region (Gerber et al., 2016; Moja et al., 2017; UNEP, 2018), but also highlights the translocation of these compounds throughout the Olifants River. The sources of technical HCH and lindane were determined from α-HCH γ-HCH. In this study, >90% of water and sediment samples, had values <4.6, which indicate recent inputs of lindane, likely due to its illegal application for pest control (Ansara-Ross et al., 2012; Yu at al., 2014; Li et al., 2018; Yang et al., 2019). The ratios of γ-chlordane/α-chlordane and heptachlor epoxide/heptachlor reveal the sources of chlordane and heptachlor, respectively (Yu et al., 2014; Zhao et al., 2018). More than 75% of water and between 25% and 40% of sediment samples, had values >1 (Table A3). This indicated that historic use was the predominating factor influencing the presence of these compounds in water, while a mixture of older and current applications impacted sediment.
The source distribution in the main water body was such that the values alternated from the inlet and middle segment sites, to the upper reaches. This indicates that the main input of these compounds is either directly linked to the Olifants River, or influenced by input from the Rietfontein (Site 10) and Kranspoortspruit streams (Site 11), where 94.7 and 73.7% of the OCPs were detected. Furthermore, since water from the Olifants River flows through multiple dams as it traverses through the Mpumalanga Province, this results in spatio-temporal variations in OCP levels, reported by Gerber et al. (2016) and Moja et al. (2017). The results from this study demonstrate that the dam acts as a sink and contributes to the translocation of these compounds through the dam. These findings also emphasize the need for consistent biomonitoring programs, since the prevalence of compounds may be a function of sampling period and matrix type.
Distribution of phthalates in water and sediment
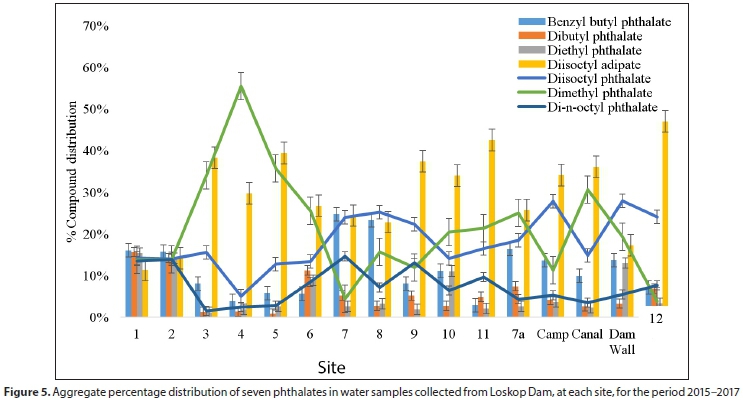
All target phthalates investigated were present in water samples collected from Loskop Dam and at levels that were comparable within sites (Table 1). Ofthe seven phthalates, diisoctyl adipate was the most dominant compound, contributing an average ~31.0% to the total of these compounds, followed by dimethyl and diisoctyl phthalate, at 21.0 and 19.0%, respectively (Fig. 5). The remaining compounds contributed 12.6, 7.25, 4.86 and 4.38%, in the order benzyl butyl- > di-n-octyl- > diethyl -> dimethyl phthalate. Benzyl butyl phthalate was present at the highest concentration at Site 7 (24.7%) and the lowest at Site 4 (Fig. 5). The inlet site, Site 1, was highest in both dibutyl and diethyl phthalate, at 15.7 and 15.4%, respectively, while Sites 5 (0.86%) and 3 (1.17%) contained the least.
The overall abundance of diisoctyl adipate was attributed to the 47.0% contribution of Site 12, while the least was observed at 11.4% in samples from Site 1. Diisoctyl phthalate was highest at the Camp site, and lowest at Site 4, at 27.9 and 5.02%, respectively. A dimethyl phthalate contribution of 55.5% to the total phthalates was determined at Site 4, which was the greatest overall site-specific compound contribution, while the lowest amount was 3.82% at Site 12. Finally, Sites 3 and 7 contributed the least in total and the highest di-«-octyl phthalate levels at 1.54 and 14.6%, respectively.
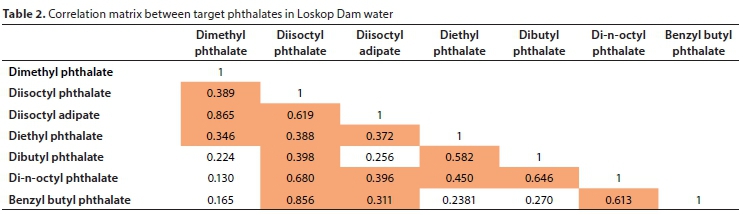
The distribution of phthalates in Loskop Dam water contradicts that obtained from other studies assessing freshwater systems (Fatoki et al., 2010; Sibali et al., 2013). In these studies, diisoctyl phthalate and dibutyl phthalate were reported as the predominant compounds and their presence correlated with input from various industrial activities. The predominant species obtained in this study, infer that these phthalates are derived from PVC plastic and personal care products. This may be a consequence of improper domestic waste disposal in the area. In addition, the holiday resort in the vicinity probably also contributes to effluent from personal care products. These finding are reiterated by the correlations between phthalates (Table 2). The results indicate that the majority of compounds are strongly related (r > 0.3), and indicate similar input sources, as described by Zhang et al. (2018) and references therein. This is a consequence of the similarities in physicochemical characteristics of these compounds, which facilitate their translocation and transformation in the environment.
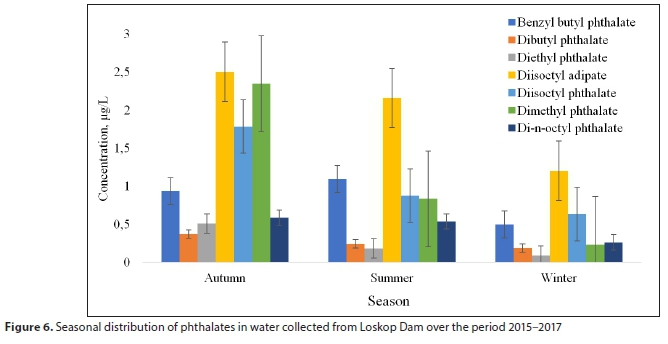
The average total phthalate levels in autumn, winter and summer were 1.3, 0.44 and 0.85 μg/L, and averaged 1.6, 0.83 and 0.61 μg/L, respectively (Table A4, Appendix). Diisoctyl phthalate was consistently high throughout the seasons, while dimethyl phthalate and diisoctyl phthalate varied within sites and between seasons (Fig. 6). Overall, the seasonal trends indicated that the target analytes preferentially accumulate or are predominant at sites furthest from the inlet in autumn and summer, with lower concentrations detected in winter. The consistent presence of dimethyl phthalate could be an indication of a continuous influx from an alternative source in this portion of the dam.
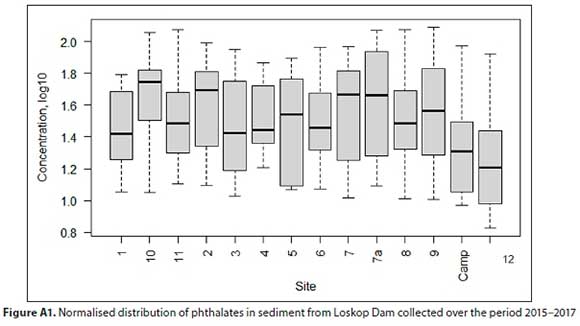
Phthalates were detected in all of the sediment samples collected from Loskop Dam, with totals ranging from 428 to 2 100 μg/kg (μ = 41.2 μg/kg) at sampling Sites 1 to 9 (Table 1). The Zphthalates were between 1 950 and 3 060 μg/kg at Sites 10 and 11, respectively, and averaged 48.1 μg/kg. The prevalence of these compounds was in the order dibutyl phthalate >benzyl butyl phthalate > dimethyl phthalate > diisoctyl adipate > diethyl phthalate > diisoctyl phthalate > di-«-octyl phthalate. The concentrations were far lower than those determined in sediment from water bodies in the Guangzhou region in China (Zheng et al., 2008), Taiwan (Huang et al., 2008) and other water bodies in South Africa (Fatoki et al., 2010), which ranged from Σ2 270-74 940 (μ = 20 850), 0.054 910 μg/kg and 20-890 μg/kg, respectively.
As illustrated in Fig. A1 (Appendix), the spatial distribution varied significantly (F > Fcrit, p < α) between sites and also relative to Sites 10 and 11. In addition, ANOVA (two-factor without replication) indicated that there were differences between the phthalate concentrations at each site over the study period, since p = 0.00212 and F > Fcrit at 7.87 and 3.37, respectively. This evaluation concurred with the average levels observed at each segment of the dam, where μ = 39 μg/kg at the inlet, 39 μg/kg in the middle segment and 44 μg/kg in the upper section (Table 1). This gradual decline of phthalate levels into the main water body suggests that, although the inflow carries these contaminants into the dam, competing physicochemical and biological processes prevail, particularly in the inlet and middle segment. Huang et al. (2008) and Zhang et al. (2018), demonstrated that environmental parameters, including pH, dissolved oxygen (DO), E. coli and NH3-N, were significant influences on the prevalence of phthalates, particularly that of di-n-octyl phthalate. They found that the levels of this compound were positively correlated with anoxic conditions, resulting in its degradation. Of the phthalates, di-«-octyl phthalate was present at the lowest concentration in sediment from Loskop Dam, which may be related to DO fluxes, particularly at the sediment surface. Furthermore, the compound profile suggests that the rate at which these compounds interact with sediment is also dependent on location. This effect is evident from the phthalate concentrations observed at Sites 10 and 11, which were present at the highest concentrations during this study. These differences may be related to the dominating anthropogenic activities and/or the water sources feeding into these sites and the low water flow of these streams, which may promote accumulation.
Sediment collected in autumn contained the highest concentrations of phthalates, averaging 44 μg/kg, followed by summer (41 μg/kg) and winter (41 μg/kg) (Table A4). Two-factor ANOVA (p = 0.00212, F > Fcrit) and Pearson's correlation (r > 0.555) indicated that seasonal influences played a significant role in the concentrations determined. In addition to prevailing climatic conditions, it was concluded that the presence of these compounds in sediment could be attributed to external influences, including industrial, domestic and agricultural run-off. Strong positive correlations were observed between dimethyl phthalate,with diisoctyl phthalate (r = 0.455), diisoctyl adipate (r = 0.439) and di-«-octyl phthalate (r = 0.643), suggesting similar input sources of these compounds. Similarly, diisoctyl phthalate and diethyl phthalate has strong associations with dibutyl phthalate (r > 0.340) and di-n-octyl phthalate (r = 0.657). Zhang et al. (2018), and references therein, demonstrated that the widespread use of phthalates as plasticizers and in agricultural products drive the distribution of these compounds in environmental compartments. Furthermore, these authors found that the correlations between phthalates, specifically, dimethyl phthalate and di-«-octyl phthalate, amongst others, was an indication of related sources. This trend was more dominant in water samples collected from Loskop Dam (Table 2).
Correlations between OCPs and phthalates in water and sediment
The levels of pesticides and phthalates in water and sediment from Loskop Dam, were subjected to non-metric multidimensional analysis (NMDS) and hierarchical cluster analysis (HCA) (Fig. 7) using the Vegan (version 2.4-6) and MASS (version 7.3-47) packages in RStudio (1.2.5033, 2009-2019 RStudio, Inc.), as described by Seopela et al. (2020) and references therein. The natural dissimilarity measure for OCP and phthalate distribution in water and sediment were best described by Bray Curtis distances (stress = 0.0694). As illustrated by Fig. 7A, strong clustering of water samples across sites was observed, while sediment demonstrated segment (i.e., inlet, middle and upper) groupings. The distribution in water samples was expected, a consequence of constant mixing of water due to flow, while variations in sediment were attributed to spatial and temporal variations, as well as the differences in physicochemical interactions of the target compounds along the length of the dam. These findings are in agreement with the concentration differences observed in the water and sediment during the study period (discussed previously). Further inspection of the NMDS plots indicated that OCPs were more prominent drivers of the strong associations between water samples and phthalates for sediment. Three clusters, comprising all sediment, water from Sites 3 to 12, Camp, Dam Wall and Canal, as well as Sites 1 and 2, were generated from the HCA (Fig. 7B). Sun et al. (2016) found that the distribution of OCPs and phthalates varied spatially and temporally. Furthermore, they found that the close association of compounds in HCA implied that they had strong positive correlations, which could be related to similar sources, as described by Yang et al. (2019). In agreement with the findings by Sun et al. (2016), the distribution and association of the target compounds in water and sediment could serve as a guide to authorities for the implementation of appropriate mitigation strategies. These clustering effects could also serve as a baseline for teasing out the factors that drive the sporadic changes in the water quality of Loskop Dam, particularly concerning the health of organisms dependent on this water body.
CONCLUSIONS
The presence and levels of OCPs and phthalates in water and sediment in the Loskop Dam were determined. This 3-year study enabled long-term assessment and evaluation of the seasonal and spatial variations in the distribution of these compounds. Organochlorine pesticides were present at lower concentrations than phthalates. In addition, OCPs were found to accumulate upstream, while phthalates were prevalent at inlet sites. The concentrations of these compounds were found to be greater in autumn than in summer and winter. The seasonal and spatial variations of these compounds, combined effects, as well as the prevailing anthropogenic activities and climatic conditions, may be key contributors to the stresses induced by contaminants. These findings raise concerns regarding the health of this aquatic system and the potential effects of their presence on organisms and humans dependent on the water body. The results also contribute to the available knowledge on the levels of OCPs and phthalates in the Olifants River water system, so that trends can be identified that signal an increase in environmental pollution. Designated authorities and governing institutions, as well as stakeholders, can use this data as a basis for the application of monitoring and mitigation strategies. These will ensure that pre-emptive measures are put in place to prevent catastrophic epidemiological events.
ACKNOWLEDGMENTS
This work is based on the research supported wholly and/or in part by the National Research Foundation of South Africa (Grant Number 111211). The authors would like to thank Prof Ludwig Combrinck, the staff of Loskop Dam Nature Reserve, as well as the Mpumalanga Tourism and Parks Agency for their contributions.
REFERENCES
ACD/Spectrus Processor, version 2017.1.3, Advanced Chemistry Development, Inc., Toronto, On, Canada, URL: www.acdlabs.com (Accessed 27 November 2017). [ Links ]
ADENIYI A, DAYOMI M, SIEBE P and OKEDEYI O (2008) An assessment of the levels of phthalate esters and metals in the Muledane open dump, Thohoyandou, Limpopo Province, South Africa. Chem. Cent. J. 2 9. https://doi.org/10.1186/1752-153X-2-9 [ Links ]
ANSARA-ROSS TM, WEPENER V, VAN DEN BRINK PJ and ROSS MJ (2012) Pesticides in South African fresh waters. Afr. J. Aquat. Sci. 37 (1) 1-16. http://doi.org/10.2989/16085914.2012.666336 [ Links ]
BAQAR M, SADEF Y, AHMAD SR, MAHMOOD A, LI J and ZHANG G (2018) Organochlorine pesticides across the tributaries of River Ravi, Pakistan: Human health risk assessment through dermal exposure, ecological risks, source fingerprints and spatio-temporal distribution. Sci. Total Environ. 618 291-305. https://doi.org/10.1016/j.scitotenv.2017.10.234 [ Links ]
BEHRENDS V, TREDWELL GD and BUNDY JG (2011) A software complement to AMDIS for processing GC-MS metabolomics data. Anal. Biochem. 415 206-208. https://doi.org/10.1016/j.ab.2011.04.009 [ Links ]
BILLER JE and BIEMANN K (1974) Reconstructed mass spectra, A novel approach for the utilization of gas chromatographmass spectrometer data. Anal. Lett. 7 (7) 515-528. https://doi.org/10.1080/00032717408058783 [ Links ]
COLBY BN (1992) Spectral deconvolution for overlapping GC/MS components. Am. Soc. Mass Spectrom. 3 558-562. [ Links ]
ECHA (European Chemicals Agency) (2018) Authorization list. URL: https://echa.europa.eu/authorisation-list (Accessed 15 September 2019). [ Links ]
FATOKI OS and AWOFOLU OR (2004) Levels of organochlorine pesticide residues in marine-, surface-, ground- and drinking waters from the Eastern Cape Province of South Africa. J. Environ. Sci. Health. Part B: Pesticides, Food Contamin. Agric. Wastes. 39 (1) 101-114. https://doi.org/10.1081/PFC-120027442 [ Links ]
FATOKI, OS, BORNMAN M, RAVANDHALALA L, CHIMUKA L, GENTHE B and ADENIYI A (2010) Phthalate ester plasticizers in freshwater systems of Venda South Africa and potential health effects. Water SA. 36 (1) 117-125. https://doi.org/10.4314/wsa.v36i1.50916 [ Links ]
GERBER R, SMIT NJ, VAN VUREN JHJ, NAKAYAMA SMM, YOHANNES YB, IKENAKA Y, ISHIZUKA M and WEPENER V (2016) Bioaccumulation and human health risk assessment of DDT and other organochlorine pesticides in an apex aquatic predator from a premier conservation area. Sci. Total Environ. 550 522-533. https://doi.org/10.1016/j.scitotenv.2016.01.129 [ Links ]
GROBLER DF (1994) A note on PCBs and chlorinated hydrocarbon pesticide residues in water, fish and sediment from the Olifants River, Eastern Transvaal, South Africa. Water SA. 20 (3) 187-194. [ Links ]
HUANG P-C, TIEN C-J, SUN Y-M, HSIEH C-Y and LEE C-C (2008) Occurrence of phthalates in sediment and biota: Relationship to aquatic factors and the biots-sediment accumulation factor. Chemosphere. 73 539-544. https://doi.org/10.1016/j.chemosphere.2008.06.019 [ Links ]
HUCHZERMEYER KDA, OSTHOFF G, HUGO D and GOVENDER D (2013) Comparison ofthe lipid properties of healthy and pansteatitis-affected African sharptooth catfish, Clarius gariepinus (Burchell), and the role of diet in pansteatitis outbreaks in the Olifants River in the Kruger National Park, South Africa. J. Fish Dis. 36 897-909. https://doi.org/10.1111/jfd.12010 [ Links ]
LEE Y, LEE J, CHOE W, KIM T, LEE J, KHO Y, CHOI K and ZOH K (2019) Distribution of phthalate esters in air, water, sediments, and fish in the Asan Lake of Korea. Environ. Int. 126 635-643. https://doi.org/10.1016/j.envint.2019.02.059 [ Links ]
LI O, LU Y, WANG P, WANG T, ZHANG Y, SURIYANARAYANAN S, LIANG R, BANINLA Y and KHAN K (2018) Distribution, source, and risk of organochlorine pesticides (OCPs) and polychlorinated biphenyls (PCBs) in urban and rural soils around the Yellow and Bohai Seas, China. Environ. Pollut. 239 233-241. https://doi.org/10.1016/j.envpol.2018.03.055 [ Links ]
LONDON L, FLISHER AJ, WESSELING C, MERGLER D and KROMHOUT H (2005) Suicide and exposure to organophosphate insecticides: cause or effect? Am. J. Ind. Med. 47 302-321. https://doi.org/10.1002/ajim.20147 [ Links ]
MILLER JC and MILLER JN (2010) Statistics for Analytical Chemistry. 6th edn. Ashford Colour Press Ltd, Gosport. [ Links ]
MOJA SJ, ODUSANYA D, MTUNZI FM and MULANGA CT (2017) Investigation of selected organic compounds along the Olifants River in South Africa. Mod. Chem. Appl. 5 (4) 1-8. https://doi.org/10.4172/2329-6798.1000236 [ Links ]
MONTORY M, FERRER J, RIVERA D, VILLOUTA MV and GRIMALT JO (2017) First report on organochlorine pesticides in water in a highly productive agro-industrial basin of the Central Valley, Chile. Chemosphere. 174 148-156. https://doi.org/10.1016/j.chemosphere.2016.12.125 [ Links ]
NET S, DELMONT A, SEMPÉRÉ R, PALUSELLI A and OUDDANE B (2015) Reliable quantification of phthalates in environmental matrices (air, water, sludge, sediment and soil): A review. Sci. Total Environ. 515-516 162-180. https://doi.org/10.1016/j.scitotenv.2015.02.013 [ Links ]
OLISAH C, OKOH OO and OKOH AI (2020) Occurrence of organochlorine pesticide residues in biological and environmental matrices in Africa: A two-decade review. Heliyon. 6 e03518. https://doi.org/10.1016/j.heliyon.2020.e03518 [ Links ]
OLUJIMI OO, FATOKI OS, ODENDAAL JP and OKONKWO JO (2010) Endocrine disrupting chemicals (phenol and phthalates) in the South African environment: a need for more monitoring. Water SA. 36 (5) 671-682. https://doi.org/10.4314/wsa.v36i5.62001 [ Links ]
OLUJIMI OO, FATOKI OS and DASO AP (2012) Chemical monitoring and temporal variation in levels of endocrine disrupting chemicals (priority phenols and phthalate esters) from selected wastewater treatment plant and freshwater systems in Republic of South Africa. Microchem. J. 101 11-23. https://doi.org/10.1016/j.microc.2011.09.011 [ Links ]
OLUTONA GO and DAWADO MO (2016) Identification and quantification of phthalates in water and sediment of Ori Stream, Iwo, Southwestern Nigeria using high performance liquid chromatography. J. Environ. Chem. Ecotoxicol. 8 (9) 82-88. https://doi.org/10.5897/JECE2016.0377 [ Links ]
QUINN LP, DE VOS BJ, FERNANDES-WHALEY M, ROOS C, BOUWMAN H, KYLIN H, PIETERS R and VAN DEN BERG J (2011) Pesticide use in South Africa: one of the largest importers of pesticides in Africa. In: Stoytcheva M (ed.) Pesticides in the Modern World - Pesticides Use and Management. ISBN: 978-953-307-459-7. InTech. http://www.intechopen.com/articles/show/title/pesticide-use-in-south-africa-one-of-the-largest-importers-of-pesticides-in-africa [ Links ]
RSTUDIO TEAM (2019) RStudio: Integrated Development for R. RStudio, Inc., Boston, MA. URL: http://www.rstudio.com/ [ Links ]
SALAUDEEN T, OKOH O, AGUNBIADE F and OKOH A (2018) Fate and impact of phthalates in activated sludge treated municipal wastewater on the water bodies in the Eastern Cape, South Africa. Chemosphere. 203 336-344. https://doi.org/10.1016/jxhemosphere.2018.03.176 [ Links ]
SEOPELA MP, MCCRINDLE RI, COMBRINCK S and REGNIER T.J-C (2016) Hazard assessment of polycyclic aromatic hydrocarbons in water and sediment in the vicinity of coal mines. J. Soils Sediments. 16 (12) 2740-2752. https://doi.org/10.1007/s11368-016-1499-x [ Links ]
SEOPELA MP, MCCRINDLE RI, COMBRINCK S and AUGUSTYN W (2020) Occurrence, distribution, spatio-temporal variability and source identification of n-alkanes and polycyclic aromatic hydrocarbons in water and sediment from Loskop dam, South Africa. Water Res. 186 116350. https://doi.org/10.1016/j.watres.2020.116350 [ Links ]
SHRIVASTAVA A and GUPTA VB (2011) Methods for the determination of limit of detection and limit of quantitation of the analytical methods. Chronicles Young Scientists. 2 (1) 21-25. [ Links ]
SIBALI LL, OKONKWO JO and MCCRINDLE RI (2008) Determination of selected organochlorine pesticides (OCP) compounds from the Jukskei River catchment area in Gauteng, South Africa. Water SA. 34 611-621. https://doi.org/10.4314/wsa.v34i5.180659 [ Links ]
SIBALI LL, OKONKWO JO and MCCRINDLE RI (2013) Determination of selected phthalate esters compounds in water and sediments by capillary gas chromatography and flame ionization detector. J. Environ. Sci. Health A. 48 1365-1377. https://doi.org/10.1080/10934529.2013.781884 [ Links ]
SUN J, PAN L, ZHAN Y, LU H, TSANG DCW, LIU W, WANG X, LI X and ZHU L (2016) Contamination of phthalate esters, organochlo-rine pesticides and polybrominated diphenyl ethers in agricultural soils from the Yangtze River Delta of China. Sci. Total Environ. 544 670-676. https://doi.org/10.1016/j.scitotenv.2015.12.012 [ Links ]
UNEP (United Nations Environment Programme) (2018) Stockholm convention on persistent organic pollutants, texts and annexes, revised in 2017.http://www.pops.int/TheConvention/Overview/TextoftheConvention/tabid/2232/Default.aspx (Accessed 19 September 2020). [ Links ]
USEPA (United States Environmental Protection Agency) (2001) Methods for Collection, Storage and Manipulation of Sediments for Chemical and Toxicological Analyses: Technical Manual. (Vol. EPA 823-B-01-002). Office of Water, United States Environmental Protection Agency, Washington, DC. [ Links ]
VAN DYK LP and GREEFF CG (1977) Endosulfan pollution of rivers and streams in the Loskop Dam cotton-growing area. Agrochemophysica. 9 71-76. [ Links ]
VAN WYK JH, ARCHER E, BABALOLA OO, TRUTER JC, JANSEN VAN RENSBURG E and DABROWSKI J (2014) Pesticides as endocrine disruptors in South Africa: Laboratory and field studies. WRC Report No. 1932/1/14. Water Research Commission, Pretoria. [ Links ]
VERHAERT V, COVACI A, BOUILLON S, ABRANTES K, MUSIBONO D, BERVOETS L, VERHEYEN E and BLUST R (2013) Baseline levels and trophic transfer of persistent organic pollutants in sediments and biota from the Congo River Basin (DR Congo). Environ. Int. 59 290-302. https://doi.org/10.1016/j.envint.2013.05.015 [ Links ]
WANG Y, ZHANG S, CUI W, MENG X and TANG X (2018) Polycyclic aromatic hydrocarbons and organochlorine pesticides in surface water from the Yongding River basin, China: Seasonal distribution, source apportionment, and potential risk assessment. Sci. Total Environ. 618 419-429. https://doi.org/10.1016/j.scitotenv.2017.11.066 [ Links ]
YANG J, QADEER A, LIU M, ZHU J-M, HUANG Y-P, DU W-N and WEI X-Y (2019) Occurrence, source, and partition of PAHs, PCBs, and OCPs in the T multiphase system of an urban lake, Shanghai. Appl. Geochem. 106 17-25. https://doi.org/10.1016/j.apgeochem.2019.04.023 [ Links ]
YU Y, LI Y, SHEN Z, YANG Z, MO L, KONG Y and LOU I (2014) Occurrence and possible sources of organochlorine pesticides (OCPs) and polychlorinated biphenyls (PCBs) along the Chao River, China. Chemosphere. 114 136-143. https://doi.org/10.1016/j.chemosphere.2014.03.095 [ Links ]
ZHANG Z-M, ZHANG H-H, ZOU Y-W and YANG G-P (2018) Distribution and ecotoxicological state of phthalate esters in the sea-surface microlayer, seawater and sediment of the Bohai Sea and the Yellow Sea. Environ. Pollut. 240 235-247. https://doi.org/10.1016/j.envpol.2018.04.056 [ Links ]
ZHAO D, ZHANG P, GE L, ZHENG GJ, WANG X, LIU W, YAO Z (2018) The legacy of organochlorinated pesticides (OCPs), polycyclic aromatic T hydrocarbons (PAHs) and polychlorinated biphenyls (PCBs) in Chinese coastal seawater monitored by semi-permeable membrane devices (SPMDs). Mar. Pollut. Bull. 137 222-230. https://doi.org/10.1016/j.marpolbul.2018.10.004 [ Links ]
ZHAO X, CUI T, GUO R, LIU Y, WANG X, AN YX, QIAO X and ZHENG B (2019) A clean-up method for determination of multi-classes of persistent organic pollutants in sediment and biota samples with an aliquot sample. Anal. Chim. Acta. 24 (1047) 71-80. https://doi.org/10.1016/j.aca.2018.10.011 [ Links ]
ZHENG F, CUI K, XIE Z, WU L, LIU M, SUN G, LIN Y, LUO D and ZENG Z (2008) Phthalate esters (PAEs): Emerging organic contaminants in agricultural soils in peri-urban areas around Guangzhou, China. Environ. Pollut. 156 (2) 425-434. https://doi.org/10.1016/j.envpol.2008.01.045 [ Links ]
 Correspondence:
Mathapelo P Seopela
Email: seopela_mp@yahoo.com; mpseopela@uj.ac.za
Received: 2 June 2020
Accepted: 22 March 2021
* Current affiliation: University of Johannesburg, Department of Chemical Sciences Auckland Park Campus, PO Box 524, Auckland Park 2006, South Africa
APPENDIX
Chromatographic analysis
The inlet was operated in splitless mode using a Splitless single taper, ultra-inert liner with glass wool (part number: 5190-2293, Agilent, USA). The injector was operated at 300°C, at a pressure of 6.455 psi and with a septum purge flow of 3 mL/min (purge flow to split vent: 40 mL/min at 2 min). A 1 μL volume of each sample was introduced; thereafter separation of the constituents was achieved on a 15 m x 250 μm i.d. x 0.1 μm film thickness DB-5MS (phenyl arylene polymer stationary phase), J&W column (Agilent, USA). Ultrapurified helium (99.99%, Afrox, RSA) at a constant flow of 1.8 mL/min, was used as the carrier gas. The temperature gradient was as follows: initial temperature of 50°C, held for 1 min, ramped at 5°C/min to 180°C, held for 3 min, and increased to 300°C at 10°C/min, maintained for 7 min, equating to a total run time of 49 min. The MS was operated in the Scan/SIM modes (m/z from 50 to 300), at an absolute voltage of 1 859 V and gain factor of 8. The transfer line, quadrupole and ion source temperatures were set at 280, 150 and 230°C, respectively.
Quality control
Ultrapure water with a resistivity of 18 MO-cm at 25°C, was generated by a Simplicity UV system (Millipore, France) and used as the laboratory blank, to monitor and account for contamination attributed to sample processing. In addition, to evaluate the performance of the extraction procedure for water, 10 mg/L of 4,4'-DDT, 4,4'-DDD, β-endosulfan and endosulfan sulfate, 2.0 mg/L of α-HCH, ß-HCH, γ-HCH, δ-HCH, heptachlor, aldrin, heptachlorepoxide, α-endosulfan, 4,4'-DDE, dieldrin, endrin and endrin aldehyde, 10 mg/L benzyl butyl phthalate, 50 mg/L di-n-butyl phthalate and bis(2- ethylhexyl)phthalate, as well as 25 mg/L dimethyl phthalate, diethyl phthalate, bis-2-ethylhexyl adipate and di-n-octyl phthalate, were prepared in methanol and diluted to 1.0 L with ultrapure water, resulting in concentration ranges between 2.0 to 5.0 μg/L.
The sediment extraction procedure was validated by comparing the recoveries of the target analytes with the certified concentrations in the PAH, PCBs and Pesticides on Sediment certified reference material (CNS391-50G CRM; Supelco, Sigma-Aldrich, USA). The CRM contained the 16 USEPA PAHs, PCBs (8, 18, 28, 31, 44, 49, 52, 66, 87, 95, 99, 101, 90, 105, 110, 118, 128, 138, 163, 164, 149, 151, 153, 156, 170, 190, 180, 183, 187, 159, 182, 194, 195, 206 and 209), and pesticides; aldrin, α-endosulfan I, 4,4'-DDT, 4,4'-DDD, 4,4'-DDE, dieldrin, endrin, α-HCH, ß-HCH, γ-HCH, heptachlor and heptachlor epoxide.

