


Services on Demand
Article
 English (pdf)
 Article in xml format
 Article references
Indicators

Related links
-
 Cited by Google
 -
 Similars in Google
Share

 Permalink
Water SA
On-line version ISSN 1816-7950
Print version ISSN 0378-4738
Water SA vol.47 n.2 Pretoria Apr. 2021
http://dx.doi.org/10.17159/wsa/2021.v47.i2.10917
RESEARCH PAPER
Increasing nutrient influx trends and remediation options at Hartbeespoort Dam, South Africa: a mass-balance approach
ASD CarrollI; CJ CurtisII
ISchool of Geography, Archaeology and Environmental Studies, University of the Witwatersrand, Private Bag 3, Johannesburg 2050, South Africa
IIDepartment of Geography, Environmental Management and Energy Studies, University of Johannesburg, PO Box 524, Auckland Park 2600, South Africa
ABSTRACT
The Hartbeespoort Dam, located 40 km west of Tshwane on the Crocodile River, is an extremely eutrophic water body. Situated in one of the most economically active areas of South Africa, it receives a high nutrient input from wastewater treatment works (WWTW), leaking sewers, as well as urban and agricultural runoff. The Metsi a Me programme, which ran from 2006 to 2016, aimed to mitigate in-lake nutrient stocks using biomanipulation, including the physical removal of Eichhornia crassipes (water hyacinth) and Microcystis aeruginosa (blue-green algae). Using Department of Water and Sanitation water quality and flow data, the annual influxes and outfluxes of total nitrogen (TN) and total phosphorus (TP) to the Hartbeespoort Dam were calculated. Through literature review and comparison with previous studies, the relative importance of nutrient removal from biomass harvesting in relation to retained nutrients was assessed. The average nutrient influx from rivers during hydrological years 2010/11 to 2016/17 was 582 t-a-1 TP and 4 687 t-a-1 TN, with trends for both TN and TP being significantly positive over this period. TP influx increased by 77.8 t-a-1 every year and TN influx increased by 456 t-a-1, reversing a long-term negative trend. Average annual dam retention + removal (calculated as the difference between river inputs and outputs, i.e., including sedimentation, biomass removal and denitrification losses) was 358 t P and 2 195 t N. A best estimation of nutrient removal from water hyacinth and algal harvesting was 2.1 t-a-1 P and 11.5 t-a-1 N, and 3.9 t-a-1 P and 40 t-a-1 N, respectively. An estimated 341 t-a-1 P and 674-1 288 t-a-1 N was sedimented. Denitrification losses are poorly quantified but are possibly comparable to sedimentation. River outfluxes increased by 28.4 t-a-1 TP and 110 t-a-1 TN, smaller rates than the influxes, suggesting increasing retention per annum. Upgrading WWTWs in the catchment and refurbishing leaking and overflowing sewers is the most appropriate long-term solution.
Keywords: phosphorus; nitrogen; annual flux; Mann-Kendall trend test; biomanipulation; Eichhornia crassipes; Microcystis aeruginosa
INTRODUCTION
The Hartbeespoort Dam is one of the most eutrophic dams in South Africa (Harding, 2008). Eutrophication is the oversupply of plant nutrients into an environment causing excessive growth of certain plants and algae (which for the purposes of this study are assumed hereafter to include cyanobacteria as well as true algae), typically phytoplankton but also Eichhornia crassipes (water hyacinth), and Phragmites spp. reeds (Rossouw et al., 2008; Canavan et al., 2018). Sources of nutrients such as nitrogen (N) and phosphorus (P) compounds include sewage, atmospheric deposition, groundwater and agricultural runoff (Anderson et al., 2002). Eutrophication is associated with a loss of biodiversity and ecosystem health as well as the increasing dominance of potentially toxic cyanobacteria (Rossouw et al., 2008). Phytoplankton blooms limit light penetration, preventing aquatic flora in the littoral zone from photosynthesizing (Chislock et al., 2013). Oxygen shortages in the water column caused by decomposition of algae and aquatic weeds cause loss of aquatic organisms (Khan and Mohammed, 2014). Floating aquatic plants such as water hyacinth can also form dense mats on the water surface, which shade out other aquatic organisms, suppress algal growth and provide excellent conditions for settling of particles by preventing wind action to the water surface (Kim and Kim, 2000).
In aquatic ecosystems that are subjected to nutrient enrichment, the reduction or removal (harvesting) of plant and/or animal biomass in order to reduce nutrient stocks and associated nutrient recycling is widely advocated as a strategy to alleviate the problem (Hart and Harding, 2015). The Hartbeespoort Dam Integrated Biological Remediation Programme (HDIBRP), also known as 'Harties Metsi a Me', which ran from 2006 until 2016, aimed to rehabilitate the dam using this strategy and had a strong food-web restructuring approach. The multi-pronged approach involved fish removal, algal and hyacinth biomass harvesting, sediment dredging, construction of floating wetlands and composting of harvested water hyacinth.
As early as 1985 it was determined that removal ofwater hyacinth and algae from the dam would serve a purely aesthetic purpose and would be unlikely to improve the impacts of eutrophication (NIWR, 1985). Several recent studies support the argument that biomanipulation is an ineffective method of reducing nutrient stocks in Hartbeespoort Dam (Hart and Harding, 2015; Hart and Matthews, 2018). These studies concluded that the trophic status of the dam is too high for biomanipulation to have a significant effect on nutrient stocks. Hart (2006) concluded that 'as far as can be generalised, prospects of applying 'classical' biomanipulation as a management tool to ameliorate consequences of eutrophication in local reservoirs are weak'. In addition, international studies show that biomanipulation, aquatic plant harvesting, dredging and aeration strategies are too costly to pursue in large lakes and should not be adopted unless external loading of P can simultaneously be reduced (Schindler, 2006).
The aim of this study was to determine trends in nutrient inputs and to perform N and P mass balance calculations for Hartbeespoort Dam to calculate nutrient retention or removal (i.e., inflow minus outflow) therein. Through literature review and comparison with previous studies, we assessed the relative importance of nutrient removal from biomass harvesting in relation to nutrient retention.
METHODS
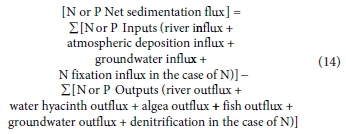
To determine nutrient input and output for the dam, and, by difference, surplus sequestration within the dam, annual river fluxes were calculated using Department of Water and Sanitation (DWS) flow and water quality data (DWS, 2019). All other components of the mass balance were estimated from the literature as no current monitoring data are available. Minimum and maximum published values were considered to provide ranges for each of the estimated (rather than calculated from monitoring data) fluxes. These ranges allow for an assessment of the potential contributions of biomass removal interventions on the overall nutrient mass balance for the dam. The sum of the annual inputs was assumed to be equal to the sum of the annual outputs plus sediment accumulation in the dam (Eq. 1):
where: inputs are river, atmospheric deposition and groundwater (as well as nitrogen fixation in the case of N); outputs are river, biomass removal (water hyacinth, algae and fish) and groundwater (as well as denitrification in the case of N); retention is sediment accumulation within the dam.
River inputs and outputs
The principal focus of this study involved calculating N and P fluxes and trends from the two major rivers feeding the dam and exiting through the dam outflows. River inputs and outputs were calculated using Eq. 2, using water quality readings taken at fortnightly intervals, with flow rates determined from 12-min interval readings. Time series using intermittent weekly or monthly grab sampling are widely used to calculate fluxes (Kirchner et al., 2004). Over the period June 2010 to April 2018, there were approximately 180 N and 180 P observations for each site. June 2010 was selected as the starting date due to a gap in TP readings on the Crocodile River from July 2008 to May 2010.

To calculate river total N (TN) fluxes, 'nitrate plus nitrite' and Kjeldahl N' (equivalent to NH4+organic N) water quality observations from DWS were summed (Eq. 3). TP is the sum of all P compounds and 'total phosphorus' values from DWS were used to calculate TP fluxes (Murphy, 2007). The Analytical Methods Manual (DWAF, 1992) outlines the procedures used by DWS to determine variable concentrations in water samples using colorimetric detection.

Sampling locations
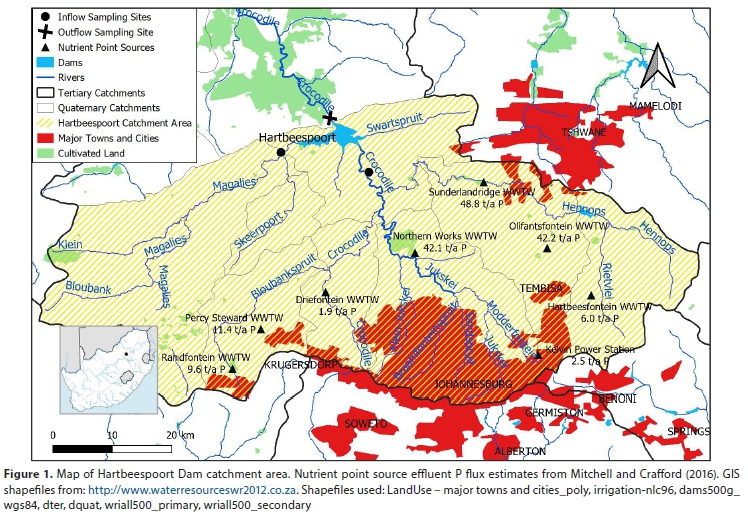
Inflow sampling locations on the Crocodile and Magalies Rivers (shown in relation to the catchment area in Fig. 1) were used to determine river nutrient fluxes, although it is well documented that the Crocodile River contributes more than 99% of the nutrient influx (NIWR, 1985; DHEC, 2004; Roux et al., 2010; Botha, 2015; Mitchell and Crafford, 2016). Importantly, however, the nutrient point sources shown in Fig. 1 represent only a fraction of nutrient inputs; diffuse loads contribute more than half of the total annual influx transported in rivers.
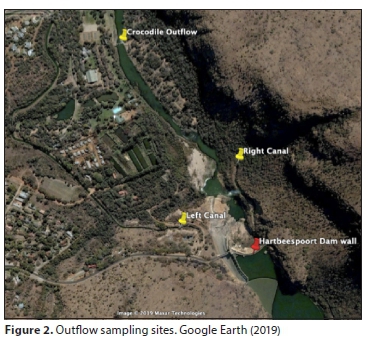
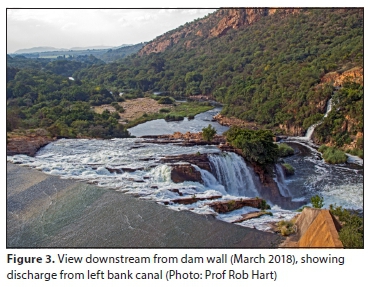
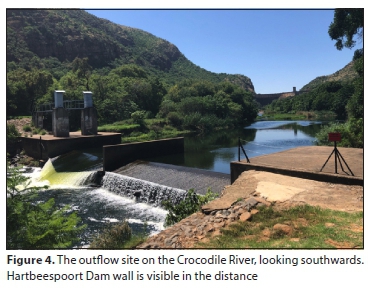
The outflow of water from the dam was sampled at 3 locations (Fig. 2); namely, at the Left and Right Canals that release irrigation and compensation water from a port located 20 m below the full supply level, and the radial sluices which draw water from a depth of approximately 2 m (NIWR, 1985). The Crocodile outflow site (river channel) represents water released by the radial sluices.
Flow rate
While the interval discordance between flow and concentration measurements presents a challenge to flux calculations, the possible effects of flow variation on flux estimates were investigated by Carroll (2020). Table 1 shows that the mean spot flow (i.e., based on those most closely matching the time of chemical sampling) is slightly lower than the overall dataset mean, possibly indicating that fluxes are underestimated. However, no correlation between concentration and flow was observed, indicating no apparent bias in using averaged flows. The fortnightly means are closer to the raw data mean for the study period and show a much smaller coefficient of variation (Table 1), justifying the fortnightly flow as being the most suitable for flux calculations in this study. The fortnightly value method used averaged flow rates between water quality samplings, incorporating the entire raw flow dataset.
Annual and seasonal flux calculations and trends
Fortnightly mean flow values were multiplied by nutrient concentrations and seconds between each sampling to derive a value in tons (Eq. 4):

The readings that fell within a hydrological year (October to September) were summed for annual fluxes. Although annual trends are of ultimate interest, quarterly seasonal plots are useful for examining trends on a finer scale. Summer (Dec/Jan/Feb), autumn (March/April/May), winter (June/July/Aug) and spring (Sept/Oct/ Nov) fluxes in tons were calculated by summing the fortnightly data in each interval. The seasonal influxes from the Magalies and Crocodile inflow sites were summed as the total river influx, while the seasonal outfluxes from the Left Canal, Right Canal and Crocodile Outflow site were summed as the total river outflux.
Seasonal Mann-Kendall trend tests were run on the seasonal influxes and outfluxes using the statistical software XLSTAT (http://www.xlstat.com/en/). Mann-Kendall trend tests were run on the annual influxes and outfluxes. It was assumed that the sum of the inflow sites and outflow sites were representative of the whole population.
Thus, the standard deviations of fluxes were determined by summing the relevant influx or outflux variances in gs-1, then taking the square root of the summed variance. The standard deviations were converted to tons using Eq. 5.
Missing data
The Right Canal had significantly fewer water quality data than the Left Canal. Because the water in the Left and Right Canals is from the same source, we tested whether the Left Canal data could be used as a proxy for missing Right Canal concentration data. As Wilcoxon signed rank tests showed that on days where both the Left and Right Canal had been sampled (n = 58), dissolved TN and TP water chemistries were not significantly different (p-value = 0.150 for TP and 0.443 for TN), water chemistry from the Left Canal was used as proxy for missing data of the Right Canal and vice versa. In addition, if either total oxidised nitrogen (TON) or Kjeldahl N were missing from a water quality sampling date, the observation was removed.
Biomass removal outputs
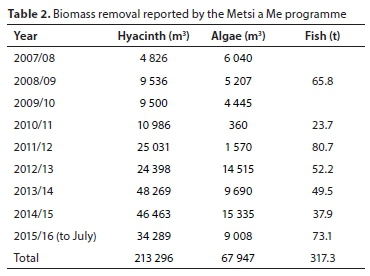
P and N biomass outputs were estimated through literature review and previous studies. The quantities of water hyacinth, 'algal soup' and fish removed by the Metsi a Me programme (Table 2) were derived from the response given to Parliamentary Question 2936 of 7 October 2015 (available at https://pmg.org.za/committee-question/1267).
Water hyacinth
The annual nutrient removal from water hyacinth harvesting was estimated using Eq. 6. As the harvesting method is not detailed in progress reports, estimates of N and P removal are imprecise. Hyacinth removal was reported as volume rather than mass.
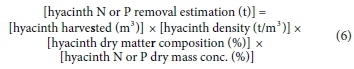
Two densities of hyacinth were used to estimate the N and P removed by hyacinth harvesting - one representing a realistic density and the other representing the maximum density. The realistic density estimate was derived using a report that a water hyacinth harvester with a 25 m3 hold can carry 4 200 kg of plant material (Bagnall et al., 1982). This is equivalent to 0.168 t/m3. The second density represents the theoretical upper limit of 1 t-m-3. This assumption is based on the density of water as hyacinth biomass (as for most other aquatic macrophytes) has a very high moisture content. On this basis, assuming that no external water is present, i.e., that each cubic metre removed is 100% water hyacinth, the maximum feasible hyacinth density would approach the density of water (1 t-m-3). Manually cleared hyacinth has an internal water content of about 95.8% (Akendo et al., 2008). Su et al. (2018) reported hyacinth dry matter compositions of 6.2-9.84%. This study assumes that hyacinth water content varies from a minimum of 90.16% to a maximum of 95.8%. Boyd (1976) reported average hyacinth nutrient compositions of 0.47% P and 2.5% N dry mass for samples grown in nutrient-enriched water. Similarly, Su et al. (2018) reported P compositions of 0.28-0.53% dry mass and N compositions of 2.76-2.9% dry mass. Thus, this study assumes hyacinth has minimum nutrient concentrations of 0.28% P and 2.5% N and maxima of 0.53% P and 2.9% N (dry mass). Minimum and maximum nutrient removal estimates of both hyacinth densities were calculated using minimum dry weight and minimum N or P contents and maximum equivalents, respectively.
Algae
As with water hyacinth, algal harvesting methods were not detailed in Metsi a Me programme progress reports, making algal removal estimates imprecise. As the Phase 1 Progress Report simply states that 'concentrated algae clouds' were physically removed 'with the aid of floating pump stations' (Rand Water, 2012 p. 15), two methods were used to estimate the potential range of algal biomass outputs.
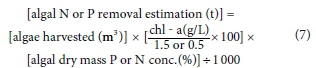
Method 1: Method 1 of determining N and P removal from algal harvesting assumes a chl-a concentration of 302 000 μg/L in hyperscums on the Hartbeespoort Dam (NIWR, 1985). Chl-a concentration was converted to algal biomass concentration using Eq. 7, adapted from Park and Craggs (2011), assuming that algal biomass has a constant Chl-a concentration of 1.5% dry mass (best estimate). Equation 7 was also modified to be specific to M. aeruginosa, the dominant algal species in the dam (Ololo, 2013), using an assumed minimum Chl-a concentration of 0.5% dry mass (slightly below the minimum value of 0.56% found by Long et al., 2001) to determine an upper limit of algal biomass concentrations. Because high N and P cell concentrations are associated with high N and P growth medium concentrations (Colman and Santha, 1988), we used the known maxima - 9.01% N and 0.89% P, to estimate nutrient removal in algal biomass.
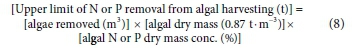
Method 2: Assuming that the harvested 'algal soup' was 100% algae with the same density as water, the theoretical upper limit of N and P removal was calculated by multiplying the cubic metres of algae removed with M. aeruginosa's maximum dry mass per unit volume (87% or 0.87 t-m-3; Hu, 2014) and the N or P dry mass concentrations (Eq. 8).
Fish
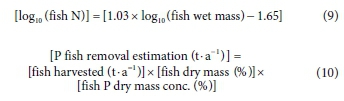
NIWR (1985) estimated that 695 t-a-1 of fish biomass was removed by anglers from the Hartbeespoort Dam during 1982 to 1984. This figure was assumed to continue through the study period, providing a putatively upper estimate, given the deteriorating state of the dam for recreational use, and was added to the fish harvesting outputs from the Metsi a Me programme (Table 2). Equation 9 was used to estimate total fish biomass N outputs using the universal regression relationship between whole body N and fish weight of Ramseyer et al. (2002). P removal from fish biomass harvesting was estimated using Eq. 10, assuming a standard of 2.3% P dry mass and dry mass as 22% of wet mass, following Hart and Harding (2015).
Other inputs and outputs
Denitrification
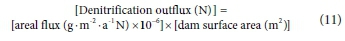
When O2 is limited, denitrifying bacteria switch from aerobic to anaerobic respiration, thereby reducing nitrate and nitrite to gaseous forms of nitrogen (Skiba, 2008). In lakes, denitrification mainly takes place at the sediment surface (Ahlgren et al., 1994), with denitrification rates affected by ambient concentrations of nitrate, organic matter and P, as well as, pH, temperature and oxygen concentrations in the overlying water, and toxic compounds from anthropogenic sources (Seitzinger, 1990, Finlay et al., 2013). Eutrophic lakes have higher denitrification rates than oligotrophic to moderately eutrophic lakes, and low P is associated with low N removal (Seitzinger, 1990, Finlay et al., 2013). Hartbeespoort Dam is thus likely to have a high denitrification rate since it is hypertrophic with high P inputs. Wilkins (2019) found that denitrification N loss could be explained by first-order kinetics modelled on TON concentration. In this study, TON comprised 68% of TN influx (i.e. approx. 3 000 t-a-1). On average, 54% of the TON component of the annual N influx was denitrified (NIWR, 1985). The TON concentration in the main basin of Hartbeespoort Dam during 1980 to 1983 was 0.59-2.70 mg-L-1 (mean not given) (NIWR, 1985). For the present study from 2010 to 2018, it averaged 2.88 mg-L-1, indicating an increase in TON concentration since the earlier study. Denitrification rates of 0.10-3.72 mol-m-2-a-1 N and 303-841 t-a-1 reported in Pina-Ochoa and Álvarez-Cobelas (2006) and NIWR, respectively were used to estimate how much N could be lost from Hartbeespoort through denitrification every year. Equation 11 describes how denitrification outflux was calculated.
N fixation
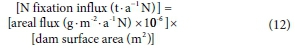
N fixation is the process by which a specialized group of prokaryotes converts inert atmospheric nitrogen to ammonia, which is then assimilated (Wagner, 2011). NIWR (1985) found that N fixation rates at Hartbeespoort were not detectable. This was expected since N fixation is normally only important in N-limited impoundments (Howarth et al., 1988). In addition, the dominant algal species in the dam, M. aeruginosa, is not an N-fixing species (Monchamp et al., 2014). Nevertheless, an N fixation rate of 0.2-9.2 g-m-2-a-1 N reported in Howarth et al. (1988) for eutrophic lakes was converted to N influx using Eq. 12.
Atmospheric deposition
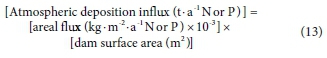
Atmospheric deposition is the process by which gases and particles from the atmosphere are transported to the aquatic and terrestrial surface (Pacyna, 2008). Atmospheric deposition can occur in the form of wet scavenging or dry deposition (Pacyna et al., 2008). Atmospheric deposition rates of 0.062 g-m-2-a-1 P (Tipping et al., 2014) and 8-19 kg-ha-1-a-1 N (Galy-Lacaux et al., 2003) were used to estimate relevant deposition fluxes (Eq. 13).
Groundwater
Hartbeespoort is built on the Brits Graben, which consists of two steeply dipping, SSE-NNW striking normal faults with a horizontal displacement of 600 m and a vertical displacement of 50 m (Judeel and Hartmann, 2008). These fault lines are a potential conduit for groundwater flow. There is a net loss to groundwater from the dam of 2 000 000 m3-a-1 (Leketa et al, 2018). Groundwater TN and TP outfluxes were assumed to have the same water chemistry as outflow canals. Nutrient influxes from groundwater have been included in river flows. Equations 2 and 4 were used to calculate groundwater flux. Since there is a net groundwater outflux from the base of the dam, we assume that nutrient influxes from groundwater across the wider catchment only occur after draining into surface river inflows. Hence the component originating from groundwater entering the dam is already included within the river influxes.
Sedimentation
In the long term, lake bottoms act as a sink, not a source of nutrients (Peimin et al., 2000). Thus, even though there is sometimes a flux of nutrients from the sediment into the water column, there is a net accumulation in the sediment (Peimin et al., 2000; Hupfer and Lewandowski, 2008). However, the release of dissolved P from the sediment-water interface plays a major role at Hartbeespoort as attested by an NIWR (1985) study which used sediment traps to show that gross P deposition flux to the sediment exceeded the net annual P load by almost three times). Using mass balance techniques, Chutter and Rossouw (1991) determined that 60-85% of the incoming P load was sedimented in Hartbeespoort each year. As the biggest unknowns in the mass balance calculations, annual P and N sedimentation fluxes were estimated by difference using Eq. 14.
RESULTS AND DISCUSSION
River fluxes and trends
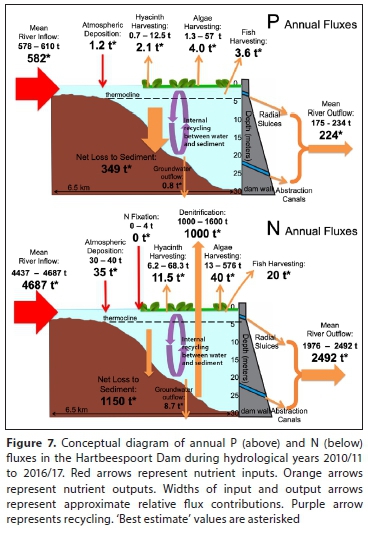
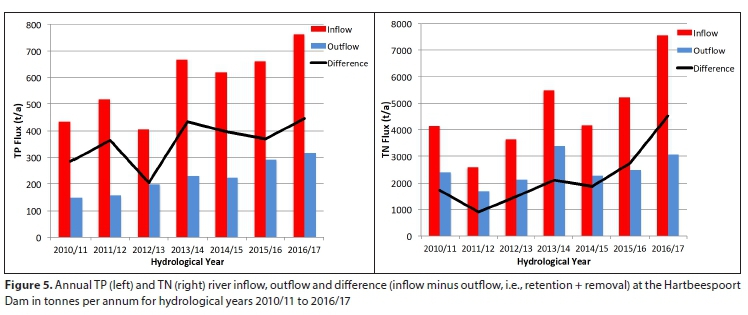
Figure 5 shows that annual nutrient influxes consistently far exceeded the corresponding outfluxes. On average, 582 t-a-1 TP and 4 687 t-a-1 TN flowed into Hartbeespoort from the Crocodile and Magalies Rivers during each hydrological year from 2010/11 to 2016/17, while corresponding river outflows from Hartbeespoort amounted to 224 t-a-1 TP and 2 492 t-a-1 TN. With approximately 39% of the TP influx and 53% of the TN influx from rivers leaving the dam through the river and canal outflows each year, 61% of TP (358 t-a-1) and 47% of TN (2 195 t-a-1) external loading remained in the reservoir water column and biomass, or was removed through biomass harvesting or sedimentation.
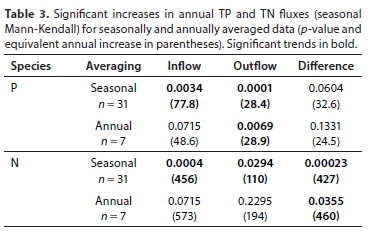
However, the seasonality of nutrient outfluxes were more pronounced than the corresponding influxes (Fig. 6, and Appendix). This seasonality largely results from rainfall-related changes in sluice gate opening and greater demand for irrigation water at Roodekopjes Dam and Vaalkop Dam during summer (Venter, 2020). Seasonal Mann-Kendall trend tests using the seasonally aggregated data showed significant trends in TP and TN river influxes and outfluxes. TP influx increased by 77.8 t-a-1 every year and TN influx increased by 456 t-a-1 from June 2010 until February 2018 (Table 3). Following this trend, one would expect a P influx of approximately of 1 000 t-a-1 for 2017/18. Over the same period TP outflux increased by 28.4 t-a-1, with a similar significant trend shown also by the annual data. TN outflux increased by 110 t-a-1. Since nutrient influxes increased at a faster rate than outfluxes, in-lake retention + removal was also increasing. The implications of increasing nutrient retention within the dam each year merit further investigation to determine the fate of the retained N and P.
Sources of nutrients to Hartbeespoort
Four main inferences indicate that WWTW effluent and leaking sewer pipes dominate nutrient inputs to Hartbeespoort. Firstly, 70% of total phosphorus (TP) input was comprised of soluble reactive phosphorus (SRP) (data not shown, see Carroll, 2020). Approximately 90% of P flux from WWTWs is SRP, while P used in agricultural fertilisers tends to attach to soil particles and is predominately transported to rivers with surface runoff as 'bound, unavailable P (Harding, 2015; Berg et al., 2018). There was a weak inverse linear relationship between flow and the proportion of SRP in TP (Spearman's rho = -0.312, p-value = 0.0001). This suggests that WWTW effluent influxes are diluted during high-flow events.
Secondly, there was no significant relationship between TP concentration and flow at the Crocodile River inflow site (p(F) of the linear regression model = 0.682; Spearman Rank correlation coefficient = -0.380, p-value = 0.0001). As fertilisers are transported to rivers during storm events, one would expect nutrient inputs from agricultural runoff to be correlated with flow. The lack of correlation suggests that periods of high flow are diluting pollutants already in the river, rather than increasing dissolved nutrient loading, suggesting that agricultural fertilisers are not a major source of nutrients in the Crocodile River. The absence of a significant trend in average monthly flow from June 2010 until March 2018 (seasonal Mann-Kendall trend test p-value = 0.319, n = 94) also indicates that the increasing influx trend is not caused by an increase in flow. Conversely, a significant but weak relationship between flow and concentration at the Magalies River (p(F) of the linear regression model = 0.004; Spearman Rank correlation coefficient = 0.333, p-value = 0.0001), indicates that nutrient influx in the Magalies catchment may originate primarily from agricultural runoff. However, inputs from the Magalies River contribute only a negligible proportion of the dam's total nutrient budget. Average dissolved nutrient concentrations in the Magalies River were 0.1 mg-L-1 TP and 1.9 mg-L-1 TN, compared to 1.2 mg-L-1 TP and 9.3 mg-L-1 TN in the Crocodile River, with corresponding median flow rates of 0.4 m3-s-1 and 12.8 m3-s-1 from June 2010 to April 2018.
Thirdly, inflows display a suppressed seasonal pattern, while outflows (i.e. opening sluices) are managed in accordance with seasonal irrigation needs. This further indicates that WWTWs are a major source of nutrients to Hartbeespoort as one would expect nutrient influx trends to mimic rainfall pattern trends in agriculturally stressed catchments.
The fourth indicator is the exceptionally high E. coli counts in the major rivers flowing from Johannesburg (Dube et al., 2017). This indicates faecal contamination sources along the inflowing rivers that inevitably make their way into Hartbeespoort.
Biomass removal (outflux) estimations
Water hyacinth harvesting amounted to average annual removal of between 0.7 and 12.5 t P, and 6.2 to 68.3 t N (Table 4), with 'best estimates' of 2.1 t P and 11.5 t N, based on the mean yields using the upper limit of the more likely hyacinth density, 168 kg-m-3. Algal harvesting amounted to average annual removal of between 1.3 and 57 t P, and 13.3 to 576 t N. A 'best estimate' of algal harvesting was 4 t P and 40 t N, based on the upper limit mean yields of the more likely algal concentration, Method 1. An estimated 3.6 t P and 20 t N is removed from the dam through fish biomass harvesting each year.
Other inputs and outputs
Denitrification outflux estimation
Based on areal denitrification rates given by Pina-Ochoa and Álvarez-Cobelas (2006), 28-1 042 t-a-1 N could be emitted to the atmosphere from the Hartbeespoort Dam. If 54% of the 2010/11 to 2016/17 TON influx was denitrified, 1 600 t-a-1 N would have left the dam through denitrification. Given the literature-review findings, an estimated 1 000-1 600 t-a-1 N could leave the dam through denitrification.
N fixation influx estimation
The areal N fixation rates of eutrophic lakes from Howarth et al. (1988) equate to 3.8-174.8 t-a-1 for Hartbeespoort Dam, based on its area alone. Applying the lower end of this N fixation range to the non N-limited Hartbeespoort Dam provides an estimate of 0-4 t-a-1 N for this system.
Atmospheric deposition influx estimation
The wet + dry atmospheric deposition rates equate to respective inputs of 1.2 t-a-1 P and 16-38 t-a-1 N to the surface area of the dam. Anthropogenically modified locations have N deposition rates in the upper range (Galy-Lacaux, 2003).
Groundwater influx and outflux estimation
Groundwater nutrient outfluxes were estimated using the findings of Leketa et al. (2018) of a net loss of 2 000 000 m3 from the dam and assumed nutrient concentrations matching those of the outflow canals. Groundwater nutrient influx is assumed to be included in river flows. Groundwater outflux estimates were 8.7 t N and 0.8 t P.
Sedimentation and overall mass balance
Conceptual diagrams of nutrient mass balances are shown in Fig. 7. Sedimentation rates were assumed to be the difference between all other flux estimates (Eq. 1), using best estimates. Approximately 349 t P and 1 150 t N were sedimented annually in Hartbeespoort from 2010 until 2017. However, given the uncertain influences of denitrification, the N sedimentation rate could be as low as 550 t-a-1.
Limitations
Reliable load estimates heavily depend on monitoring frequency - continuous monitoring being optimal (Cassidy and Jordan, 2011). Without continuous monitoring (as here), annual flux determinations are inexact. However, limited water quality readings at high flow may not be of significance in flux calculations in the case of Hartbeespoort because of the lack of correlation between flow and concentration. The fortnightly flux calculation method better reflects mean flows (Table 1). This justifies the method as the most accurate means of determining flux. River influx estimates do not include inputs from the Swart Spruit and the golf courses adjacent to Hartbeespoort Dam. These inputs contribute <1% to the total influx (Mitchell and Crafford, 2016).
CONCLUSIONS
Average inputs of 582 t-a-1 TP and 4687 t-a-1 TN from the Crocodile and Magalies Rivers reached Hartbeespoort Dam each year during hydrological years 2010/11 to 2016/17. This is almost double the P influx estimated by the Institute of Natural Resources in 2010 (INR, 2010). Despite differences in methods, this study closely matches the results from Mitchell and Crafford (2016) for the overlapping period 2010/11, but indicates a major increase in influxes in the later years covered by this study. Harding (2008) found that Hartbeespoort showed a long-term decreasing trend in P. Thus the increasing nutrient flux is a recent trend, and a reversal of earlier improvements made. This must be due at least in part to effluent from an increasing urban population, the population of Johannesburg having increased by 1.4 million between 2007 and 2017 (GCRO, 2019). It is therefore essential that local authorities upgrade and maintain wastewater systems to cope with the added pressure from population increase.
The release of dissolved P from the sediment-water interface plays a major role at Hartbeespoort. This is attested by the high P load and the findings of NIWR (1985) which, using sediment traps, demonstrated that gross P deposition flux to the sediment exceeded the total annual P load by almost three times, highlighting the role of nutrient resuspension at Hartbeespoort (Hupfer and Lewandowski, 2008). An average of 360 t P and 2 230 t N per annum was therefore 'retained + removed', i.e., either stored in the sediment or biomass, or removed from the dam via biomass harvesting, groundwater flows or denitrification (for N) (Fig. 7). However, nutrient influxes are increasing at a faster rate than outfluxes (Fig 6). Nutrient influx increased by 77.8 t-a-1 TP and 456 t-a-1 TN, while outflux increased by 28.4 t-a-1 TP and 110 t-a-1 TN. This indicates that nutrient storage in the dam is increasing, with detrimental implications of unknown severity for the ecology, water quality and trophic status of the dam. Biomass harvesting removes a very small proportion of P and N from the dam; at best, the equivalent of 1% of the P input and 1.1% of the N input to the dam. In the long term, lake bottom sediments act as a sink of nutrients, and not a source (Peimin et al., 2000). Based on this mass balance study (and acknowledging the large uncertainties in estimating sedimentation by difference) it is very likely that by far the largest portion of incoming P was sedimented. This has important management implications: in the short term, resuspension will affect symptoms of eutrophication in the dam but in the long term much of the P influx will sediment out of the water column and be buried at the lake-bottom. However, resuspension plays an increased role in lakes with increased nutrient loading (Hupfer and Lewandowski, 2008). This suggests that the increasing nutrient input trend is not sustainable as nutrient concentrations in the water column and sediments are likely to increase accordingly, exacerbating the harmful and undesirable effects of eutrophication. The in-lake fate of N is also poorly understood, but by far the largest proportions of overall retention + removal in the dam are due to denitrification and sedimentation fluxes, with up to half of this N (1 150 t-a-1) being sedimented.
The desired load to Hartbeespoort to achieve the threshold of the boundary between mesotrophic and eutrophic conditions is 68 t P per annum (Mitchell and Crafford, 2016). In order to achieve this condition, a load reduction of at least 88% is required, based on the average annual inputs calculated in this paper. 'Minimising waste generation at source is a central tenet of South Africa's Pollution Control and Waste Management legislation' (Harding, 2015 p. iv). Reducing N and P flux to Hartbeespoort from leaking and overflowing sewers and WWTWs is the only long-term solution to controlling the eutrophication problem at Hartbeespoort. This will be an expensive operation as the cost of upgrading all WWTWs in the Hartbeespoort catchment to the desired effluent specification of 0.15 mg-L-1 P has been estimated at over 2 billion ZAR (Mitchell and Crafford, 2016). The cost of reducing nutrient load from diffuse sources, including the rehabilitation of failing pump stations and refurbishment of sewers is estimated to cost a further 1.5 billion ZAR (Mitchell and Crafford, 2016). In comparison, 159 million ZAR was spent on bioremediation over the 10-year life of the Metsi a Me programme (Mitchell and Crafford, 2016). The bioremediation approaches of the Metsi a Me programme may have achieved some localised improvements in terms of wildlife habitat, clearing water hyacinth to allow water-based activities, and water quality, but the mass balance approach used here demonstrates that biomass removal fluxes are small compared to the input fluxes and make a very minor contribution to nutrient removal from the dam.
ORCIDS
ASD Carroll
https://orcid.org/0000-0001-7368-1191
CJ Curtis
https://orcid.org/0000-0002-6597-2172
REFERENCES
AHLGREN I, SORNSSON F, WAARA T and VREDE K (1994) Nitrogen budgets in relation to microbial transformations in lakes. R. Swed. Acad. Sci. 23 (6) 367-377. [ Links ]
AKENDO ICO, GUMBE LO and GITAU AN (2008) Dewatering and drying characteristics of water hyacinth (Eichhornia crassipes) Petiole. Part II. Drying characteristics. Agric. Eng. Int. CIGR J. X (March) FP 07 033. [ Links ]
ANDERSON DM, GLIBERT PM and BURKHOLDER JM (2002) Harmful algal blooms and eutrophication: Nutrient sources, composition, and consequences. Estuaries. 25 (4) 704-726. https://doi.org/10.1007/bf02804901 [ Links ]
BAGNALL LO (1982) Bulk mechanical properties of water hyacinth. J. Aquat. Plant Manage. 20 (1) 49-43. [ Links ]
BERG M, MEEHAN M, FRANZEN D and SCHERER T (2018) Phosphorus behavior in the environment - publications. Ag.ndsu. edu. https://www.ag.ndsu.edu/publications/environment-natural-resources/phosphorus-behavior-in-the-environment (Accessed 21 November 2019). [ Links ]
BOTHA FJ (2015) Nutrient reduction options in Hartbeespoort Dam catchments to lower in-dam eutrophication status. MSc thesis, North-West University. [ Links ]
BOYD CE (1976) Accumulation of dry matter, nitrogen and phosphorus by cultivated water hyacinths. Econ. Bot. 30 (1) 51-56. https://doi.org/10.1007/bf02866784 [ Links ]
CANAVAN K, PATERSON ID, LAMBERTINI C and HILL MP (2018) Expansive reed populations-alien invasion or disturbed wetlands? AoB Plants. 10 (2). https://doi.org/10.1093/aobpla/ply014 [ Links ]
CARROLL ASD (2020) A re-analysis of nutrient mass balances at the Hartbeespoort Dam. Unpublished Masters research report, GAES, University of the Witwatersrand. URL: https://hdl.handle.net/10539/30154 [ Links ]
CASSIDY R and JORDAN P (2011) Limitations of instantaneous water quality sampling in surface-water catchments: Comparison with near-continuous phosphorus time-series data. J. Hydrol. 405 (1-2) 182-193. https://doi.org/10.1016/j.jhydrol.2011.05.020 [ Links ]
CHISLOCK MF, DOSTER E, ZITOMER RA and WILSON AE (2013) Eutrophication: causes, consequences, and controls in aquatic ecosystems. Nat. Educ. Knowl. 4 (4) 10. [ Links ]
CHUTTER F (1989) Evaluation of the impact of 1 mg l-1 phosphate-P standard on the water quality and trophic state of Hartbeespoort Dam. WRC Report No. 181/1/89, pp.69. Water Research Commission, Pretoria. [ Links ]
CHUTTER F and ROSSOUW J (1991) The management of phosphate concentrations and algae in Hartbeespoort Dam. WRC Report No 289/1/91. Water Research Commission, Pretoria. xii + 37 pp. [ Links ]
COLMAN J and SANTHA C (1988) Critical concentrations of tissue nitrogen and phosphorus for growth rate and yield in the freshwater blue-green alga Microcystis aeruginosa Kütz. in the tropics. Aquat. Bot. 32 (1-2) 167-177. https://doi.org/10.1016/0304-3770(88)90096-4 [ Links ]
DWS (Department of Water and Sanitation, South Africa) (2019) Department of Water and Sanitation National Water Management System data. http://www.dwa.gov.za/iwqs (Accessed 31 July 2018). [ Links ]
DWAF (Department of Water Affairs and Forestry, South Africa) (1992) Analytical Methods Manual TR 151. Department of Water Affairs and Forestry, Pretoria. URL: http://www.dwaf.gov.za/iwqs/reports/tr/TR_151_1992_Analytical_methods_manual.pdf (Accessed 1 April 2018). [ Links ]
DHEC (DH Environmental Consulting) (2004) Final Report (Volume I). Hartbeespoort Dam Remediation Project (Phase 1). Department ofAgriculture, Conservation, Environment and Tourism of the North West Province Government, p.26. http://www.dwa.gov.za/Harties/documents/ActionPlanVol1Oct04full.pd (Accessed 9 May 2018). [ Links ]
DUBE R, MAPHOSA B, MALAN A, FAYEMIWO D, RAMULONDI D and ZUMA T (2017) Response of urban and peri-urban aquatic ecosystems to riparian zones land uses and human settlements: a study of the rivers, Jukskei, Kuils and Pienaars. WRC Report No. 2339/1/17. Nxt2u (Pty) Ltd. Water Research Commission, Pretoria. [ Links ]
FINLAY J, SMALL G and STERNER R (2013) Human influences on nitrogen removal in lakes. Science. 342 (6155) 247-250. [ Links ]
GALY-LACAUX, C, AL OURABI H, GALLOWAY JN, LACAUX JP, MPHEPYA J, PIENAAR K, PONT V, SIGHA L and YOBOUÉ V (2003) Dry and wet atmospheric nitrogen deposition in Africa. IGAC Newsl. 27 6-11. [ Links ]
GCRO (Gauteng City-Region Observatory) (2019) Water security perspective for the Gauteng City-Region. [online]. Gauteng Provincial Government, Johannesburg. p.3. https://www.gcro.ac.za/m/documents/GCR_Water_Security_Perspective_for_web_2019.pdf (Accessed 7 April 2020). [ Links ]
Google Earth (2019) Google Earth and Maxar Technologies. URL: https://www.google.com/earth/ (Accessed 1 April 2020). [ Links ]
HARDING WR (2008) The determination of annual phosphorus loading limits for South African dams. WRC Report No. 1687/1/08. Water Research Commission, Pretoria. ISBN 987-1-77005-866-6 [ Links ]
HARDING WR (2015) A feasibility study of the total maximum daily (pollutant) load (TMDL) approach for managing eutrophication in South African Dams. Water Research Commission, Pretoria. ISBN: 978-1-4312-0673-5 [ Links ]
HART RC (2006) Food web (bio-)manipulation of South African reservoirs - viable eutrophication management prospect or illusory pipe dream? A reflective commentary and position paper. Water SA. 32 (4) 567-575. https://doi.org/10.4314/wsa.v32i4.5281 [ Links ]
HART RC and HARDING WR (2015) Impacts of fish on phosphorus budget dynamics of some SA reservoirs: evaluating prospects of 'bottom up' phosphorus reduction in eutrophic systems through fish removal (biomanipulation). Water SA. 41 (4) 432. https://doi.org/10.4314/wsa.v41i4.01 [ Links ]
HART RC and MATTHEWS MW (2018) Bioremediation of South Africa's hypertrophic Hartbeespoort Dam: evaluating its effects by comparative analysis of a decade of MERIS satellite data in six control reservoirs. Inland Waters. 8 (1) 96-108. https://doi.org/10.1080/20442041.2018.1429068 [ Links ]
Rand Water (2012) Hartbeespoort Dam Integrated biological remediation programme: Phase I Progress Report, September 2012. Rand Water, Glenvista, 77 pp. [ Links ]
HOWARTH RW, MARINO R, LANE J and COLE JJ (1988) Nitrogen fixation in freshwater, estuarine, and marine ecosystems. 1. Rates and importance. Limnol. Oceanogr. 33 (4) 669-687. https://doi.org/10.4319/lo.1988.33.4part2.0669 [ Links ]
HU W (2014) Dry weight and cell density of individual algal and cyanobacterial cells for algae. MSc thesis, University of Missouri-Columbia. [ Links ]
HUPFER M and LEWANDOWSKI J (2008) Oxygen controls the phosphorus release from lake sediments - a long-lasting paradigm in limnology. Int. Rev. Hydrobiol. 93 (4-5) 415-432. https://doi.org/10.1002/iroh.200711054 [ Links ]
INR (Institute of Natural Resources) (2010) Investigation of the positive and negative consequences associated with the introduction of zero-phosphate detergents into South Africa. WRC Report No. TT 446/10. Water Research Commission, Pretoria. ISBN 978-1-77005946-7 [ Links ]
JUDEEL G DU T and HARTMANN AW (2008) Ground support at Crocodile River Mine located in the Brits graben of the western limb of the Bushveld Complex. In: Abstracts, 6th International Symposium on Ground Support in Mining and Civil Engineering Construction, 30 March - 3 April 2008, Cape Town DOI:10.13140/RG.2.1.1006.7689 [ Links ]
KHAN M and MOHAMMED F (2014) Eutrophication: challenges and solutions. In: Ansari AA, Gill SS (eds) Eutrophication: causes, consequences and control. Springer, Dordrecht. 1-15. ISBN 978-94-007-7814-6 [ Links ]
KIM, Y and KIM W (2000) Roles of water hyacinths and their roots for reducing algal concentration in the effluent from waste stabilization ponds. Water Res. 34 (13) 3285-3294. https://doi.org/10.1016/S0043-1354(00)00068-3 [ Links ]
KIRCHNER JW, FENG X, NEAL C and ROBSON AJ (2004) The fine structure of water-quality dynamics: the (high-frequency) wave of the future. Hydrol. Process. 18 (7) 1353-1359. https://doi.org/10.1002/hyp.5537 [ Links ]
LEKETA K, ABIYE T and BUTLER M (2018) Characterisation of groundwater recharge conditions and flow mechanisms in bedrock aquifers of the Johannesburg area, South Africa. Environ. Earth Sci. 77 (21) 727. http://doi.org/10.1007/s12665-018-7911-7 [ Links ]
LONG BM, JONES GJ and ORR PT (2001) Cellular microcystin content in N-limited Microcystis aeruginosa can be predicted from growth rate. Appl. Environ. Microbiol. 67 (1) 278-283. https://doi.org/10.1128/aem.67.1.278-283.2001 [ Links ]
MITCHELL SA and CRAFFORD JG (2016) Review of the Hartbeespoort Dam Integrated Biological Remediation Programme (Harties Metsi a Me). WRC Report No. KV 357/16. Water Research Commission, Pretoria. ISBN 978-1-4312-0803-6. [ Links ]
MONCHAMP M, PICK FR, BEISNER BE and MARANGER R (2014) Nitrogen forms influence microcystin concentration and composition via changes in cyanobacterial community structure. PLoS ONE. 9 (1) e85573. https://doi.org/10.1371/journal.pone.0085573 [ Links ]
MURPHY S (2007) BASIN: General information on phosphorus. Bcn. boulder.co.us.http://bcn.boulder.co.us/basin/data/NEW/info/TP.html (Accessed 7 Nov. 2019). [ Links ]
NIWR (National Institute for Water Research) (1985) The Limnology of the Hartbeespoort Dam. South African National Scientific Programmes Report No. 110. NIWR, Pretoria. [ Links ]
OLOLO G (2013) A limnological study of the factors affecting algal biodiversity in the Hartbeespoort Dam. MSc dissertation, University of Johannesburg. [ Links ]
PACYNA JM (2008) Atmospheric deposition. In: J0rgensen SE and Fath BD (eds) Encyclopedia of Ecology. Elsevier B.V., Amsterdam. [ Links ]
PARK JBC and CRAGGS RJ (2011) Nutrient removal and nitrogen balances in high rate algal ponds with carbon dioxide addition. Water Sci. Technol. 63 (8) 1758-1764. https://doi.org/10.2166/wst.2011.114 [ Links ]
PEIMIN P, GUOXIANG W, CHUNHUA H, WEIPING H and CHENGXIN F (2000) Can we control lake eutrophication by dredging? J. Lake Sci. 12 (3) 269-279. https://doi.org/10.18307/2000.0312 [ Links ]
PINA-OCHOA E and ÁLVAREZ-COBELAS M (2006) Denitrification in aquatic environments: a cross-system analysis. Biogeochemistry. 81 (1) 111-130. https://doi.org/10.1007/s10533-006-9033-7 [ Links ]
RAMSEYER LJ (2002) Predicting whole-fish nitrogen content from fish wet weight using regression analysis. N. Am. J. Aquacult. 64 (3) 195-204. https://doi.org/10.1577/1548-8454(2002)064<0195:pwfncf>2.0.co;2 [ Links ]
ROSSOUW JN, HARDING WR and FATOKI OS (2008) A guide to catchment-scale eutrophication assessments for rivers, reservoirs and lacustrine wetlands. WRC Report No. TT 352/08. Water Research Commission, Pretoria. 21-23. ISBN: 978-1-77005-715-9. [ Links ]
ROUX SP, DE LANGE W and OELOFSE SHH (2010) The rising costs of both sewage treatment and the production of potable water associated with increasing levels of pollution in a portion of the Crocodile-West Marico water management area (a case study). URL: http://hdl.handle.net/10204/4209 (Accessed 7 November 2019). [ Links ]
SCHINDLER D (2006) Recent advances in the understanding and management of eutrophication. Limnol. Oceanogr. 51 (1) 356-363. [ Links ]
SEITZINGER S (1990) Denitrification in Aquatic Sediments. In: Revsbech N, S0rense J (eds) Denitrification in Soil and Sediment. Federation of European Microbiological Societies Symposium Series, vol 56. Springer, Boston, MA. [ Links ]
SKIBA U (2008) Denitrification. In: Jorgensen SE and Fath BD (eds) Encyclopedia of Ecology. Elsevier, Oxford (2008) 866-871. [ Links ]
SU W, SUN Q, XIA M, WEN Z and YAO Z (2018) The resource utilization of water hyacinth (Eichhornia crassipes [Mart.] Solms) and its challenges. Resources. 7 (3) 46. [ Links ]
TIPPING E, BENHAM S, BOYLE JF, CROW P, DAVIES J, FISCHER U, GUYATT H, HELLIWELL R, JACKSON-BLAKE L, LAWLOR AJ and co-authors (2014) Atmospheric deposition of phosphorus to land and freshwater. Environ. Sci.: Process. Impacts. 16 (7) 1608-1617. [ Links ]
VENTER P (2020) Personal communication, 3 March 2020. Mr Petrus Venter, Regional Director of Water Resource Management for the Department of Water Affairs and Forestry at Hartbeespoort Dam. [ Links ]
WAGNER SC (2011) Biological nitrogen fixation. Nat. Educ. Knowl. 3 (10) 15 [ Links ]
WILKINS B (2019) Deciphering soil nitrogen biogeochemical processes using nitrogen and oxygen stable isotopes. PhD thesis, Department of Chemistry, Purdue University. [ Links ]
 Correspondence:
Alexandra Carroll
Email: carroll.alexandrasd@gmail.com
Received: 17 April 2020
Accepted: 22 March 2021
APPENDIX
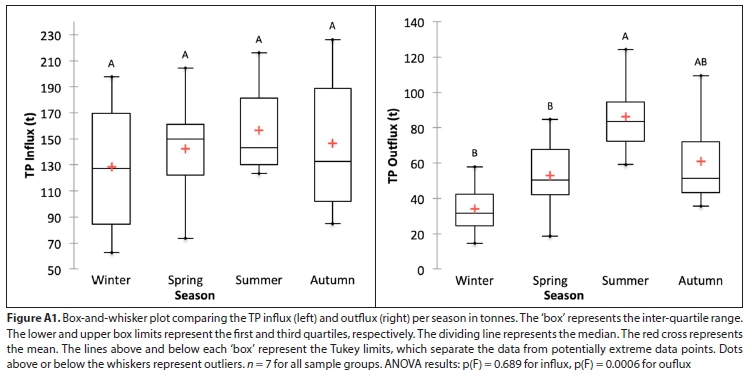
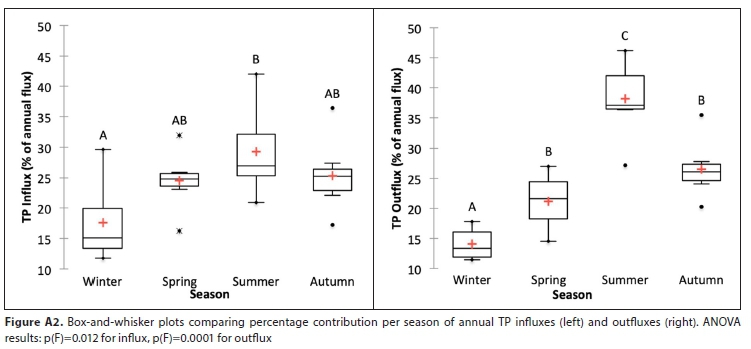
In absolute terms, while nutrient influxes do not differ significantly by season, outfluxes are seasonally more variable, and differ significantly between winter and summer (see Fig. A1). However, seasonal patterns are more apparent when fluxes per season are expressed (in relative terms) as a percentage of the annual flux, which removes both the confounding effects of year-to-year variations in absolute fluxes and the underlying increasing trends identified (Fig. A2). ANOVA tests for the relative values show that there are significant differences between the seasons (mainly between winter and summer) within each year for both influx and outflux, although this difference is slightly more pronounced in the outflux (see Fig. A2).

