


Servicios Personalizados
Articulo
 Inglés (pdf)
 Articulo en XML
 Referencias del artículo
Indicadores

Links relacionados
-
 Citado por Google
 -
 Similares en Google
Compartir

 Permalink
Water SA
versión On-line ISSN 1816-7950
versión impresa ISSN 0378-4738
Water SA vol.47 no.2 Pretoria abr. 2021
http://dx.doi.org/10.17159/wsa/2021.v47.i2.10914
RESEARCH PAPER
The effect of veld fires on the hydrological response of streamflow
JA du Plessis; H van Zyl
Department of Civil Engineering, University of Stellenbosch, P/Bag X1, Matieland 7602, South Africa
ABSTRACT
Veld fires are natural occurrences with the potential to impact thousands of hectares of vegetation, and in doing so, changes soil characteristics, for both urban and rural areas. It is therefore reasonable to assume that the hydrological response of a catchment could be affected by fire. The main aim of this research was to investigate the hydrological changes caused by fire on a catchment scale using a case study. On 9 March 2015, a wildfire which started in Jonkershoek nature reserve destroyed indigenous fynbos vegetation and afforested areas. Within the nature reserve, there are multiple rainfall and runoff stations, which provided a means of measuring any possible hydrological changes due to these fire events. Four catchments were used for this research, one main catchment (fynbos area) and three sub-catchments (afforested areas). Fifty-six percent of the main catchment burned, while two sub-catchments were completely burned and the other primarily unaffected by the fire. The main catchment's hydrological response was analysed by comparing the hydrographs of comparable pre- and post-fire runoff events. Eighteen comparable events were used for the analysis. The mean runoff volume increased by approximately 7% after the fire and mean peak flow by 50%. The change was even more noticeable when comparing the two sub-catchments affected by the veld fire and the unburned sub-catchment with each other. All the sub-catchments were similar in size and were located close enough to each other to be represented by one rainfall station. Before the fire, the average daily streamflows between the unburned (control) and burned catchments were similar; however after the fire the average daily streamflow of the two burned catchments in comparison to the control catchment increased by 45% and 50%, respectively. The mean runoff volume from the two affected/burned catchments, after the fire, for individual events increased by approx. 72% and 52% in comparison to the control catchment. The mean peak flows increased by approximately 173% and 110% in comparison to the control catchment.
Keywords: hydrological change; fire; runoff response; fire-induced soil water; repellency; soil burn
INTRODUCTION
In South Africa veld fires, with the subsequent resulting potential for flooding, are an annual occurrence in catchments. Some of these catchments drain into channels which flow through urban areas. The peak flow expected in these channels is calculated using methods such as the Rational method or the Soil Conservation Service method (SCS). These deterministic methods take into consideration certain catchment characteristics such as the catchment size, the average slope of the longest watercourse, type of vegetation cover and type of soil. The effect that fire has on the runoff is difficult to quantify and generally not taken into consideration when conducting a hydrological analysis. When a fire event occurs in a catchment, it destroys vegetation and burns the soil, which may affect the infiltration capacity of the soil, which could mean an increase in overland flow and flow peaks. Fire has the ability to hinder the process of infiltration and percolation (the movement of water through soil), not only by destroying the root systems of vegetation, but also through changing the characteristics of the soil. The heat from a fire can change the chemical, physical and biological properties of the soil (Wagenbrenner, 2013). A key physical change occurs when fire creates or expands a pre-existing water repellent layer in the top layers of the soil. This process is referred to as fire-induced soil water repellency (DeBano, 2000). Soil water repellency is a reduction in the rate of wetting and retention of water in soil, caused by the presence of hydrophobic coatings on soil particles. Water-repellent soils decrease the rate of infiltration and percolation in soil, which can increase overland flow (DeBano, 2000; Scott, 1993) significantly.
A classification system, which categorises the changes in the soil according to the level of soil burn severity, has been developed by the United States Department of Agriculture (USDA)(Parsons et al., 2010). The soil-burn severity index was created by empirical observations of different vegetation types with varying densities. Table 1 displays such a classification matrix, redrawn from Parsons et al. (2010), of the different vegetation types with their varying densities.

While most of the vegetation types will produce a low soil burn severity for a particular density, only certain types of vegetation will be capable of reaching a high enough soil temperature to cause a correspondingly high level of soil burn severity and in turn fire-induced soil water repellency as highlighted in Table 1.
While it is not the purpose of this paper to review or explain the complexity of the impact of veld fires on soil characteristics and the associated effect of water repellence, DeBano (2000) provided an extensive background towards the research done on the topic.
This research investigates the effect that fire has on the hydrological response at a catchment scale with two different types of vegetation covers (fynbos and forested areas) and to determine whether the fire event had a significant influence on the runoff in these catchments.
Catchment description
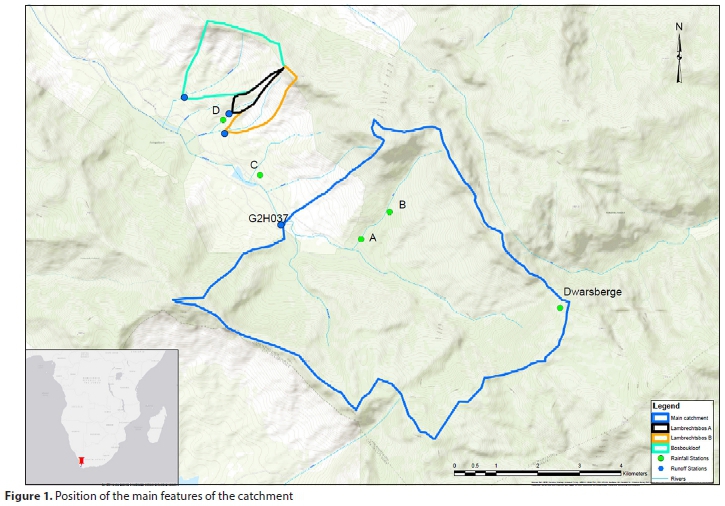
The research was undertaken in four gauged catchments, comprising of one main catchment and three different smaller catchments in close proximity, referred to as sub-catchments in this paper, inside the Jonkershoek Nature Reserve, which is located in the Western Cape region of South Africa (33°57' S, 18°15' E).
The climate in Jonkershoek is generally mild, with hot dry summers and wet cold winters. The majority of precipitation occurs between April and October, with rainfall events being generally of low intensity and long duration. The Jonkershoek area receives a mean annual precipitation (MAP) of more than 1 200 mm a year.
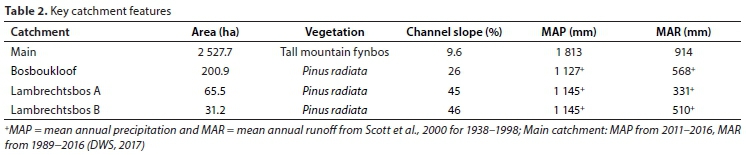
The vegetation in Jonkershoek is predominantly fynbos; the reserve also contains afforested areas. Fynbos is the indigenous vegetation cover in the area, which is a sclerophyllous scrub dominated by Ericaceae, Proteaceae and Restionaceae (Scott, 1994). The control and burned sub-catchments were predominantly afforested with the exotic tree species, Pinus radiata. Key features of each catchment are summarised in Table 2.
With reference to Table 2, the MAP for the three sub-catchments (Bosboukloof, Lambrechtsbos A and B) for the period 2011 to 2016, were calculated to vary between 800 and 815 mm/a, indicating a period of below-average rainfall.
The main catchment is much larger than the sub-catchments and its channel slope is also less steep, as illustrated in Fig. 1.
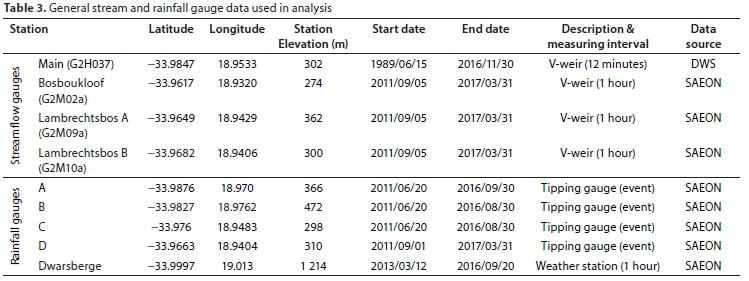
Table 3 provides further information on the stations used in the analysis.
Jonkershoek fire
On 9 March 2015, a high intensity wildfire started in Jonkershoek, which lasted 5 days and ended on 13 March 2015. The fire destroyed more than 4 000 ha of both indigenous fynbos and afforested areas.
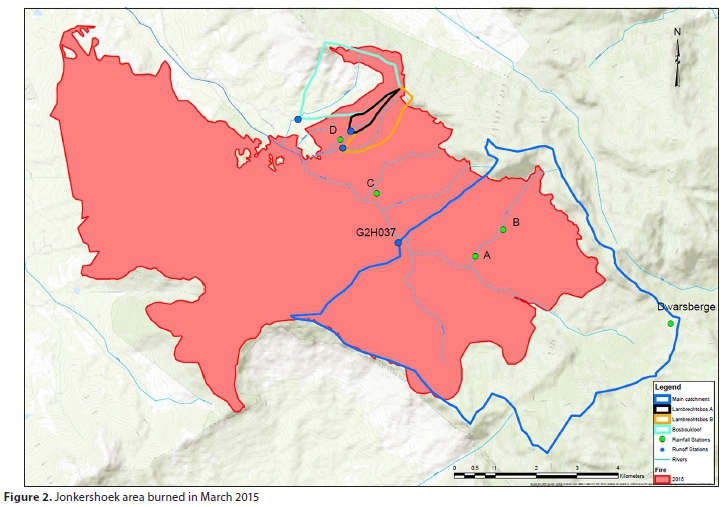
Figure 2 illustrates the extent of the fire event. The main catchment was partially burned (56%), while two of the sub-catchments (Lambrechtsbos A and B) were completely burned. Bosboukloof, the third sub-catchment, was largely unaffected by the fire with only 30% of the area burned and was therefore used as a control catchment.
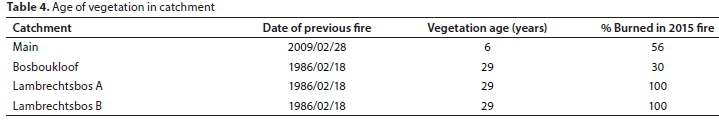
Table 4 presents the average age of the vegetation for each catchment and the percentage burned during the fire event in 2015.
METHODS
The analyses of the main catchment and sub-catchments required different approaches. The method for analysing the main catchment was by comparing pre- and post-fire events in the main catchment as well as observing any changes in the long-term streamflow.
The events had to have similar rainfall within a similar time frame in order to be comparable. Finding comparable rainfall events before and after the fire event, however, proved to be difficult, since key features of the events have to be comparable. Two rainfall events that both delivered the same quantity of precipitation, but within different time spans were not considered to be comparable events. One event will have a shorter duration which results into a greater rainfall intensity, while the other has a longer duration, but a lower intensity. The volume of runoff from these events would thus differ even if the topographic characteristics were the same. Therefore, only events that delivered rainfall within ±0.5 x mean standard deviation of its corresponding event and within the same duration were considered as comparable events. The same duration criteria were applied by grouping rainfall events for comparison purposes in four duration's categories, which was based on the statistical analysis of the rainfall event durations. Four groupings were use i.e. rainfall events from 4-12 h, 12-17 h, 17-26 h and 26-79 h.
Antecedent soil moisture conditions were calculated for each event, using an adaptation of the Antecedent Precipitation Index (API), as presented by Ali et al. (2010).
The API equation used in the analyses is presented in Eq. 1:
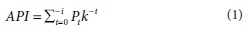
where: i is the number of antecedent days, k is the decay constant, Ptis precipitation during day t.
Viessman et al. (2002) found that 7 days (i = 7) is an adequate duration for determining the API and that the decay constant (k) usually ranges between 0.8 and 0.98. In this research the decay constant (k) was assumed to be 0.9 and i = 7 days.
Due to the limited amount of comparable rainfall events available, the antecedent moisture conditions before each of the events selected for evaluation were kept as close as possible to each other, but this did not necessarily prevent two events from being selected as comparable with each other. The decision as to whether or not to consider two events as comparable events was taken within the context of observing the baseflow differences between two events as well as the shape of the hydrograph resulting from the rainfall event.
Hydrographs were derived for pre- and post-fire rainfall events with the corresponding hyetographs. The runoff plot started 1 hour before rainfall was recorded, to observe the starting flow, and ended after the receding limb of the hydrograph flattened out.
The smaller catchments shared the same rain gauge and therefore runoff from rainfall events could be analysed and compared between the unburned and burned catchments.
Long-term streamflow events were analysed for the sub-catchments by comparing the runoff from the unburned (Bosboukloof) and burned (Lambrechtsbos A and B) sub-catchments, before and after the fire.
Double mass plot curves (Gao et al., 2017) were used to analyse long-term streamflow of the unburned and burned sub-catchments. Descriptive statistics were used in conjunction with plotted curves to observe the results from the analysis.
RESULTS AND DISCUSSION
Main catchment
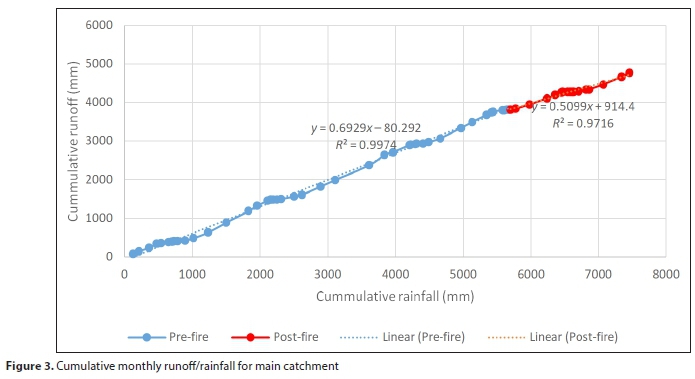
The analysis ofthe cumulative rainfall and cumulative runoff(double mass plots of monthly flow and rainfall) for the main catchment did not indicate any significant changes, when comparing the pre- and post-fire data, as illustrated in Fig. 3. The complete analysis period was from 20 June 2011 to 30 August 2016. The pre-burn was from 20 June 2011 to 9 March 2015 (44 months) and post-burn was from 16 March 2015 to 30 August 2016 (17 months).
When comparing the mean monthly runoff/rainfall ratio of the pre-and post-fire data, the ratio decreased from 67% to 54% after the fire. The decrease in the runoff/rainfall ratio indicates that fire did not influence the cumulative streamflow after the fire. It is however important to note that the mean monthly rainfall after the fire was 104 mm, while before the fire it was 123 mm. Although the mean rainfall was less after the fire than before, it was to be expected that the runoff/rainfall ratio should have shown an increase after the fire, due to the expected fire-induced water repellency of the soil.
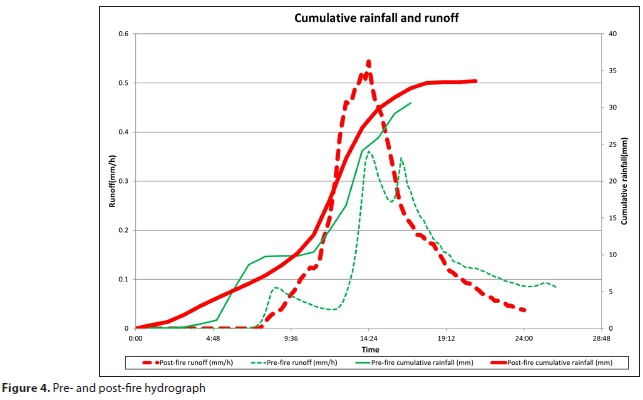
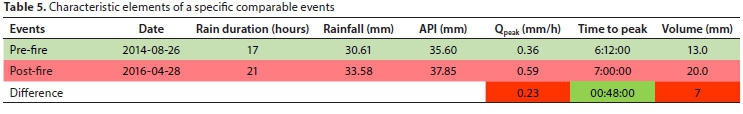
Comparable rainfall events were then analysed to determine whether there was any significant change in individual runoff events after the fires. Eighteen comparable rainfall events were identified, which met the requirements discussed in the methodology. Pre- and post-fire event hydrographs were then analysed. Figure 4 displays an example of a comparable pre- and post-fire hydrograph, together with the cumulative rainfall and runoff of each event. The elements of a typical rainfall and flow event that was produced are summarised in Table 5 for one such event.
Both events had approximately the same amount of rainfall, the same intensity and the same antecedent soil moisture values. The post-fire event, however, produced a peak flow of 0.59 mm/h, while the value of the pre-fire event was recorded as 0.36 mm/h. The peak flow from the post-fire event represents a 63% increase on that of the pre-fire event. A similar result was obtained when examining the volume of runoff with a 54% increase in runoff volume.
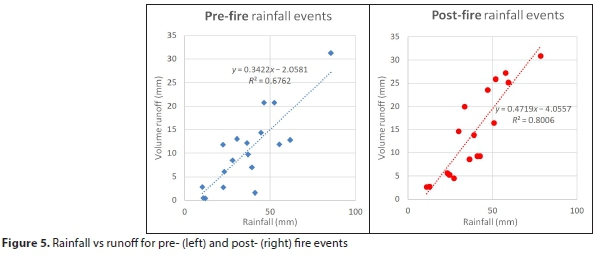
When comparing the mean runoff volume before and after the fire for the 18 comparable events, a mean increase of 6.8% of the runoff/rainfall ratio was determined after the fire. Figure 5 illustrates the rainfall vs runoff volume for the pre- and post-fire comparable events.
Figure 5 shows that the runoff response from rainfall after the fire is greater than before the fire. Using linear regression, the slope for the pre-fire rainfall events is 0.3422 with an R2 of 0.67, while after the fire the slope is 0.4719 with an R2 of 0.8006. The slope difference is 0.1297, which is a 37.9% increase in slope (ratio between rainfall and runoff) after the fire.
The mean peak flow for the 18 events before the fire was 0.22 mm/h, while after the fire the mean peak flow increased to 0.33 mm/h. Thus, after the fire the mean peak flow for the comparable events increased by 50%. The hydrological changes observed in the catchment due to the fire were on a partially burned catchment (56% was burned). The observed changes are likely to have been greater had the fire affected the whole catchment.
Sub-catchments
Double mass plots were used to identify changes in the accumulated streamflow between the burned (Lambrechtsbos A & B) and control (Bosboukloof) catchments. Figure 6 displays the double mass plot of accumulated daily streamflow (hourly flow rates converted to a daily volume in mm based on the different catchment areas) for the full dataset used (Sept 2011 till April 2017) for Lambrechtsbos A against Bosboukloof. Linear regression was used to illustrate the relationship before and after the fire.
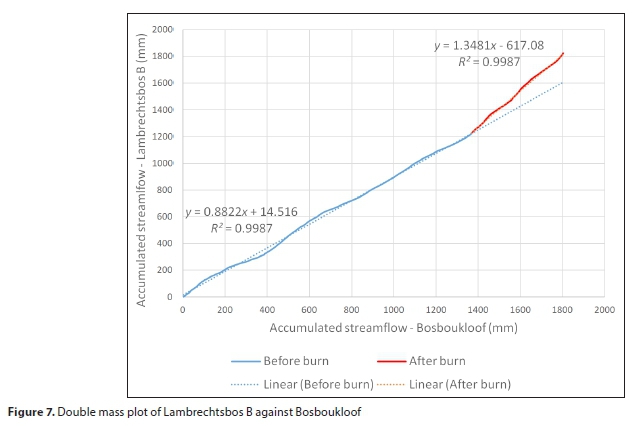
In Fig. 6 it is clear that the accumulated daily streamflow volume of the two catchments before the fire event was approximately the same; using linear regression to plot its trendline revealed that the slope was 1.00 before the fire, with a R2 of 0.9937. After the fire, however, the slope increased to 1.47 with an R2 of 0.9897 in favour of the burned catchment (Lambrechtsbos A). The increase in slope indicates that after the fire there was a greater volume of runoff occurring in the burned catchment (Lambrechtsbos A) in comparison to the control catchment (Bosboukloof). A similar double mass plot was constructed illustrating the effect between Lambrechtsbos B and Bosboukloof (Fig. 7).
In Fig. 7 the change in accumulated runoff volume after the fire was similar to that observed in Fig. 6. Before the fire, the slope was 0.8822 with an R2 of 0.9987, which indicates that more streamflow was generated in the control catchment (Bosboukloof) in comparison with Lambrechtsbos B for the same rainfall events. After the fire, however, the slope increased to 1.3481 with an R2 of 0.9987. The increase in slope for both Fig. 6 and Fig. 7 after the fire indicates that the fire event did have an impact on the accumulated streamflow for both affected catchments.
Table 6 displays the average daily runoff values for the control and affected catchments before the fire, the year after the fire, and the second year after the fire. Before the fire event, the average daily streamflow ratios between the burned and control catchments were approximately the same (1:1). After the fire, the streamflow responses changed substantially. One year after the fire the average daily runoff was 50% higher for Lambrechtsbos A and 45% higher for Lambrechtsbos B in comparison to Bosboukloof. The increase in runoff was sustained for the second year after the fire by similar amounts, with 51% for Lambrechtsbos B and 53% for Lambrechtsbos A (see Table 6).
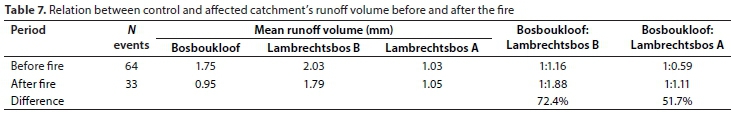
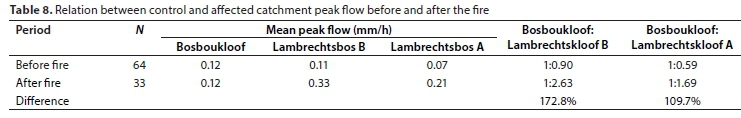
Specific rainfall events for the sub-catchments were also assessed for changes in streamflow dynamics, between the control and affected catchments; 97 rainfall events were used for the analysis - 64 rainfall events before the fire and 33 events after the fire. The mean duration and quantity of rainfall were greater in the pre-fire rainfall events than the post-fire rainfall events. The average intensity, however, stayed the same (±1.5 mm/h).
After the fire, the average runoff volumes produced by the rainfall events changed slightly for the affected catchments (2.03 mm to 1.79 mm for Lambrechtsbos B and 1.03 mm to 1.05 mm
for Lambrechtsbos A); however, the control catchments volume decreased from 1.75 mm to 0.95 mm. Table 7 displays the comparison between control and affected catchment runoff volumes before and after the fire.
Table 7 highlights that the mean runoff volume for both of the affected catchments increased after the fire in comparison to the control catchment, where it decreased. Lambrechtsbos B increased by 72.4% and Lambrechtsbos A by 51.7% in comparison to Bosboukloof.
The runoff peak flow values (expressed in mm/h) for the selected rainfall events displayed similar means before and after the fire for the control catchment. The mean peak flow values of both affected catchments, however, increased by 172.8% for Lambrechtsbos B and 109.7% for Lambrechtsbos A in relation to Bosboukloof, which can be observed in Table 8.
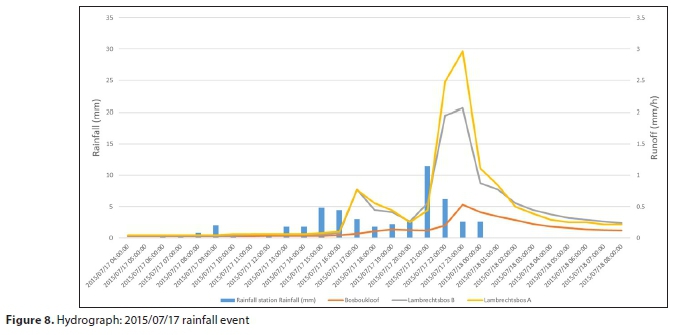
The biggest difference in hydrographs was observed due to a rainfall event that took place on 17 July 2015. Rainfall of 49.6 mm during a period of 19 h, with a peak intensity of 11.4 mm/h, was recorded. The soil moisture (API) was calculated as 15.75 mm before the event. Fig. 8 illustrates the hydrological responses of the sub-catchments due to the rainfall event in the form ofa hydrograph and hyetograph. Both affected catchments displayed similar runoff responses, forming double peaks with the highest peak approximately 2 mm/h, 14 hours into the event. The Bosboukloof sub-catchment however reached its peak flow at the same time as the affected catchments but only managed 0.56 mm/h as its peak flow. Both the affected sub-catchments thus produced peaks approximately 300% greater than the control catchment. The runoff volumes produced by the affected catchments were also greater than the control catchment. For this specific event, Bosboukloof produced 3.1 mm of runoff, while Lambrechtsbos B produced 10.2 mm and Lambrechstbos A, 7.5 mm.
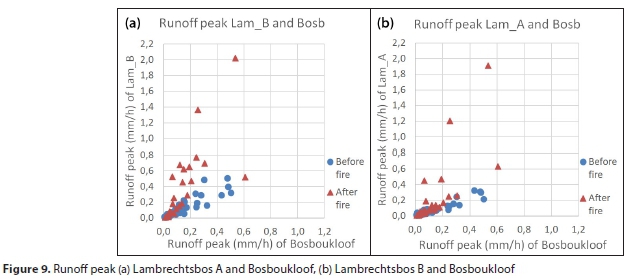
The runoff peaks from the affected catchments were plotted against the runoff peaks from the control catchment.
In Fig. 9 it can be seen that there was a significant increase in runoff peaks after the fire for the affected catchments (Lambrechtsbos A and B) in comparison to Bosboukloof.
CONCLUSION
Different analysis methods were used to establish whether fire had any hydrological impact on a catchment and its two sub-catchments, which were affected by fire in March 2015 in the Jonkershoek area. Fifty-six percent of the main catchment was burnt, while the vegetation in the two sub-catchments had been completely burned. The main catchment vegetation consisted primarily of indigenous tall mountain fynbos, while the sub-catchments were afforested catchments (Pinus radiata).
The main catchment showed no significant changes due to fire when observing long-term streamflow. The lack of change could be attributed to the decrease in average monthly rainfall from 123.39 mm to 104.41 mm, and that only 56% of the catchment was burnt. Scott (1994) found a 9.4% and 15.3% increase in long-term flow for a similarly vegetated (fynbos) catchment after a fire event; however, in his study both catchments were completely burned.
The streamflow responses of the main catchment during rainfall events were different after the March 2015 fire, when analysing 18 comparable rainfall events. The mean runoff/rainfall ratio increased by 6.8% after the fire in comparison to before the fire. Using linear regression, the runoff response to rainfall increased by 37.9% after the fire, using similar rainfall events. The mean peak flow increased by 50% after the fire for the analysed period (1.5 years).
The long-term runoff changed considerably for the afforested sub-catchments in comparison to the control sub-catchment. The first year after the fire the average daily runoff increased byapproximately 50% for Lambrechtsbos A (affected sub-catchment) in comparison to Bosboukloof (control sub-catchment), and 45% for Lambrechtsbos B (affected sub-catchment) in comparison to Bosboukloof.
The increase in flows (45% and 50%) within the first year after the fire is within the acceptable range of increase for similar-sized catchments from forested vegetation. Lane et al. (2006) reported a 65-94% increase in total flow for two catchments planted with Eucalyptus forest; the catchments were 136 ha and 244 ha in size.
The peak flow values displayed similar means before and after the fire for the control catchment. The mean peak flow values of both affected catchments, however, increased by approximately 173% for Lambrechtsbos B and 110% for Lambrechtsbos A, in relation to that of Bosboukloof after the fire. Scott (1993) reported a 290% increase in peak flow during the first year after a fire in a similarly vegetated catchment.
From the analysis it is clear that fire has the ability to impact on the hydrological response of a catchment, as illustrated in this case study. A general conclusion will only be possible with significantly more data, but it is clear that modellers need to be aware of the possible significant impacts of veld fires on the hydrological response of catchments.
ACKNOWLEDGEMENTS
The authors wish to thank the Department of Water and Sanitation and South African Environmental Observation Network (SAEON) for the use of their rainfall and runoff records.
REFERENCES
ALI S, GHOSH NC and SINGH R (2010) Rainfall-runoff simulation using a normalized antecedent precipitation index. Hydrol. Sci. J. 55 (2) 266-274. https://doi.org/10.1080/02626660903546175 [ Links ]
DEBANO LF (2000) Water repellency in soils: A historical overview. J. Hydrol. 231-232 4-32. https://doi.org/10.1016/S0022-1694(00)00180-3 [ Links ]
DWS (Department of Water and Sanitation, South Africa) (2017) Hydrological Services. URL: http://www.dwa.gov.za/Hydrology/ (Accessed 2 April 2017). [ Links ]
GAO P, LI P, ZHAO B, XU R, ZHAO G, SUN W and MU X (2017) Use of double mass curves in hydrologic benefit evaluations. Hydrol. Process. 31 (26) 4639-4646. https://doi.org/10.1002/hyp.11377 [ Links ]
LANE PNJ, SHERIDAN GJ and NOSKE PJ (2006) Changes in sediment loads and discharge from small mountain catchments following wildfire in south eastern Australia. J. Hydrol. 331 (3-4) 495-510. https://doi.org/10.1016/j.jhydrol.2006.05.035 [ Links ]
PARSONS A, ROBICHAUD PR, LEWIS SA, NAPPER C and CLARK JT (2010) Field guide for mapping post-fire soil burn severity. United States Department of Agriculture. General Technical Report RMRS-GTR-243. October 2010. https://doi.org/10.2737/RMRS-GTR-243 [ Links ]
SCOTT DF (1993) The hydrological effects of fire in south-african mountain catchments. J. Hydrol. 150 (2-4) 409-432. https://doi.org/10.1016/0022-1694(93)90119-T [ Links ]
SCOTT DF (1994) The hydrological effects of fire in South African catchments. Unpublished PhD thesis, University of Natal. [ Links ]
SCOTT DF, PRINSLOO FW, MOSES G, MEHLOMAKULU M and SIMMERS ADA (2000) A re-analysis of the South African catchment afforestation experimental data. WRC Report No. 810/1/00. Water Research Commission, Pretoria. [ Links ]
SANRAL (2013) Drainage Manual (6th edn.) South African National Roads Agency Limited, Pretoria. [ Links ]
VIESSMAN W, LEWIS GL and KNAPP JW (2002) Introduction to Hydrology. Pearson, USA. 780 pp. [ Links ]
WAGENBRENNER JW (2013) Post-fire stream channel processes: changes in runoff rates, sediment delivery across spatial scales, and mitigation effectiveness. PhD thesis. Washington State University. [ Links ]
 Correspondence:
JA du Plessis
Email: jadup@sun.ac.za
Received: 17 October 2019
Accepted: 14 April 2020

