


Services on Demand
Article
 English (pdf)
 Article in xml format
 Article references
Indicators

Related links
-
 Cited by Google
 -
 Similars in Google
Share

 Permalink
Water SA
On-line version ISSN 1816-7950
Print version ISSN 0378-4738
Water SA vol.47 n.2 Pretoria Apr. 2021
http://dx.doi.org/10.17159/wsa/2021.v47.i2.10913
RESEARCH PAPER
Assessing the frequency of drought/flood severity in the Luvuvhu River catchment, Limpopo Province, South Africa
SM MazibukoI, II; G MukwadaII, IV; ME MoeletsiI, III
IAgricultural Research Council - Institute for Soil, Climate and Water, Private Bag X79, Pretoria 0001, South Africa
IIAfromontane Research Unit, University of the Free State, Private Bag X13, Phuthaditjhaba, 9866, South Africa
IIIRisks and Vulnerability Assessment Centre, University of Limpopo, Private Bag X1106, Sovenga 0727, South Africa
IVDepartment of Geography & W.A. Franke College of Forestry & Conservation of the University of Montana, USA
ABSTRACT
The Luvuvhu River catchment experiences rainfall variability with a high frequency of extremely dry and wet conditions. Understanding the frequency of drought and floods in this catchment area is important to the agriculture sector for managing the negative impacts of these natural hazards. This study was undertaken to investigate the frequency and severity of drought/floods and linkages with the El Nino Southern Oscillation (ENSO) phenomenon. Poor and resource-limited small-scale farmers in the Luvuvhu River catchment area struggle to adjust due to decreasing crop yields and livestock mortality caused by drought and floods. Monthly rainfall data from 15 grid points (0.5° χ 0.5°) was used to compute the Standardised Precipitation Index (SPI) for the period between 1979 and 2016. The 3-month SPI was calculated for the December-January-February (DJF) period. The second half of the agricultural season was selected because the influence of ENSO is high during the late summer season (DJF) in the catchment. The SPI results indicate that the agricultural seasons 1982/83, 1991/92 and 2015/16 were characterised by extreme drought. Conversely, the SPI values also show that the wettest seasons were recorded in 1998/99 and 1999/00. The catchment experiences a high frequency of moderate to severe drought in the north and north-eastern parts. Spatially, the occurrence of moderate to severe dry conditions covers large areas in the north and south-western parts. Severe to extreme wet conditions cover large areas in the north and south-eastern parts of the catchment. The SST index (Nino 3.4) shows a strong influence on rainfall variability in the catchment, resulting in either dry or wet conditions. Therefore, this study recommends further research focusing on more climatic modes that influence rainfall variability, as well as further development of drought and flood forecasting to improve farmers' adaptations options and reliability of weather forecasts used as a tool to manage crop production.
Keywords: Standardised Precipitation Index; drought/flood frequency; rainfall; ENSO; Oceanic Nino Index
INTRODUCTION
The occurrence of drought and floods is common in the Luvuvhu River catchment (LRC), impacting negatively on crop production and agricultural income as a result of reduced crop sales, harvest failure and livestock mortality (Devereux, 2007; Mathivha et al., 2016). Rainfall variability can result in either drought or floods and affects agricultural production in especially rain-fed farming areas (Afifi et al., 2016; Kori et al., 2012; Murali and Afifi, 2014; Oseni and Masarirambi, 2011). Small-scale farmers in the LRC rely mainly on rainfed farming and are therefore highly vulnerable to frequent droughts and floods (Masupha and Moeletsi, 2018). Prolonged decreases in rainfall results in the occurrence of drought. Conversely, the abundance of rainfall may result in soil saturation and eventually heavy flooding (Muluneh et al., 2017). Therefore, there is a need to assess the frequency of drought and floods in order to raise awareness on the areas that are vulnerable to these natural hazards.
By their nature, droughts and floods are destructive, resulting in devastating impacts on crop production and livestock farming (Chhabra et al., 2016; Revilla-Romero et al., 2015). For instance, across the whole of southern Africa small-scale farmers who have limited access to irrigation systems struggle to maintain crop production during times of drought (Mkuhlani et al., 2019a; Ntombela et al., 2017), while they incur considerable losses during floods due to destruction of crop fields and increased livestock mortality after heavy rainfall (Newton et al., 2011; Serdeczny et al., 2017).
Rainfall in South Africa is influenced by the El Nino Southern Oscillation (ENSO) phenomenon, resulting in drought or floods (Odiyo et al., 2019; Tfwala et al., 2018). The ENSO phenomenon is the oscillation between warm phases (El Nino characterised by abnormal warming of surface ocean waters of the central and eastern Pacific) and a cold phase (referred to as La Nina characterised by abnormal cooling of the ocean waters) in the same region (Ganguli and Reddy, 2013; Saunders et al., 2017). Considering studies by Rapolaki et al. (2019), Crétat et al. (2019), Tfwala et al. (2018) and Manatsa et al. (2017), ENSO has been identified as the main driver of rainfall variability in southern Africa, making it a key determinant of drought and flood occurrence within this region. The relationship between ENSO and rainfall over southern Africa has been proven to be strong, but there are some ambiguities which still need to be clarified (Crétat et al., 2019). This is because the occurrence of below-average rainfall is not only associated with ENSO, since there are other weather systems that influence rainfall variability (Rapolaki et al., 2019). For example, rainfall variability in southern Africa is not always due to ENSO influence because the ocean-atmosphere interaction is also influenced by the concurrent occurrence of other weather systems (e.g. Southern Annular Mode) during either El Nino or La Nina phase (Manatsa et al., 2011).
In this study we used the SPI due to the index's simplicity because it uses only precipitation as input (Sobral et al., 2019). The SPI is flexible, making it possible to assess both dry and wet conditions. The index is standardized, which allows meaningful comparisons between locations of varying topography without bias (Cheval, 2015). The SPI can be computed at different time scales, from 1 to 24 months, which allows the assessment of hazards such as drought at different time scales. The SPI has been recommended by Guttman (1998), Ghaleb et al. (2015) and Othman et al. (2016) as the preferred index in drought and flood-related studies because it is simple and spatially consistent in its interpretation and probabilistic nature. The SPI was selected for the study due to the index's ability to assess both dry and wet conditions (Gebrehiwot et al., 2011; Rouault and Richard, 2003). The aim of the study was to assess the frequency and severity of drought and floods in order to identify areas that are more prone to extreme weather events in the LRC. The LRC is a resource-poor area with high unemployment and poverty rates, and the livelihoods of the majority of its population are largely dependent on subsistence farming and remittances (Masupha et al., 2016). Therefore, the occurrence of droughts and floods poses a serious threat to food security and household livelihoods (Devereux, 2007). Generating information about areas that are vulnerable to the impacts of these extreme weather events is important for development planners, water resource managers and government departments working in the LRC, because of its potential use for developing sound adaptation measures and effective relief programmes in this area.
DATA ACQUISITION AND METHODS
Study area
The LRC is located in the north-eastern part of the Limpopo Province of South Africa. It is situated in the Vhembe District Municipality (Fig. 1), and in the Limpopo River Basin, which is shared by four countries, namely, South Africa, Botswana, Mozambique and Zimbabwe (Trambauer et al., 2014). Geographically, the LRC is located between longitudes 29.49°E and 31.23°E and latitudes 22. 17°S and 23.17°S. Topographically, two mountain ranges exist in the catchment, the Drakensberg in the north and Soutpansberg in the south-east (Jewitt and Garratt, 2004). Within the LRC, topography strongly influences rainfall patterns, with the mean annual precipitation of450 mm received in the lowlying plains (northern and eastern parts) and more than 1 200 mm received in the mountainous areas in the south-western parts of the catchment (Masupha et al., 2016). Rainfall is largely seasonal and mostly occurs during summer months, between October and April (Nkuna and Odiyo, 2016).
Data
The SPI software was downloaded from the National Drought Mitigation Centre (NMDC) website (http//drought.unl.edu/M onitoringTools/DownloadableSPIProgram.aspx). The re-analysis rainfall data used in this study consists of gridded monthly rainfall data and sea surface temperature (SST) data in the Nino 3.4 region, provided by the Climate Research Unit (CRU TS4.01) and available online (https://climexp.knmi.nl/start.cgi). The gridded Climatic Research Unit (CRU) Time-Series (TS) version 4.01 data are month-by-month variations in climate produced by CRU at the University of East Anglia in conjunction with the World Meteorological Organization. The data that were used in this study covered a period of 37 years, from 1979 to 2016. The CRU datasets provide a consistent record of month-by-month variations in 9 climate variables: cloud cover, diurnal temperature range, frost day frequency, potential evapotranspiration (PET), precipitation, daily mean temperature, monthly average daily maximum and minimum temperature, and vapour pressure, for the period January 1901 - December 2018. The CRU TS4.01 data is based on angular-distance weighting (ADW) interpolation. The monthly gridded fields are based on monthly observational data calculated from daily or sub-daily data by National Meteorological Services and other external agents (Goddard and Dilley, 2005). The CRU data covers a long period of more than 50 years which is enough to conduct climate change related analysis (Mbiriri et al., 2018). The CRU data also contain climate and vegetation indices at a spatial resolution of 0.5° χ 0.5° and this data is useful for analysing the impacts of natural hazards (e.g. drought) on agriculture and food security (Kottek et al., 2006). The data provide historical and recent data records which are useful for analysing recent climate anomalies. The CRU use meteorological stations to produce monthly grid data, especially for remote areas which are sometimes impossible to obtain data for, a situation quite common in developing countries (Mbiriri et al., 2018). In contrast, even though the CRU TS data covers a long period, the data is not suitable for monitoring climate change trends at global level. However, the CRU TS data is suitable for regional and sub-region analysis (Harris et al., 2020). The spatial resolution of 0.5° χ 0.5° is high, but it could be sparse for analysing changes in rainfall which changes over short distances. CRU re-analyses the data and updates it often and this could induce errors in estimating the climate data, though the errors have been reported as insignificant in many regions (Mbiriri et al., 2018).
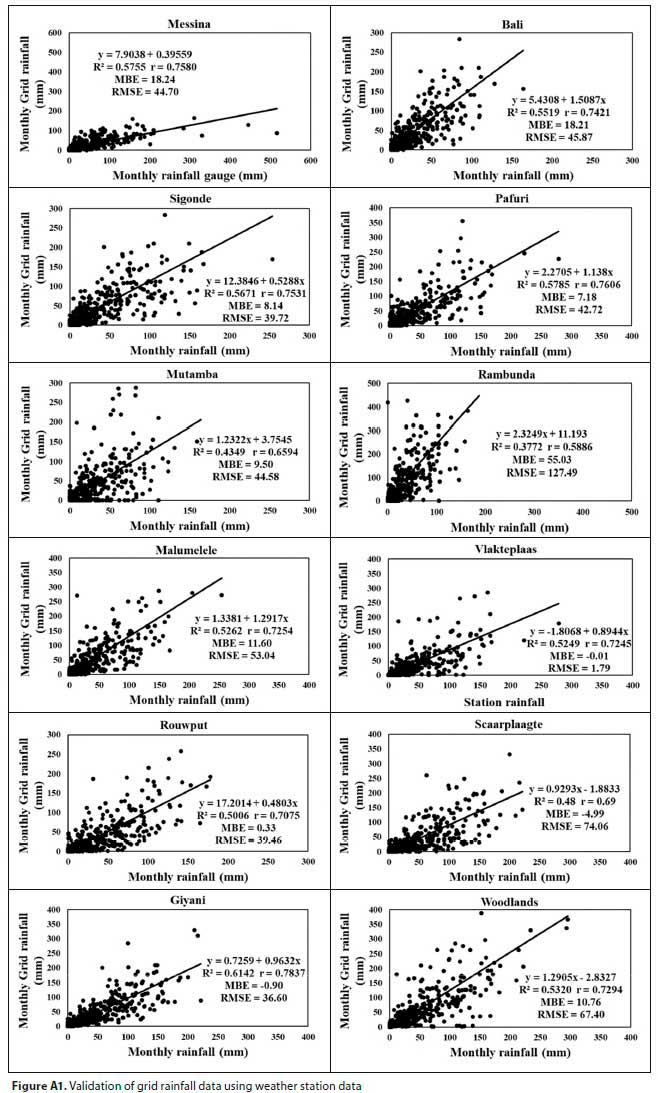
The latitude and longitude grid points covering the LRC for which monthly rainfall data were downloaded (see Fig. 2). Station data were not used in this study due to inconsistencies in recording rainfall data and gaps in the data (Moeletsi et al., 2016). Statistical analysis of the CRU grid data and weather station data was conducted (see Appendix). The SPI values were used to identify seasons of drought and floods (Othman et al., 2016). The occurrence of drought and floods was identified using the classification method of McKee et al. (1993) as shown in Table 1. The seasons with positive SPI values > +2 are classified as wet season, which suggests possibilities of floods, while SPI values < -2 are identified as drought season (Shah et al., 2015; Nkuna and Odiyo 2016).


Identification of dry and wet seasons
Monthly rainfall data were used to compute the SPI values for each of the 15 grid points, which were then used to identify years of drought and floods based on the method of McKee et al. (1993; Table 1). Long-term rainfall data is the only input required to compute the SPI values. The program allows selection of the SPI time scale required for a specific analysis (e.g. 1, 3, 4, 5, 6, 12, 24 or 48 months). The short time scales (1-6 months) are related to moisture deficit and are used in agricultural drought studies. Therefore, the 3-month SPI time scale was selected for this study (covering the sub season from December to February) because of its suitability for assessing agricultural drought (Winkler et al., 2017). The accumulated 3-month SPI values were used to identify dry sub-seasons and wet sub-seasons within the time series for the study period.
Mapping the frequency of drought and floods
The SPI classification by McKee (1993), shown in Table 1, was used to classify the frequency of the different severity classes of the SPI values. The SPI values indicating different severity classes of dry and wet sub-seasons were used to map areas mostly affected by extremely dry to extremely wet seasons (Table 1). The spatial variation of the frequency of drought and floods was mapped using ArcGIS software version 10.3. The inverse distance weighting (IDW) analysis was used. The selection of this interpolation method is largely influenced by the quality of the output of the analysis. The interpolation of climate variables using IDW is also not influenced by changes in topography. The mapping of the variability of SPI has been undertaken in studies by Xia et al. (2018) and Bagheri (2016) to determine the spatial variability of the frequency of drought and floods in some regions of China (i.e., northeast China, Huang-Huai-Hai, Sichuan, South China, Southwest China and Yangtze River) and also the Fras Province of Iran.
Linking drought and flood events with the ENSO phenomenon
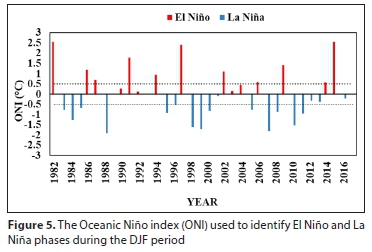
Three-month SPI was also used to analyse the relationship between SPI and SST index for the 15 grid points covering the 1979-2016 period. The correlation between SPI and Nino 3.4 index was conducted using Statistica software. The SST within the Nino 3.4 region was selected because of its strong linkages with the weather experienced in the southern African region (Goddard and Dilley, 2005). Therefore, the relationship between 3-month SPI and Nino 3.4 was used to assess the influence of ENSO on rainfall variability in the LRC. The December-January-February (DJF) season was used for the correlation analysis between SPI and Nino 3.4, because the ENSO influence on rainfall variability is high in the middle of the summer season (DJF) and this could affect agricultural activities in the catchment. The period from November-December is recommended for planting by Masupha and Moeletsi (2017) in the LRC, therefore understanding the influence of ENSO on increasing the frequency of dry and wet periods in the DJF season is important; farmers need to adjust planting dates to minimise the impacts of these events. The Oceanic Nino Index (ONI) was also used to identify ENSO phases in during the study period. The ONI threshold of -0.5 (+0.5) SST values was used to identify El Nino and La Nina phases. The threshold was further broken down into weak (with a 0.5 to 0.9 SST anomaly), moderate (1.0 to 1.4), strong (1.5 to 1.9) and very strong (> 2.0) events for El Nino, and the vice opposite used to indicate La Nina events (Kemarau and Eboy, 2021). The ONI represents a 3-month average of the SST compared to the long-term average of 30 years (Archer et al., 2017).
RESULTS AND DISCUSSION
Drought/flood sub-seasons in LRC between 1979 and 2016
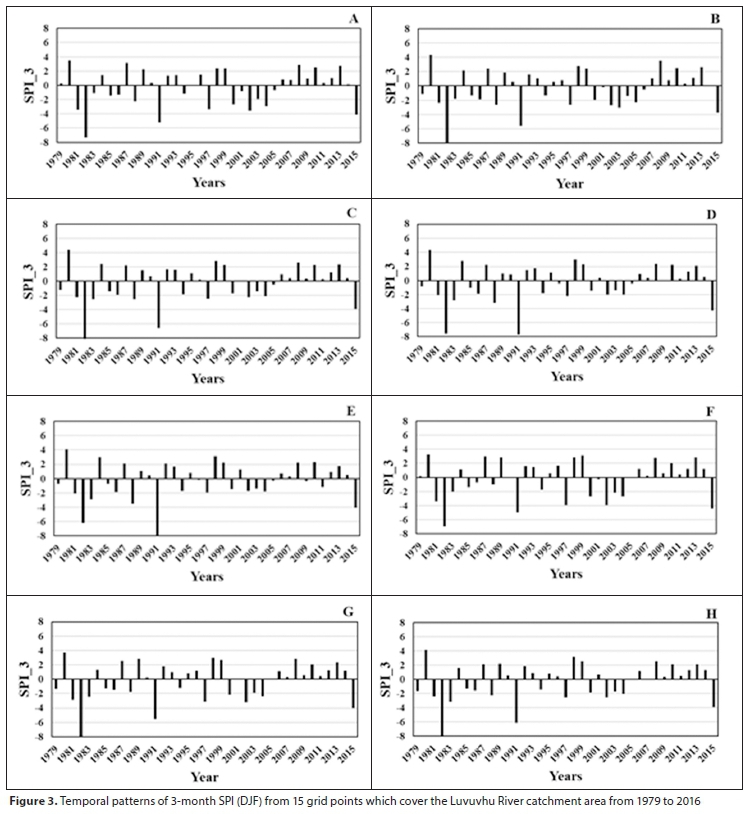
Rainfall records in the study area were used to compute accumulated 3-month SPI. The 3-month SPI values indicated that the 1979/80, 1982/83, 1983/84, 1984/85, 1991/92, 1994/95, 1997/98, 2000/01, 2002/03, 2003/04 and 2015/16 agricultural seasons were all impacted by drought (Fig. 3). The frequency of drought was more rapid, occurring once every two seasons until 1984/85; from then there was a 5-year gap until the next drought in 1991/92. After the 1991/92 sub-season, the dry conditions that prevailed in the LRC continued to occur once after two seasons; thus the frequency of drought decreased in the catchment. Moreover, drought events continued to follow a similar pattern, occurring once every two years until 2003/04, except for the 2015/16 season, when drought occurred after about 10 years. The frequency of drought was also analysed by splitting the frequency of the SPI time series into two portions, 1979-1996 and 1997-2016. Extremely dry conditions were recorded with a frequency of 4.6 in the first portion of the time series and 3.8 in the second portion, indicating a decrease in the frequency of extreme drought events. A similar pattern in the frequency of drought in the LRC was also identified by Masupha and Moeletsi (2017); however, the occurrence of extreme drought in the catchment is changing. The results showed that 1982/83 and 2015/16 were the driest sub-seasons, characterised by SPI values < -2 at all grid points. The 2015/16 drought was also identified by Archer et al. (2017) to be the most severe drought in southern Africa. It was preceded by a low rainfall season (2014/15), suggesting that dry conditions could escalate to the next season resulting in worse agricultural potential. The sub-seasons which experienced severe drought were recorded in 1986/87, 2000/01, 2003/04 and 2004/05, with SPI values < -1.5 for most data points. The occurrence of extreme to severe drought in the catchment had an effect on agricultural production. A similar analysis of drought using standardized precipitation evapotranspiration index revealed that maize yields were affected by drought once every two seasons (Masupha and Moeletsi, 2017).
The occurrence of drought coupled with high temperatures and late rainfall onset often forces farmers to reduce the size of the area planted, therefore resulting in low yields. For instance, Archer et al. (2017) reported that during the 2015/16 drought, maize production in South Africa decreased by 40%. The 1982/83, 1991/92 and 2015/16 years recorded extreme drought events, with serious negative impacts on agricultural production. The 2015/16 drought affected the Limpopo Province, one of the major maize and fruit producing and exporting provinces in South Africa. Therefore, food security becomes a concern in the country because maize is a staple food and plays an important role in sustaining the livelihoods of the majority of the people in the country. The LRC is a resource-poor and under-developed area, characterised by high rates of unemployment and poverty (Masupha et al., 2016). Yet, communities within this catchment rely on agriculture for survival, since the occurrence of drought not only affects their access to food, but also their household incomes. In the LRC, agriculture is mostly rain-fed, which exposes it to the impacts of rainfall variability.
Thus, drought threatens agricultural production in the catchment and requires the dissemination of early warning information to alert farmers and advise them on how to lower risks associated with high crop failure and high livestock mortality. Though the South African Government has developed response programmes to deal with the impacts of drought, government relief programmes are usually not implemented in time and are often insufficient, hence the strategies seeking to address the challenges faced by farmers are developed during the time of a natural hazard and are not long-term solutions (Bahta et al., 2016). Moreover, studies by Mkuhlani et al. (2019a) have revealed that farmers in the Limpopo and Eastern Cape Provinces prefer to use irrigation as a strategy for coping with the high frequency of dry spells in these provinces. However, irrigation is expensive, especially for communal farmers because they plant small areas, and the input and maintenance costs of operating irrigation schemes are too high for them to afford. There are less expensive strategies that crop farmers could adopt, including shifting planting dates in line with onset of rainfall and length of the rainy season, intercropping, mulching, water harvesting and reduction of cropping area (Masupha and Moeletsi, 2017; Mkuhlani et al., 2019b; Rankoana, 2016; Mukwada et al., 2020).
The results from the analysis of 3-month SPI values indicate that the agricultural seasons for 1980/81, 1984/85, 1987/88, 1998/99, 1999/00, 2008/09, 2010/11 and 2013/14 were characterised by extremely wet conditions at nearly all of the sampled grid points (Fig. 3). The 1999/00 extremely wet sub-season was also identified by Nkuna and Odiyo (2016) in the LRC. However, findings from research by Kundu et al. (2014) indicate that the highest river discharge in the LRC was recorded during 1976/77, which was as a result of an above-average wet season. As shown in Fig. 3, high SPI values were also recorded during the 2010/11 season with some grid points recording extremely wet conditions. This concurs with the findings of Musyoki et al. (2016), who reported the occurrence of floods in the Thulamela Local Municipality (a municipality located in the LRC) during the same season. Extremely wet conditions were recorded at a frequency of 2.9 in the first portion of the data and 4.3 in the second portion. Kundu et al. (2014) also indicated that the LRC is experiencing a high frequency of extremely wet conditions resulting in floods. However, the late 1980s and most of the 1990s showed no signs of extremely wet conditions. It is worth mentioning that during the study period (1979 to 2016), high SPI values (> 2) were recorded 8 times and most of these occurred more frequently in the recent past. The analysis of SPI values further shows that severely wet conditions occurred less frequently, with some data points showing no positive SPI values > +1.5.
The 1998/99 and 1999/00 seasons were characterised by extreme wet conditions, with devastating impacts on agricultural production. The response strategies developed by the South African Government departments aiming to address droughts/floods have not been proactive or region-specific, and the distribution of relief measures after the occurrence of natural hazards is delayed due to limited resources (Mthembu and Zwane, 2017). Under such circumstances, developing long-term strategies to cope with the impact of floods is important, especially for subsistence farmers who find it difficult to cope with impacts of flood events. Development of early warning systems that could notify farmers about possible floods before planting could be a vital source of valuable information for disaster managers because it enables them to plan timeous relief measures (Doswell III, 2003). The development of early warning systems could also help farmers to set up dykes, establish displacement camps for livestock and apply for relief assistance in time (Bakibinga-Ibembe et al., 2011). This would lessen the impacts of production loss caused by floods and the cost of rehabilitating the agricultural land affected.
Communities that are located in or near floodplains or cultivated land in flat open areas are vulnerable to flood impacts (Alfieri and Thielen, 2015). Excessive rainfall is regarded as the main parameter that causes floods and understanding the frequency and climatology of such extreme rainfall events is key in developing measures towards improving coping strategies in any region (Musyoki et al., 2016). Therefore, improving the knowledge of weather systems (tropical lows and cut-off lows) that influence rainfall patterns could help farmers to cope with the effects of extreme rainfall events (Singo et al., 2016). Previous research has revealed that farmers rely on different sources of weather information, such as agricultural extension officers, television or radio, newspapers, friends and cellphones, but poor understanding of the weather information and inaccurate weather forecasts decrease the reliability of forecasts, resulting in farmers being exposed to flood impacts (Armah et al., 2010). Improving the models used to predict the occurrence of extreme weather events is critical for enhancing the reliability and use of weather information in coping with erratic rainfall (Loks et al., 2015).
Frequency of droughts and floods in the LRC
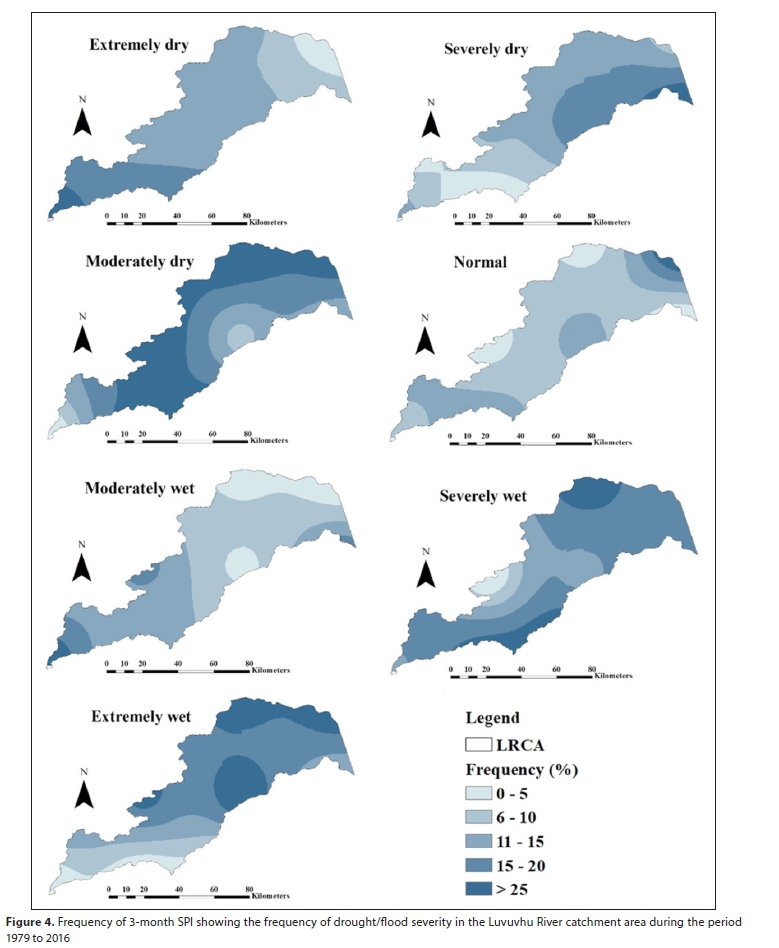
The frequency of dry and wet seasons was mapped using 3-month SPI values for the 15 grid points covering the LRC (Fig. 4). The SPI results show that the south-western tip of the catchment, a relatively small area, experiences a high frequency of extreme drought (>25%). The frequency of moderate to severe drought increases from the south towards the north, with a large portion of the catchment affected by severe drought conditions, skewed towards the north-eastern parts of the catchment. Generally, the lack of rainfall for a period of time (days or months) increases the severity of drought, therefore in the LRC severity of drought usually starts as moderately dry conditions and escalates to extreme conditions as the dry conditions continue for a longer period. The frequency of severe drought was low towards the south-western parts of the LRC, with <5% frequency of occurrence. This area suffered less severe drought compared to the northern parts, due to the higher occurrence of orographic rainfall in its mountains. Generally, rainfall within the LRC area is influenced by elevation, though drought can occur in both low and high rainfall areas (Odiyo et al., 2015).
The spatial variation of the SPI results reveals that the northwestern parts of the catchment experience a high frequency of severely to extremely wet conditions. The positive SPI results further show that severely wet and extremely wet conditions dominated the northern and south-eastern parts (>25%) as shown in Fig. 4. The frequency of extremely wet conditions decreases towards the southern parts, to a value of <5%. The occurrence of extremely wet conditions affects communities in both steeply inclined and flat areas, as indicated by Musyoki et al. (2016). High run-off on steep slopes removes the fertile topsoil and deposits it in low-lying areas and riverbanks, which influences the establishment of farming activities on riverbanks (Kundu et al., 2014; Webster et al., 2014), while impeding surface flow and enhancing flooding. After heavy rainfall, the overflow of rivers destroys crops and livestock (Armah et al., 2010). During the wet season, crops planted near riverbanks could be subjected to waterlogging and flooding.
Severe drought conditions are common in the north-eastern part of the LRC where rainfall fall is low (Masupha and Moeletsi, 2017). However, the north-eastern part also experiences excessive rainfall which is associated with floods. Therefore, the LRC experiences high rainfall variability which affects agricultural production in terms of crop production and availability of pasture for livestock. Planting cultivars that mature in a short period (3 months) towards the late summer could help farmers avoid replanting due to crop failure or poor germination (Mkuhlani et al., 2019b). It is important that disaster management and relief officers target the north-eastern part of the catchment when developing region-specific strategies, since these are the most hazard-prone areas.
Occurrence of El Nino and La Nina phases in the LRC
The ONI was used to identify warm (cold) trends associated with El Nino (La Nina) events using SST values in the Nino 3.4 region (Fig. 5). The ONI varied between the SST threshold (i.e. 1.5-1.9°C), and denoted strong El Nino events in 1982/83, 1991/92, 1997/98, and 2015/16. Moreover, moderate (1.0-1.4°C) El Nino events were identified in 1985/86, 2002/03 and 2009/10. Generally, the warm phase of ENSO is characterised by low rainfall and high temperatures, while the cold phase is associated with high rainfall and cool conditions (Propastin et al., 2010). Strong La Nina events were recorded in 1998/99, 1999/00, 2007/08, 2008/09, 2010/11 and these seasons were also identified by Nkuna and Odiyo (2016) as a period with excessive rainfall in the LRC. The results reveal that SST influences rainfall variability in the catchment; therefore ENSO indices that are based on SST are suitable for drought and flood analysis.
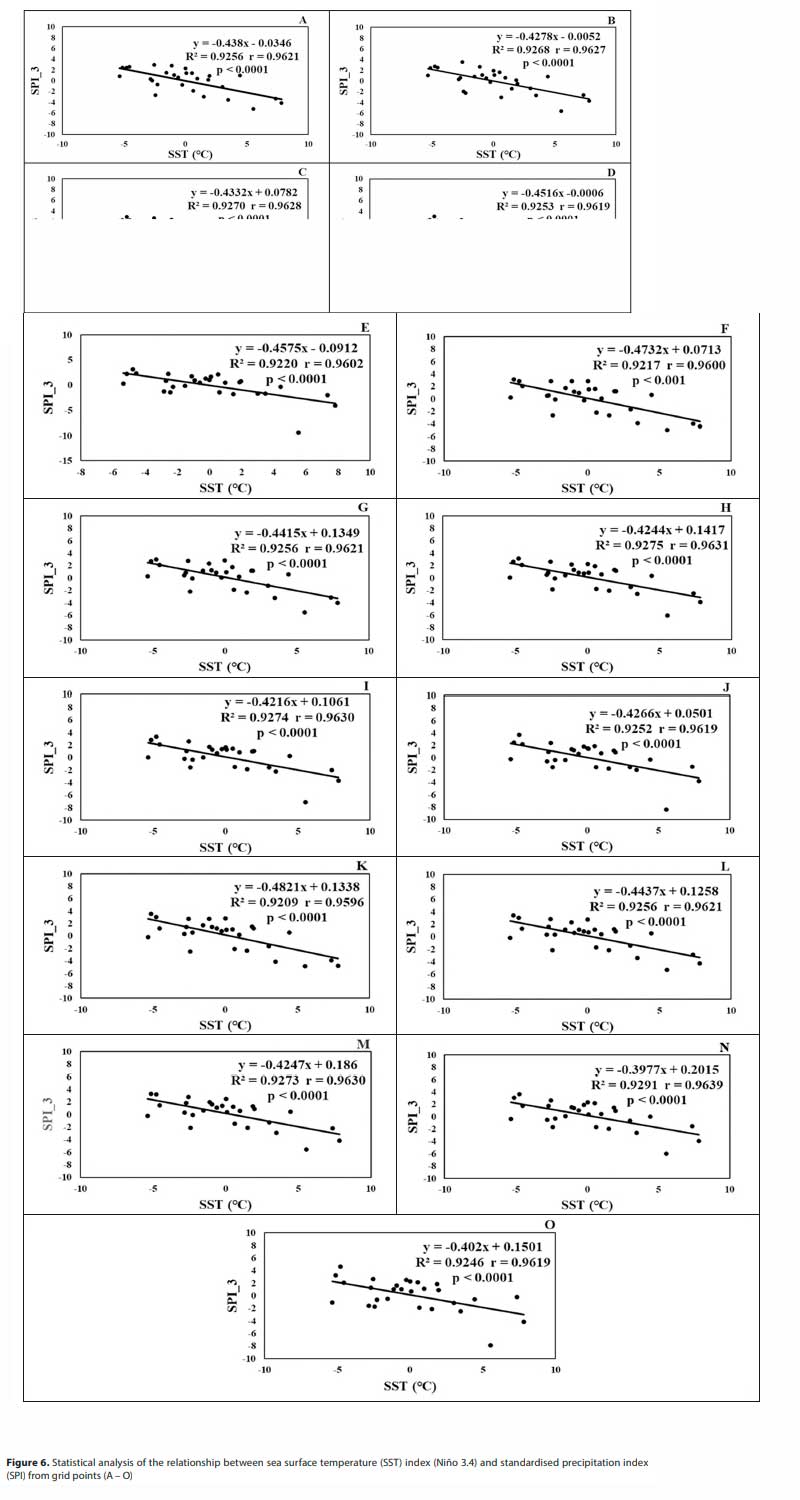
Influence of ENSO on rainfall variability
The relationship between SPI and ENSO index (Nino 3.4) indicates a strong negative correlation with a correlation coefficient (r) of above -0.90 for all the grid points (Fig. 6). The results are also statistically significant (p < 0.05). The results also show that rainfall variability in the LRC is highly influenced by ENSO, resulting in either the El Nino, neutral or La Nina phase. The negative (positive) SST values indicate high (low) rainfall associated with droughts and floods in the catchment. Generally, if the average Nino 3.4 index is above (below) 0.5°C (-0.5°C) this indicates El Nino (La Nina) and the values 0.5°C and -0.5°C represent the neutral phase (Archer et al., 2017; Barbieri et al., 2019; Zhao et al., 2020). The results of this study are in line with the finding by Nkuna and Odiyo (2016) that high temperatures are associated with low rainfall and vice versa, and this negative correlation can be linked to the ENSO influence. The frequent occurrence of high temperatures and low rainfall could expose crops and livestock to unfavourable conditions, as stated by Newton et al. (2011), who reported that maize is found to be sensitive to temperatures above 30°C which decrease crop yield by 1% for every day with temperatures above that threshold. Generally, drought reduces water availability and grazing for livestock, which also affects milk and meat production (Mthembu and Zwane, 2017). High temperatures during El Nino events increase the rate of evaporation, which exacerbates the water crisis. Conversely, low temperatures, which are associated with the occurrence of high rainfall, could also have negative impacts on the agriculture sector. Excessive rainfall on agricultural land destroys crops with shallow roots (i.e. maize) and thus reduces agricultural yields. The 2015/16 season was strongly linked to the ENSO influence in the Eastern Cape Province, with the forecast correctly predicting the occurrence of low rainfall. Studies done in the Free State Province also depicted the association between ENSO and rainfall as well as between ENSO and maize yields (Moeletsi et al., 2011).
Farmers are aware of the drastic changes in rainfall, as stated by Mkuhlani et al. (2019a), but those in the LRC could experience challenges in accessing platforms that are used to disseminate weather forecasts (TV and smart phones). Moreover, access to financial resources for farmers is also a challenge and those that have off-farm income do not invest in new farming methods which involve using irrigation systems and chemical fertilizers (Mkuhlani et al., 2019a; Odhiambo and Magandini, 2008). Furthermore, farmers receiving off-farm income prefer to buy food to sustain the livelihoods of their families during times of ENSO-enforced hazards, instead of trying to adopt new farming methods (Armah et al., 2010). Small-scale farmers are vulnerable to drought and floods. In order to adapt to the changing climate, most farmers rely on agricultural extension officers to provide weather-related information, fertiliser and pesticide applications. Improving the knowledge and skills of extension officers to understand and interpret scientific information in the local language could be a useful strategy to address the impacts of drought and floods.
CONCLUSION
The study used SPI, SST anomalies in the Nino 3.4 region and ONI to assess the frequency of drought/flood severity in the LRC and its association with the El Nino Southern Oscillation. The study focused on rainfall variability associated with El Nino and La Nina events during the DJF sub-season. SPI values were used to assess rainfall variability in the catchment and in order to map the frequency of severity of dry and wet periods. The variability of SPI identified drought and flood events in the LRC and the frequency of occurrence of these events is strongly linked to ENSO. The ONI values identified strong El Nino seasons in 1982/83, 1991/92, 1997/98 and 2015/16 as the driest seasons during the study period. The 1982/83 drought was a severe drought year, although the 2015/16 drought was more severe. La Nina seasons were recorded in 1988/89, 1998/99, 1999/00, 2007/08 and 2010/11, all of which were characterised by excessive rainfall and cool conditions. It can be concluded that rainfall variability in the LRC is associated with the ENSO phenomenon and that sea surface temperatures play a role in rainfall changes during El Nino and La Nina seasons. Rainfall variability in the catchment is influenced mostly by the occurrence of the ENSO phases and this threatens agricultural production. Therefore, farmers might have to adjust their farming systems, planting season and select cultivars that mature in a short period. The high frequency of drought and floods and the erratic occurrence of rainfall affect areas dominated by small-scale farmers who have limited financial resources to invest in agriculture-related implements, irrigation systems and chemical fertilisers.
The LRC experiences high rainfall variability in the north-eastern parts, resulting in a high frequency of droughts and floods in these areas. It can, therefore, also be concluded that since this part of the LRC is more exposed to higher frequencies of severe and extreme drought and wet periods, more effort should be directed to this part of the catchment in order to minimise the impacts of drought and flood events on farming. Developing early warning and agriculture-related forecasting systems before the occurrence of these natural hazards is a key priority because it has the potential to reduce agricultural losses and enhance food security.
ACKNOWLEDGEMENTS
The authors sincerely appreciate the level of financial support from the Water Research Commission (WRC) of South Africa under the project 'The modelling of rainy season characteristics and drought in relation to crop production in the Levubu catchment of the Limpopo Province Climatology and Climate change perspective' (K5/2403//4), as well as the ARC Professional Development Programme (Project P07000065).
REFERENCES
AFIFI T, MILAN A, ETZOLD B, SCHRAVEN B, RADEMACHER-SCHULZ C, SAKDAPOLRAK P, REIF A, VAN DER GEEST K and WARNER K (2016) Human mobility in response to rainfall variability: Opportunities for migration as a successful adaptation strategy in eight case studies. Migr. Dev. 5 (2) 254-274. https://doi.org/10.1080/21632324.2015.1022974 [ Links ]
ALFIERI L and THIELEN J (2015) A European precipitation index for extreme rain-storm and flash flood early warning. Meteorol. Appl. 22 3-13. [ Links ]
ARCHER ERM, LANDMAN WA, TADROSS MA, MALHERBE J, WEEPENER H, MALULEKE P and MARUMBWA FM (2017) Understanding the evolution of the 2014-2016 summer rainfall seasons in southern Africa: Key lessons. Clim. Risk Manage. 16 2228. https://doi.org/10.1016/jxrm.2017.03.006 [ Links ]
ARMAH FA, YAWSON DO, YENGOH GT, ODOI JO and AFRIFA EKA (2010) Impact of floods on livelihoods and vulnerability of natural resource dependent communities in Northern Ghana. Water. 2 120-139. https://doi.org/10.3390/w2020120 [ Links ]
BAHTA YT, JORDAAN A and MUYAMBO F (2016) Communal farmers' perception of drought in South Africa: Policy implication for drought risk reduction. Int. J. Disaster Risk Reduct. 20 39-50. https://doi.org/10.1016/j.ijdrr.2016.10.007 [ Links ]
BAKIBINGA-IBEMBE JD, SAID VA and MUNGAI NW (2011) Environmental laws and policies related to periodic flooding and sedimentation in the Lake Victoria Basin (LVB) of East Africa. Afr. J. Environ. Sci. Technol. 5 (5) 367-380. http://www.academicjournals.org/AJEST [ Links ]
BAGHERI F (2016) Mapping drought hazard using SPI index and gis (a case study: Fars province, Iran). Int. J. Environ. Geoinf. 3 (1) 22-28. https://doi.org/10.30897/ijegeo.304419 [ Links ]
BARBIERI JD, DALLACORT R, FREITAS PSL, ARAÚJO DE DV, FENNER TIEPPO RC and FENNER W (2019) Effects of the ENSO on the variability of precipitation and air temperature in agricultural regions of Mato Grosso State. J. Agric. Sci. 11 91-102. https://doi.org/10.5539/jas.v11n9p91 [ Links ]
CHHABRA AS, GHOSH S and KUMAR D (2016) Assessment of flood induced area using geo-spatial technique. Int. J. Earth Sci. Eng. 9 (3) 301-304. [ Links ]
CHEVAl S (2015) The Standardized Precipitation Index - an overview. Rom. J. Meteorol. 12 17-64. [ Links ]
CRÉTAT J, POHL B, DIEPPOIS B, BERTHOU S and PERGAUD J (2019) The Angola Low: relationship with southern African rainfall and ENSO. Clim. Dyn. 52 1783-1803. https://doi.org/10.1007/s00382-018-4222-3 [ Links ]
DEVEREUX S (2007) The impact of droughts and floods on food security and policy options to alleviate negative effects. Agric. Econ. 37 47-58. https://doi.org/10.1111/j.1574-0862.2007.00234.x [ Links ]
DOSWELL III CA (2003) Flooding. In: Encyclopedia of Atmospheric Sciences. 769-776. [ Links ]
EDOSSA DC, WOYESSA YE and WELDERUFAEL WA (2014) Analysis of droughts in the central region of South Africa and their association with SST anomalies. Int. J. Atmos. Sci. 2014 1-8. https://doi.org/10.1155/2014/508953 [ Links ]
GANGULI P and REDDY MJ (2013) Analysis of ENSO-based climate variability in modulating drought risks over western Rajasthan in India. J. Earth Syst. Sci. 122 (1) 253-269. https://doi.org/10.1007/s12040-012-0247-x [ Links ]
GEBREHIWOT T, VAN DER VEEN A and MAATHUIS B (2011) Spatial and temporal assessment of drought in the Northern highlands of Ethiopia. Int. J. Appl. Earth Obs. Geoinf. 13 309-321. https://doi.org/10.1016/j.jag.2010.12.002 [ Links ]
GHALEB F, MARIO M and SANDRA A (2015) Regional Landsat-based drought monitoring from 1982 to 2014. Climate. 3 563-577. https://doi.org/10.3390/cli3030563 [ Links ]
GODDARD L and DILLEY M (2005) El Nino: Catastrophe or opportunity. J. Clim. 18 651-665. https://doi.org/10.1175/jcli-3277.1 [ Links ]
GUTTMAN NB (1998) Comparing the Palmer drought index and the standardized precipitation index. J. Am. Water Resour. Assoc. 34 (1) 113-121. https://doi.org/10.1111/j.1752-1688.1998.tb05964.x [ Links ]
HARRIS I, OSBORN TJ, JONES P and LISTER D (2020) Version 4 of the CRU TS monthly high-resolution gridded multivariate climate dataset. Sci. Data. 7 1-18. https://doi.org/10.1038/s41597-020-0453-3 [ Links ]
JEWITT GPW and GARRATT JA (2004) Hydrological modelling in the Luvuvhu catchment. CAMP technical report, BEEH, University of KwaZulu-Natal, Pietermaritzburg. 1-9. https://assets.publishing.service.gov.uk/media/57a08cb3e5274a31e000139c/R7937_Hydrological_modelling_in_the_Luvuvhu.pdf [ Links ]
KEMARAU RA and EBOY OV (2021) The Impact of El Nino-Southern Oscillation (ENSO) on Temperature: A Case Study in Kuching, Sarawak. Malaysian J. Soc. Sci. Humanit. 6 289-297. https://doi.org/10.47405/mjssh.v6i1.602 [ Links ]
KORI E, GONDO T and MADILONGA R (2012) The influence of rainfall variability on arable land use at local level: realities from Nzhelele valley, South Africa. In: Proceedings of the International Conference on Future Environment and Energy, 26-28 February 2012, Singapore. [ Links ]
KOTTEK M, GRIESER J, BECK C, RUDOLF B and RUBEL F (2006) World map of the Köppen-Geiger climate classification updated. Meteorol. Zeits. 15 259-263. https://doi.org/10.1127/0941-2948/2006/0130 [ Links ]
KUNDU PM, SINGO RL, ODIYO JO and NKUNA RN (2014) An evaluation of the effects of climate change on flood frequency in the Luvuvhu River Catchment, Limpopo Province, South Africa. Sustain. Irrig. Drain V. Manag. Technol. Polic. 185 157-168. https://doi.org/10.2495/si140151 [ Links ]
LOKS NA, UMAR AM, MAMZING D, AKILA LK and NYAZI C (2015) Potential impacts of climate change on food security. J. Agric. Sci. Technol. 5 799-810. https://doi:10.17265/2161-6256/2015.10.003 [ Links ]
MANATSA D, MATARIRAC CH and MUKWADAD G (2011) Relative impacts of ENSO and Indian Ocean dipole/zonal mode on east SADC rainfall. Int. J. Climatol. 31 558-577. https://doi.org/10.1002/joc.2086 [ Links ]
MANATSA D, MUSHORE T and LENOUO A (2017) Improved predictability of droughts over southern Africa using the standardized precipitation evapotranspiration index and ENSO. Theor. Appl. Climatol. 127 259-274. https://doi.org/10.1007/s00704-015-1632-6 [ Links ]
MASUPHA TE and MOELETSI ME (2017) Use of standardized precipitation evapotranspiration index to investigate drought relative to maize, in the Luvuvhu River catchment area, South Africa. Phys. Chem. Earth 102 1-9. https://doi.org/10.1016Zj.pce.2017.08.002 [ Links ]
MASUPHA TE and MOELETSI ME (2018) Analysis of potential future droughts limiting maize production, in the Luvuvhu River catchment area, South Africa. Phys. Chem. Earth. 105 44-51. https://doi.org/10.1016/j.pce.2018.03.009 [ Links ]
MASUPHA TE, MOELETSI ME and MPANDELI S (2016) Drought analysis on maize in the Luvuvhu River Catchment, South Africa. In: Proceedings of the 2nd World Irrigation Forum (WIF2), 6-8 November 2016, Thailand. [ Links ]
MATHIVHA FI, KUNDU PM and SINGO LR (2016) The impacts of land cover change on stream discharges in Luvuvhu River Catchment, Vhembe District, Limpopo Province, South Africa. WIT Trans. Built Environ. 165 259-270. https://doi.org/10.2495/uw160231 [ Links ]
MBIRIRI M, MUKWADA G and MANATSA D (2018) Influence of altitude on the spatiotemporal variations of meteorological droughts in mountain regions of the free state Province, South Africa (1960-2013). Adv. Meteorol. 2018. https://doi.org/10.1155/2018/5206151 [ Links ]
MCKEE TB, DOESKEN NJ and KLEIST J (1993) The relationship of drought frequency and duration to time scales. In: Proceedings of the 8th Conference on Applied Climatology, 17-22 January 1993, California. [ Links ]
MKUHLANI S, CRESPO O, RUSERE F, ZHOU L and FRANCIS J (2019a) Classification of small-scale farmers for improved rainfall variability management in South Africa. Agroecol. Sustain. Food Syst. 1-23. https://doi.org/10.1080/21683565.2018.1537325 [ Links ]
MKUHLANI S, MUPANGWA W and NYAGUMBO I (2019b) Maize yields in varying rainfall regimes and cropping systems across southern Africa: A modelling assessment. In: Leal Filho W and Leal-Arcas R (eds) University Initiatives in Climate Change Mitigation and Adaptation. Springer, Harare. 203-228. https://doi.org/10.1007/978-3-319-89590-1_12 [ Links ]
MOELETSI ME, SHABALALA ZP, DE NYSSCHEN G and WALKER S (2016) Evaluation of an inverse distance weighting method for patching daily and dekadal rainfall over the Free State Province, South Africa. Water SA. 42 (3) 466-474. https://doi.org/10.4314/wsa.v42i3.12 [ Links ]
MTHEMBU NN and ZWANE EM (2017) The adaptive capacity of smallholder mixed-farming systems to the impact of climate change: The case of KwaZulu-Natal in South Africa. J. Disaster Risk Stud. 9 1-9. https://doi.org/10.4102/jamba.v9i1.469 [ Links ]
MUKWADA G, TAYLOR SJ, MANATSA D, MAHAS P and ROBINSON G (2020) Combating food insecurity in a rapidly changing mountain climate environment: insights from Lesotho. Clim. Change. 163 (2) 1-18. https://doi.org/10.1007/s10584-020-02922-z [ Links ]
MULUNEH A, BEWKET W, KEESSTRA S and STROOSNIJDER L (2017) Searching for evidence of changes in extreme rainfall indices in the Central Rift Valley of Ethiopia. Theor. Appl. Climatol. 128 795-809. https://doi.org/10.1007/s00704-016-1739-4 [ Links ]
MURALI J and AFIFI T (2014) Rainfall variability, food security and human mobility in the Janjgir-Champa district of Chhattisgarh state, India. Clim. Dev. 6 (1) 28-37. https://doi.org/10.1080/17565529.2013.867248 [ Links ]
MUSYOKI A, THIFHULUFHELWI R and MURUNGWENI FM (2016) The impact of and responses to flooding in Thulamela Municipality, Limpopo Province, South Africa. J. Disaster Risk Stud. 8 (2) 1-10. https://doi.org/10.4102/jamba.v8i2.166 [ Links ]
NEWTON AC, JOHNSON SN and GREGORY PJ (2011) Implications of climate change for diseases, crop yields and food security. Euphytica. 179 3-18. https://doi.org/10.1007/s10681-011-0359-4 [ Links ]
NKUNA TR and ODIYO JO (2016) The relationship between temperature and rainfall variability in the Levubu sub-catchment, South Africa. Int. J. Educ. Learn Syst. 1 66-75. [ Links ]
NTOMBELA S, NYHODO B, NGQANGWENI S, PHAHLANE H and LUBINGA M (2017) Economy-wide effects of drought on South African Agriculture: A computable general equilibrium (CGE) analysis. J. Dev. Agric. Econ. 9 (3) 46-56. https://doi.org/10.5897/jdae2016.0769 [ Links ]
ODHIAMBO JJO and MAGANDINI VN (2008) An assessment of the use of mineral and organic fertilizers by smallholder farmers in Vhembe district, Limpopo province, South Africa. Afr. J. Agric. Res. 3 (5) 357-362. http://www.academicjournals.org/AJAR [ Links ]
ODIYO J, MATHIVHA FI, NKUNA TR and MAKUNGO R (2019) Hydrological hazards in Vhembe district in Limpopo Province, South Africa. J. Disaster Risk Stud. 11 (2) 1-13. https://doi.org/10.4102/jamba.v11i2.698 [ Links ]
ODIYO JO, MAKUNGO R and NKUNA TR (2015) Long-term changes and variability in rainfall and streamflow in Luvuvhu River Catchment, South Africa. S. Afr. J. Sci. 111 (8) 1-9. https://doi.org/10.17159/sajs.2015/20140169 [ Links ]
OSENI TO and MASARIRAMBI MT (2011) Effect of climate change on maize (Zea mays) production and food security in Swaziland. Am.-Eurasian J. Agric Environ. Sci. 11 (3) 385-391. [ Links ]
OTHMAN M, ASH'AARI ZH, MUHARAM FM, SULAIMAN WNA, HAMISAN H, MOHAMAD ND and OTHMAN NH (2016) Assessment of drought impacts on vegetation health: a case study in Kedah. In: Proceedings of the 8th IGRSM International Conference and Exhibition on Remote Sensing and GIS (IGRSM 2016), 13-14 April 2016, Kuala Lumpur, Malaysia. [ Links ]
PROPASTIN P, FOTSO L and KAPPAS M (2010) Assessment of vegetation vulnerability to ENSO warm events over Africa. Int. J. Appl. Earth Obs. Geoinf. 12 83-89. https://doi.org/10.1016/jjag.2009.10.007 [ Links ]
RANKOANA SA (2016) Perceptions of climate change and the potential for adaptation in a rural community in Limpopo Province, South Africa. Sustainability. 8 (672) 1-10. https://doi.org/10.3390/su8080672 [ Links ]
RAPOLAKI RS, BLAMEY RC, HERMES JC and REASON CJC (2019) A classification of synoptic weather patterns linked to extreme rainfall over the Limpopo River Basin in southern Africa. Clim. Dyn. 53 1-15. https://doi.org/10.1007/s00382-019-04829-7 [ Links ]
REVILLA-ROMERO B, HIRPA FA, POZO JT, SALAMON P, BRAKENRIDGE R, PAPPENBERGER F and DE GROEVE T (2015) On the use of global flood forecasts and satellite-derived inundation maps for flood monitoring in data-sparse regions. Remote Sens. 7 15702-15728. https://doi.org/10.3390/rs71115702 [ Links ]
ROUAULT M and RICHARD Y (2003) Intensity and spatial extension of drought in South Africa at different time scales. Water SA. 29 (4) 489-500. https://doi.org/10.4314/wsa.v29i4.5057 [ Links ]
SAUNDERS K, STEPHENSON AG, TAYLOR PG and KAROLY D (2017) The spatial distribution of rainfall extremes and the influence of El Nino Southern Oscillation. Weather Clim. Extrem. 18 17-28. https://doi.org/10.1016/jwace.2017.10.001 [ Links ]
SERDECZNY O, ADAMS S, BAARSCH F, COUMOU D, ROBINSON A, HARE W, SCHAEFFER M, PERRETTE M and REINHARDT J (2017) Climate change impacts in Sub-Saharan Africa: from physical changes to their social repercussions. Reg. Environ. Chang. 17 1585-1600. https://doi.org/10.1007/s10113-015-0910-2 [ Links ]
SHAH R, BHARADIYA N and MANEKAR V (2015) Drought index computation using standardized precipitation index (SPI) method for Surat District, Gujarat. In: Proceedings of the International Conference on Water Resources, Coastal and Ocean Engineering, 12-15 March 2015, Surathkal, Mangalore. [ Links ]
SINGO LR, KUNDU PM and ODIYO JO (2016) Impact of land use change on surface runoff and stream discharges in Luvuvhu River Catchment. Res. J. Agric. Enviro. Manage. 5 (6) 197-206. https://doi.org/10.2495/uw160231 [ Links ]
SOBRAL BS, DE OLIVEIRA-JÚNIOR JF, DE GOIS G, PEREIRA-JÚNIOR ER, DE BODAS TERASSI PM, MUNIZ-JÚNIOR JGR, LYRA GB and ZERI M (2019) Drought characterization for the state of Rio de Janeiro based on the annual SPI index: trends, statistical tests and its relation with ENSO. Atmos. Res. 220 141-154. https://doi.org/10.1016/j.atmosres.2019.01.003 [ Links ]
TFWALA CM, VAN RENSBURG LD, SCHALL R and DLAMINI P (2018) Drought dynamics and interannual rainfall variability on the Ghaap plateau, South Africa, 1918-2014. Phys. Chem. Earth. 107 1-7. https://doi.org/10.1016/j.pce.2018.09.003 [ Links ]
TRAMBAUER P, MASKEY S, WERNER M, PAPPENBERGER F, VAN BEEK LPH and UHLENBROOK S (2014) Identification and simulation of space-time variability of past hydrological drought events in the Limpopo River basin, southern Africa. Hydrol. Earth Syst. Sci. 18 2925-2942. https://doi.org/10.5194/hess-18-2925-2014 [ Links ]
WEBSTER T, MCGUIGAN K, COLLINS K and MACDONALD C (2014) Integrated river and coastal hydrodynamic flood risk mapping of the lahave river estuary and town of Bridgewater, Nova Scotia, Canada. Water. 6 517-546. https://doi.org/10.3390/w6030517 [ Links ]
WINKLER K, GESSNER U and HOCHSCHILD V (2017) Identifying droughts affecting agriculture in Africa based on remote sensing time series between 2000-2016: rainfall anomalies and vegetation condition in the context of ENSO. Remote Sens. 9 831. https://doi.org/10.3390/rs9080831 [ Links ]
XIA L, ZHAO F, MAO K, YUAN Z, ZUO Z and XU T (2018) SPI-based analyses of drought changes over the past 60 years in China's major crop-growing areas. Remote Sens. 10 (171) 1-15. https://doi.org/10.3390/rs10020171 [ Links ]
ZHAO Q, MA X, YAO W, LIU Y and YAO Y (2020) Anomaly Variation of Vegetation and Its Influencing Factors in Mainland China During ENSO Period. IEEE Access. 8 721-734. https://doi.org/10.1109/access.2019.2962787 [ Links ]
 Correspondence:
SM Mazibuko
Email:mazibukosm@arc.agric.za
Received: 15 May 2020
Accepted: 17 April 2021
APPENDIX

