


Servicios Personalizados
Articulo
 Inglés (pdf)
 Articulo en XML
 Referencias del artículo
Indicadores

Links relacionados
-
 Citado por Google
 -
 Similares en Google
Compartir

 Permalink
Water SA
versión On-line ISSN 1816-7950
versión impresa ISSN 0378-4738
Water SA vol.47 no.2 Pretoria abr. 2021
http://dx.doi.org/10.17159/wsa/2021.v47.i2.10910
RESEARCH PAPER
Optimizing water and resource recovery facilities (WRRF) for energy generation without compromising effluent quality†
George A Ekama
Department of Civil Engineering, Future Water Institute, University of Cape Town, Rondebosch, 7701, Western Cape, South Africa
ABSTRACT
The primary separation unit (PSU) splits the organic load on the water and resource recovery facility (WRRF) between the primary sludge (PS) anaerobic digester (AD), where energy can be generated, and the biological nutrient removal (BNR) activated sludge (AS) reactor, where energy is consumed. With a CHONP element mass-balanced plant-wide stoichiometric and kinetic steady-state model, this paper explores quantitatively the impact of four cases of increasing organics removal efficiencies in the PSU on (i) settled wastewater characteristics, (ii) balanced solids retention time (SRT) of the Modified Ludzack-Ettinger (MLE) and University of Cape Town/ Johannesburg (UCT/JHB) systems for lowest economical effluent N and P concentrations, (iii) reactor volume, (iv) energy consumption for aeration, pumping and mixing, (v) energy generation by AD of PS and waste activated sludge (WAS), (vi) N&P content of the PS and WAS AD dewatering liquor (DWL) and (vii) final effluent N and P concentrations with and without enhanced biological P removal (EBPR), and looks for an optimum WRRF layout for maximum energy recovery without compromising effluent quality. For the low biogas yield from the WAS AD, decreasing as the SRT of the BNRAS system gets longer and with the added complexity of N&P removal from the digested sludge DWL, makes AD of WAS undesirable unless P recovery is required. Because the wastewater biodegradable particulate organics (BPO) have a low N&P content, it is better to divert more biodegradable particulate organics to the PSAD with enhanced primary separation than digest WAS - the PSAD DWL can be returned to the influent with relatively small impact on final effluent N and P concentration.
Keywords: primary settling tanks; biological nutrient removal; anaerobic digestion; energy generation; energy consumption
INTRODUCTION
Mass conservative plant-wide water and resource recovery facility (WRRF) models have been under development for the past 15 years. Recently these plant-wide models (PWM) have been extended to include P, which has added considerable complexity and size (many more components). The aim of these PWM models is not only to evaluate control strategies in WRRF under real-time dynamic influent loading conditions (Gernaey et al., 2014; Solon et al., 2017), but also to expose the significant interactions that the different unit operations of a WRRF have on one another, such as the impact of recycling the N and P in anaerobic digestion (AD) dewatering liquor (DWL) on the final effluent N and P concentrations (Lizzaralde et al. 2015; Kazadi Mbamba et al., 2016). Because reactor volumes and flows need to be specified before simulation, these models cannot (except by user trial and error) optimize reactor/unit sizes, solids retention times (SRT) and interconnecting flows to find an optimal WRRF layout for maximizing useful outputs like methane gas while keeping effluent N&P concentrations as low as possible. Overall WRRF layout optimization and sizing to meet specified objectives before simulation is best done with plant-wide steady-state models (Ekama, 2009). In this paper the CHON element mass balanced Plant-Wide Stoichiometric and kinetic Steady-State Model (PWSSM) of Ekama (2009) is extended to include P, to explore quantitatively the impact of four increasing organics (COD) removal efficiencies (40, 46, 52, 59%) in the primary separation unit (PSU) on (i) settled wastewater (WW) characteristics, (ii) balanced solids retention time (SRT) of the biological nutrient removal (BNR) system, (iii) reactor volume and SST area, (iv) energy consumption for aeration and pumping at this balanced SRT, (v) energy generation by anaerobic digestion (AD) of primary sludge (PS) and/or waste activated sludge (WAS), (vi) N&P content of the PS and WAS AD DWL with and without enhanced biological P removal (EBPR) and struvite precipitation, and (vii) final effluent N&P concentrations.
Description of the plant-wide steady-state model (PWSSM)
The PWSSM spreadsheet developed for this investigation comprises interconnected primary separation unit (PSU), BNR activated sludge, aeration, secondary settling tank (SST), separate primary sludge (PS) and waste activated sludge (WAS) thickening, anaerobic digestion (AD) and dewatering, while maintaining water, CHONP and TOD material balances via stoichiometry over each unit operation and plant wide, where TOD is the total oxygen demand which is the COD plus the oxygen demand of the reduced N (TKN) with respect to nitrate.
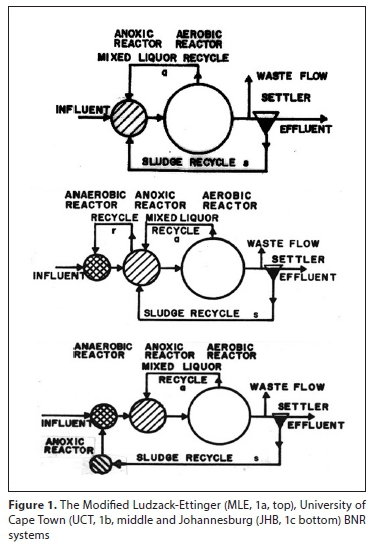
The BNRAS models are based on WRC (1984), Wentzel et al. (1990), Henze et al. (2008), and Ekama (2009, 2011), which allow sizing standard BNR systems, such as the Modified Ludzack-Ettinger (MLE) and 4-stage Bardenpho N for removal by nitrification-denitrification (ND), and the University of Cape Town (UCT), Johannesburg (JHB) and 3- and 5-stage Bardenpho systems for N&P removal.
In this paper only the MLE (Fig. 1a), UCT (Fig. 1b) and JHB (Fig. 1c) systems are considered.
The AD model is that of Sötemann et al. (2005) using Monod kinetics to convert the COD of biodegradable particulate organics (BPO) to AD biomass (E) and methane (1-E), where E is the 'observed yield, i.e., the proportion of the biodegradable COD converted to AD biomass (0.07-0.04), which is a function of the AD biomass yield (YAD) and endogenous respiration rate (bAD) and AD SRT.
In the energy model, methane gas generates electricity 15.1 kWh/ kgCH4 and a thermal efficiency of 45% estimated for steam turbine heat exchangers (Chang et al., 2014). The energy consumed by the AD itself was estimated from (i) 30 W/m3 AD volume to maintain 37°C (Taricska et al., 2009; Liu and Liptak, 1997) and (ii) heating the AD influent to 37°C. From these considerations and the Monod hydrolysis rate of PS or WAS BPO (Ikumi et al., 2014), the AD needs to operate at the shortest possible SRT for maximum surplus energy and 10 d was selected for PS and 15 d for WAS. The WAS BPO is the biodegradable fraction of the OHO and PAO biomass. Pumping energy was calculated from the flows and static lift, viz. influent 5 m, sludge return (s = 1:1) 2 m and mixed liquor (a = 6:1, r = 1:1) recycle 0.4 m.
The aeration model calculates the actual oxygen transfer rate (OTR, kgO/kWh) from the standard OTR (2.5 kgO/kWh) using the usual corrections for temperature (14°C), pressure (altitude 100 m amsl) and wastewater characteristics such as those given in Tchobanoglous et al. (2004). Only average aeration energy requirement was considered - peak aeration power is for sizing the aeration equipment, not for energy consumption by it.
The SST model is based on the idealized one-dimensional flux theory (1DFT, Ekama and Marais, 1986; Ekama et al., 1997) and a flux rating of 0.8 is applied, which decreases the maximum applied flux [kgTSS/(m2-d)] to 80% of the 1DFT calculated maximum flux (Ekama and Marais, 2004). The flux theory constants V0and n are calculated from the selected Diluted Sludge Volume Index (DSVI = 100 mL/g) with the equations of Ekama and Marais (1986).
The PST model is described below with the wastewater (WW) characterisation.
The remaining physical units such as thickening and dewatering
are point concentrators of settleable solids (SS) to a selected TSS concentration, e.g., 5% total suspended solids (TSS) where 1%TSS = 10 000 mgTSS/L and the dissolved concentrations followed the water lines. A dewatered cake solids value of 25%TSS for disposal was assumed.
Mixing energy is usually around 5 W/m3 reactor volume for the unaerated zones. The mixing energy is deemed not to change significantly with the comparison of the various scenarios presented, hence is not included in the presented calculations.
The combined PWSSM is general and a wide range of different input parameters can be entered to determine the effects of changes in WW characteristics, PSU and activated sludge settleability on (i) BNR system reactor volume, SST surface area and effluent quality, (ii) energy consumption and generation by AD of PS and WAS, and (iii) the effect of the N&P concentrations in the AD DWL on the BNR systems and effluent quality. A similar PWSSM has been developed by Wu and Ekama (2015). These steady-state models are aligned with the continuity, stoichiometry and kinetic principles of the dynamic simulation models (Ekama, 2009). They give similar results as the dynamic models under steady-state conditions and so can be used to optimally size bioprocess units of a WRRF for dynamic simulation model input.
Influent wastewater characteristics
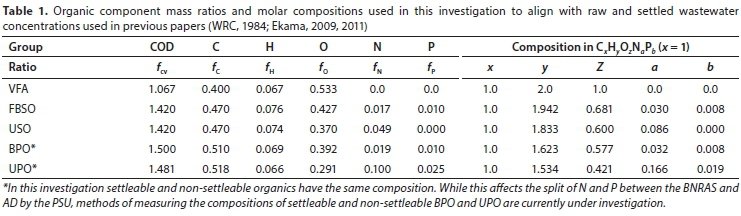
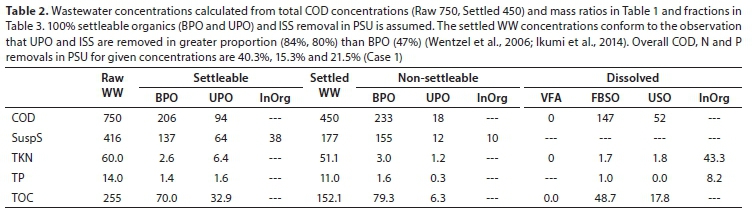
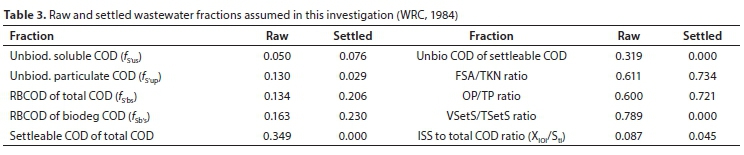
For this investigation, WW characteristics used in previous studies were used (WRC, 1984; Ekama, 2009, 2011, Tables 1a to c). The PWSSM requires eight raw influent WW concentrations, the five organics components making up the COD, i.e., (i) volatile fatty acids (VFA), (ii) fermentable biodegradable soluble organics (FBSO), (iii) unbiodegradable soluble organics (USO), (iv) biodegradable particulate organics (BPO), (v) unbiodegradable particulate organics (UPO), and the three inorganics components, i.e. (vi) free and saline ammonia (FSA), (vii) ortho-phosphate (OP) and (viii) inorganic suspended solids (ISS). The particulate components (BPO, UPO, ISS) each subdivide into settleable and non-settleable fractions. Each of the five organics groups have a COD (ƒcv), C fC), N (fN) and P (fP) to mass ratio (Table 1). The raw WW component COD concentrations (Table 2) are calculated from the selected raw WW COD fractions (Table 3) and the organic N and P concentrations are calculated from the component COD concentrations and mass ratios (Table 1). The influent total Kjeldahl nitrogen (TKN) and total P (TP) are then the sum of the organic N and FSA and the organic P and OP, respectively. The proportions of the particulate components (BPO, UPO, ISS) that are settleable are selected and it is assumed the PSU removes 100% of these settleable components, while maintaining 100% water, COD, N, P and ISS mass balances. In this fractionation method the dissolved concentrations are the same in the primary sludge (PS) and settled and raw WW and the only settled WW fraction that is independent of the raw WW is the settled WW UPO fraction (fS'up). The dissolved and non-settleable concentrations constitute the settled WW and the dissolved and settleable concentrations constitute the PS. By selecting increasing proportions of BPO, UPO and ISS that are settleable, the effect of the split of organics and ISS between the PSAD and the BNRAS system on the WRRF energy production and consumption and effluent quality was investigated (Table 4).
SOME PRELIMINARY CONSIDERATIONS
The balanced BNRAS system sludge age (SRT)
The balanced SRT offers the lowest BNRAS system reactor volume because it is the shortest SRT at which it can be operated to ensure nitrification and achieve the lowest economical effluent nitrate concentration. At the balanced SRT, the denitrification performance of the primary anoxic zone is optimal because the maximum practical α-recycle ratio (aprac, say 6:1) is equal to the optimum α-recycle ratio (α opt). At aopt, the equivalent nitrate load on the anoxic zone, which is set by the influent TKN concentration and includes the dissolved oxygen (DO) recycled from the aerobic zone, is equal to its denitrification potential (Dp1), which is set by the influent organics (COD) concentration. At aopt, the effluent nitrate concentration (Nne) is lowest because a lower a-recycle ratio underloads the anoxic zone with nitrate and a higher a-recycle ratio overloads the anoxic zone with nitrate and discharges unnecessary high DO to the anoxic zone, which reduces denitrification and increases effluent nitrate (Fig. 2). The maximum practical α-recycle ratio (aprac) is set at around 5 to 7:1 because increasing the ratio above this reduces the effluent nitrate concentration by only 1 to 2 mgNO3-N/L (<2%), which is not worth the increase in power costs from recycling 1x or 2x ADWF more.
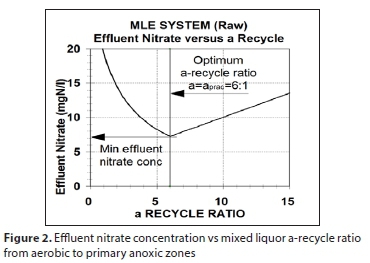
At aopt, the effluent nitrate concentration (Nne) is lowest because a lower a-recycle ratio underloads the anoxic zone with nitrate and a higher a-recycle ratio overloads the anoxic zone with nitrate and discharges unnecessary high DO to the anoxic zone (the model considers a dissolved oxygen concentration of 2 mgO/L flowing within the a-recycle), which reduces denitrification and increases effluent nitrate (Fig. 2). The maximum practical a-recycle ratio (aprac) is set at around 5 to 7:1 because increasing the ratio above this reduces the effluent nitrate concentration by only 1 to 2 mgNO3-N/L (<2%), which is not worth the increase in power costs from recycling 1x or 2x ADWF more.
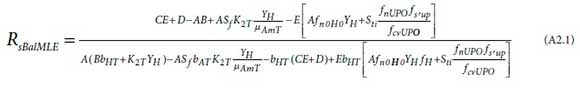
The balanced SRT for the MLE system (Fig. 1a) was first proposed by Van Haandel et al. (1982) and its determination by an iterative procedure is described in detail in Henze et al. (2008), viz., for given wastewater characteristics, the SRT is increased incrementally and the maximum unaerated sludge mass fraction (fxm), nitrification capacity (Nc), denitrification potential of the primary anoxic zone (Dp1) set equal to f,m, aopt and Nne are calculated. An aprac is selected (say 6:1) and the SRT at which the aopt = aprac is the MLE system balanced SRT. An explicit equation for the balanced SRT of the MLE is given by Robertson and Ekama (2016) and Appendix 2.
The UCT and JHB systems also have a balanced system SRT. Explicit equations for these have not been derived because they are complicated by the iterative calculation which divides the influent FBSO between the polyphosphate accumulating organisms (PAO) and ordinary heterotrophic organisms (OHO). It is easiest to determine them with the iterative procedure by incrementally increasing the system SRT until aopt = aprac (say 6:1) (Robertson and Ekama, 2016). The main differences in the calculation for the balanced system SRT of the UCT and JHB systems compared with that for the MLE system are: (i) the influent FBSO has to be divided between the OHO and PAO (which get ~80-90%) with the fermentation model of Wentzel et al. (1985) or Wentzel et al. (1990), Henze et al. (2008), Ekama (2011); (ii) denitrification is mediated by OHO only; and (iii) the specific OHO denitrification rates in the primary and secondary anoxic zones at 20°C (K220, K320) are increased from 0.101 and 0.072 mgNO3-N/(mgOHOVSS-d) in ND systems to 0.255 (K'220) and 0.114 (K'320) mgNO3-N/ (mgOHOVSS-d) in NDEBPR systems (Clayton et al., 1991; Ekama and Wentzel, 1999). Additionally, for the UCT system (iv) the primary anoxic sludge mass fraction (fx1) is the difference between the maximum unaerated sludge mass fraction fj allowed at a particular SRT to ensure nitrification and the anaerobic sludge mass fraction (fxa), viz. fx1=fxm-fxa, and for the JHB system (iv) the sum of the primary (fx1 and secondary (fx3) (underflow) anoxic sludge mass fractions (fx1+fx3) is the difference between the maximum unaerated sludge mass fraction fxm) allowed at a particular SRT to ensure nitrification and the anaerobic sludge mass fraction (fxa), viz. fx1 + fx3= fxm=fxa
Subject to the above four changes, the equation for the optimum a-recycle ratio (aopt) for the UCT system is the same as for the MLE system and the SRT at which aopt = aprac= (say) 6:1 is the balanced SRT for the UCT system (Henze et al., 2008; Ekama, 2011). Similarly, the balanced SRT for the JHB system is the SRT at which the primary anoxic zone (fx1) is loaded exactly to its denitrification potential by the optimum a-recycle ratio (aopt) equal the maximum practical (aopt= aprac) and the secondary anoxic zone (fx3) in the underflow is exactly large enough to denitrify the nitrate entering it to protect the VFA uptake by PAO in the anaerobic zone.
Setting the required SRT on a BNRAS plant is extremely important - if the SRT is not known accurately, the plant cannot be modelled accurately. Withdrawal of WAS from the underflow does not control SRT! The advantages of establishing and controlling SRT on BNR systems hydraulically by wasting from the reactor a fixed fraction of the reactor volume daily (as in Fig. 1) are outlined by Ekama (2010).
For the same wastewater characteristics and SRT, the mass of TSS in an NDEBPR reactor is 15-20% higher than in an ND reactor because (i) PAO produce more VSS per kgCOD than OHO due to their lower endogenous respiration rate (0.04/d compared with 0.24/d at 20°C) and (ii) there is additional ISS from the PAO polyphosphate content (3.286 mgISS/mgP). With chemical P removal, a higher ISS is expected from the phosphate precipitate that is formed by the dosed cation. The same applies to EBPR, except the 'precipitate' is polyphosphate and Mg, K and Ca cations in the influent are used by PAO to form it (Ekama and Wentzel, 2004). So for the same organic load, NDEBPR systems have larger reactors because (i) sludge production is higher and (ii) their balanced SRTs are longer to accommodate the anaerobic reactor.
Determining the volume and SST area for a BNR system
Once the SRT of a BNRAS system is established, the mass of TSS in the reactor (MXt, kgTSS) is known from the organic (and ISS) load on the reactor (FSti = QADWFSti, kgCOD/d), where QADWFis the average dry weather flow (ADWF), Stithe total flow-weighted average influent COD concentration to the BNR system. MXt is the product of the average reactor TSS concentration (Xtave) and the reactor volume (VR), viz. MXt = XtaveVR. Hence the reactor volume is found by selecting a reactor TSS concentration (Xtave). Selection of Xtaveis done via a reactor volume and SST area cost minimization calculation (Ekama et al., 1997; Ekama, 2011). As Xtaveincreases so the reactor volume (VR) and its cost decrease and (for a selected sludge settleability) the SST area (AST) and its cost increase. The combined cost will be a minimum over a range (~2 gTSS/L) of reactor TSS concentration and a TSS in this range is selected for the BNR-SST system. This reactor TSS for minimum combined cost increases for (i) raw WW, (ii) higher influent COD concentration, (iii) longer SRT and (iv) EBPR because these increase the mass of TSS in the reactor (MXt) without affecting the SST area. In contrast, the TSS for minimum combined cost decreases for (v) higher peak wet weather flow (PWWF) to ADWF ratio (fq) and (vi) poorer sludge settleability, because these increase the area of the SST without affecting the mass of TSS in the reactor (MXt). Required in this calculation is the link between the average reactor TSS concentration (Xtave) and the aerobic reactor TSS concentration (Xtaer) because these are different for different BNR systems (Parco et al., 2018). For systems with the same TSS concentration in each zone, like the MLE and 3-, 4- and 5-stage Bardenpho systems, Xtave= Xtaerand so Xtavecan be replaced by Xtaerin the cost minimization calculation. However, for UCT and JHB systems, Xtaerφ Xtavebecause the TSS concentration is not the same in each zone of the system. In the UCT system, the anaerobic zone TSS concentration is a factor r/(1+r) times Xtaer, and for the JHB system, the underflow anoxic zone TSS concentration is a factor (1+5)/5 times Xtaer. From the equations relating sludge mass and volume fractions of different BNR systems with SST (or membranes) of Ramphao et al. (2006) or Parco et al. (2018), for the UCT system, Xtave= Xtaer[1-fxa/(1+r)], and for the JHB system, Xtave = Xtaer/[1+fx3/s]. So for the UCT and JHB systems, Xtaveneeds to be replaced with these Xtaerequations in the MX^ave= XtaveVRbecause Xtaeris the SST feed TSS concentration in these systems.
Determining the capacity of an existing BNR system
For a given biological reactor volume VR(and anaerobic mass fraction faif applicable) and SST surface area (AST), the average dry weather flow (QADWF) capacity (ML/d) can be calculated for a particular WW with known characteristics. With the required (balanced) SRT known, the mass of sludge in the reactor (MXt, kgTSS) per kgCOD/d load applied to the reactor [Lsys kgTSS/ (kgCOD/d), which, when divided by SRT, is the specific sludge production rate, SSPCOD,TSS kgTSS/d per kgCOD/d, WRC (1984), Tchobanoglous et al. (2004)] is known, i.e. MX = Lsys-QADWF-Sti where Lsys is a function of SRT and the WW characteristics and is different for ND (LND) and NDEBPR (LEBPR) systems. Hence, QADWF = VR-Xtave/(SU-Lsys) ML/d. This equation has two unknowns, QADWF and Xtave, so one more fact is required to determine QADWF. This is obtained from the overflow rate on the SST. From the 1DFT, the overflow rate at PWWF must not be greater than the flux rating (0.8) times settling velocity of the sludge at the SST feed or aerobic zone TSS concentration (VS), i.e., QPWWF/AST = 0.8 VS= 0.8 V0exp(-«Xtaer) (m/h). Converting QPWWF to ML/d and selecting a PWWF/ADWF ratio fq), yields:
Qadwf = (24Ast-0.8V0)/(1000 f^-exp-n-Xtaer) ML/d
Then, substituting the above equations linking Xtaer and Xtave for the different systems, yields:
MLE: Xtaer= F-exp(-n-Xtaer)
where F = AST-0.8V0-LND-24)/VR-fq-1000).
UCT: Xtaer = G-exp(-H-Xtaer),
where G = (AST•0.8V0-Sti-LEBPR-24)/{VR-fq-1000[1 - fxa(1 + r)]}
JHB: Xtaer = H-exp(-n-Xtaer),
where H = [AsT-0.8-V0-Sti-LEBPR-24(1 + fx3/s)]/(VR-fq1000)
These equations are solved by finding the Xtaer that equates the left- and right-hand sides. Once Xtaer is found, the WRRF capacity is given by either of the QADWF equations above.
The four primary separation cases
The primary separation unit (PSU) splits the organic load between the PSAD, where energy can be generated, and the BNRAS reactor, where energy is consumed. The more organics diverted to the PSAD, the lower the organic load on the BNRAS system and the lower the energy consumption for aeration but the higher the influent TKN/COD ratio of the settled wastewater. This is because a much greater fraction of organics (COD) is particulate than TKN - most TKN is dissolved FSA, which passes through the PSU. The impact of four cases of particulates (BPO, UPO and ISS) removal by primary separation (Table 4) on the balanced system SRT of the MLE, UCT and JHB systems, their energy consumption, reactor volume, SST area and effluent quality (N&P) and energy production by PS and WAS AD and the N&P content of their dewatering liquor, are considered in this plant-wide study.
RESULTS AND DISCUSSION
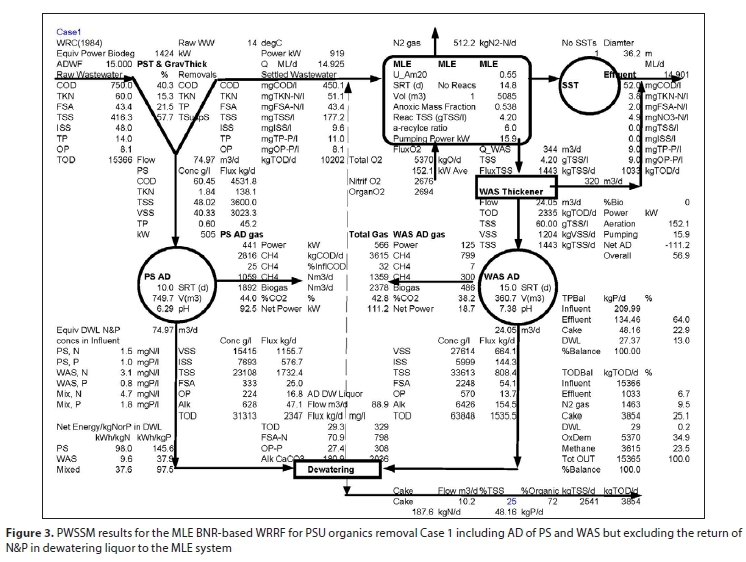
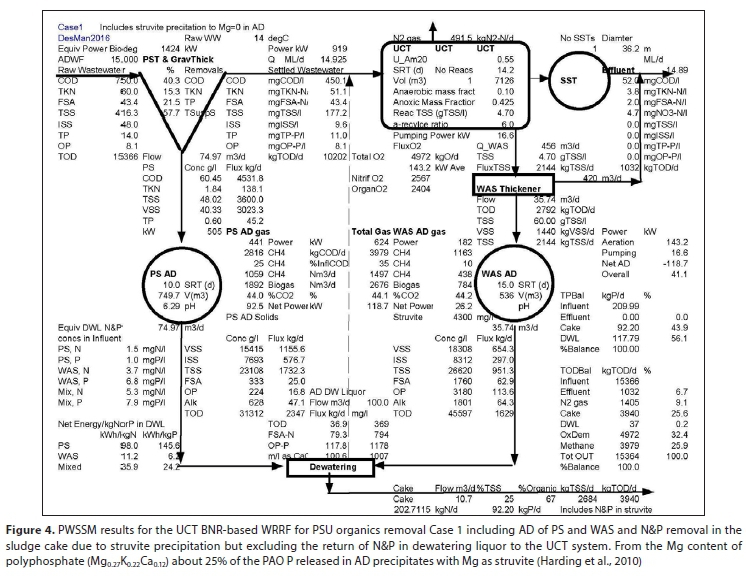
A selection of PWSSM results for the MLE- and UCT-based WRRFs for the four cases of PSU organics and ISS removal efficiencies are given in Table 5 and Figs 3 and 4 show the PWSSM outputs for the MLE and UCT-based WRRF for Case 1.
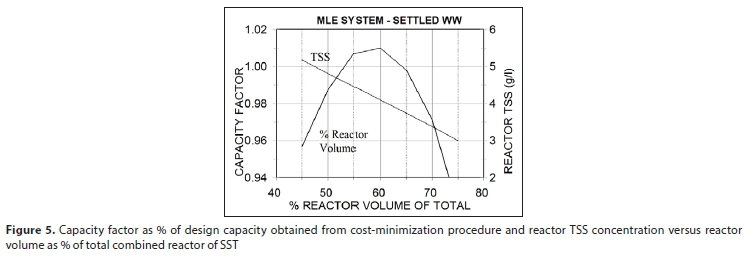
Once the reactor and SST have been sized for lowest combined cost for a selected organic load and PWWF/ADWF (fq) ratio, this total volume can be reassigned between the reactor and SST in different proportions over quite a wide range (AS 4565% and SST 55-35% of combined volume) without negatively impacting the plant's ADWF capacity significantly (<3%, Fig. 5). This is because a larger reactor volume reduces the SST feed concentration which allows a higher overflow rate and hence a smaller SST.
The reactor volume advantage of the JHB system over the UCT system is apparent, not real. In the JHB, the secondary anoxic reactor in the underflow has a higher (~twice) TSS concentration than in the other reactors. In contrast, in the UCT, the anaerobic reactor has a lower (~half) the TSS concentration than in the other reactors. So for the same mass of sludge in the reactor (same SRT), the reactor volume of the JHB system is smaller than that of the UCT system. However, the balanced SRT for lowest effluent N (and P) of the JHB system is longer (by ~2 d) than that of the UCT system, which results in a larger mass of sludge in the JHB system. Therefore, with each at their balanced SRT and an a-recycle of (say) 6:1, the effluent nitrate concentration from both is lowest and similar and the reactor volumes of the JHB and UCT systems are closely similar. Therefore, in the interests of brevity, the JHB system will not be considered further - its results are similar to the UCT system.
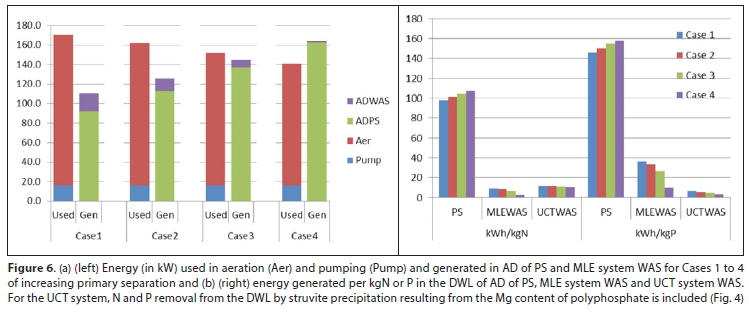
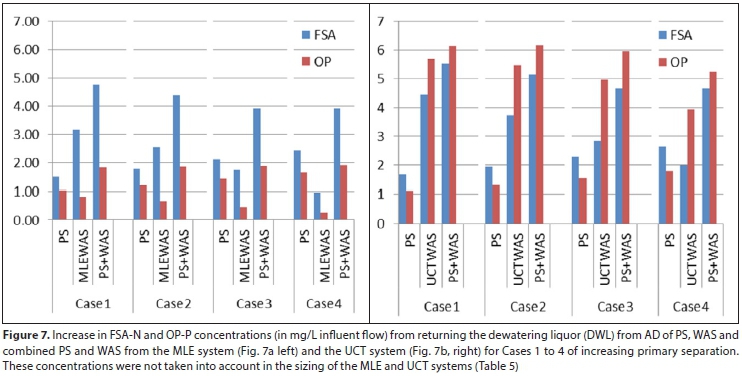
Unless N&P removal/recovery from AD DWL liquor is included in the WRRF, digesting WAS from MLE ND or from UCT/JHB NDEBPR systems should not be considered - the low energy yield from the AD of WAS, which decreases as SRT of the WAS increases (Table 5.7, Fig. 6), is not worth having to deal with the high N&P concentrations in the DWL (Table 5.6, Fig. 7), which, if not removed, have a major impact on the BNRAS effluent N&P concentrations when recycled back to the influent. For greater energy generation without compromising effluent quality and without AD DWL N&P removal technologies, it is better to increase the organics removals in the PSU and produce more PS for AD than digest WAS (Fig. 6).
While the additional organics removal in the PSU increases the settled wastewater TKN/COD ratio (Table 5.1), and so also the balanced SRT of the BNR systems (Table 5.3), the reduced organic load on the AS results in approximately the same mass of TSS in the reactor, with the result that the AS reactor volume (Table 5.3) and effluent N&P concentrations remain closely the same (Table 5.4). This results in (i) greater energy generation in PSAD (Table 5.5, Fig. 6), (ii) less energy consumption in the AS even though the SRT in the AS is longer (Table 5.3) and (iii) a low N&P DWL which can be returned to the influent without significant impact on the effluent N&P concentrations (Table 5.6, Fig. 7). This conclusion follows from the N&P composition of the settleable BPO, which, according to the best information available (Wentzel et al., 2006), has a ~5x lower N composition than OHO and PAO biomass and ~2.5x and ~25x lower P composition than OHO and PAO biomass in ND and NDEBPR systems, respectively. The higher the N&P composition of the settleable BPO, the more N&P in the DWL of the PSAD.
CONCLUSIONS
With a CHONP element mass-balanced plant-wide stoichiometric and kinetic steady-state model, the impact of four increasing organics removal efficiencies in the primary separation unit were explored quantitatively on the settled wastewater characteristics, the balanced SRT of the MLE and UCT/JHB systems, reactor volume, energy consumption for aeration and pumping at this balanced SRT, the energy generation by the primary sludge (PS) anaerobic digestion (AD) and waste activated sludge (WAS) AD, the N&P content of the PS and WAS AD DWL with and without enhanced biological P removal (EBPR) and the final effluent N and P concentration.
Once the activated sludge (AS) reactor (say 60% of total volume) and secondary settling tank (SST, remaining 40% of total volume) have been sized for lowest construction cost (Ekama et al., 1997) for a selected organic load and peak wet weather flow to average dry weather flow ratio (PWWF/ADWF), this total volume can be reassigned between the AS reactor and SSTs in different proportions over quite a large range (AS 45-65% and SST 55-35% of total volume) without decreasing the plant's ADWF capacity (<3%).
Unless N and P removal/recovery from AD dewatering liquor (DWL) liquor is included in the WRRF, digesting WAS from MLE ND or UCT/JHB NDEBPR systems should not be considered - the low energy yield from the AD of WAS, which decreases as SRT of the WAS increases, is not worth having to deal with the high N and P concentration DWL it produces, which, if N and P are not removed, has a major impact on the effluent N and P concentrations when recycled back to the influent.
From the above, for greater energy generation without compromising effluent quality and without AD DWL N and P removal technologies, it is better to increase the performance of the primary separation unit (PSU) and produce more primary sludge for AD than digest WAS. While the additional organics removal in the PST increases the settled wastewater TKN/COD ratio, and therefore increases the balanced SRT of the MLE, UCT and JHB systems for lowest economical effluent nitrate concentration, the reduced organic load on the AS results in approximately the same mass of TSS in the reactor, with the result that the AS reactor volume and effluent N and P concentrations remain closely the same for increasing organics removal in the PSU. This results in greater energy generation in PS AD and less energy consumption in the AS even though the SRT in the AS is longer.
The prioritized goal in wastewater treatment remains to ensure human and environmental health. Hence, the strategies to minimize energy requirement or recover energy during wastewater treatment processes should not be at the expense of the quality required for effluent discharged to receiving water bodies. According to Ekama et al. (2011), power consumption in the developed countries is usually within the range of 5-10 kW/person, while around 0.02 kW/person energy is available for recovery from wastewater. The energy use (and carbon emissions) from other human activities have been quantified as much higher in comparison to that used for wastewater treatment and treated wastewater has much greater value as a potential fresh-water source than the energy it contains or is consumed in its treatment (Ekama, 2009; Ekama et al., 2011).
The adoption of changing paradigms, which involve the transition of wastewater treatment plants (WWTPs) to water resource recovery facilities (WRRFs), requires understanding the technologies available to reduce recycling pollutant loads and their application in holistic (system-wide) approaches to decision making. Several side-stream technologies are available and are recognized as efficient to reduce N and P concentrations in the sludge return liquors. Examples of applicable technologies for side-stream N removal (most based on efficient ways of ammonia oxidation) are SHARON, ANNAMOX and the Biological Augmentation Batch Enhanced process, marketed as BABE. The solutions available for P removal or recovery include conventional coagulation, flocculation and sedimentation using metal-salts for P chemical precipitation, up to more complex processes with chemical crystallization in up-flow fluidized bed reactors with dosages of Ca or Mg in controlled pH conditions and allowing for a high-phosphate recovery in the form of struvite. Examples of these technologies are marketed as Ostara Pearl, WASSTRIP, AIRPREX, Crystalator, CalprexTM, PhospatTM amongst others.
ACKNOWLEDGEMENTS
The final paper was edited by Dr David Ikumi.
REFERENCES
CLAYTON JA, EKAMA GA, WENTZEL MC and MARAIS GVR (1991) Denitrification kinetics in biological nitrogen and phosphorus removal systems treating municipal wastewaters. Water Sci. Technol. 23 (4/6-2) 1025-1035. https://doi.org/10.2166/wst.1991.0554 [ Links ]
EKAMA GA and MARAIS GVR (1986) Sludge settleability and secondary settling tank design procedures. J. Water Pollut. Control 85 (1) 101-113. [ Links ]
EKAMA GA, BARNARD JL, GUENTHERT FW, KREBS P, MCCORQUODALE JA, PARKER DS and WAHLBERG EJ (1997) Secondary settling tanks: Theory, design, modelling and operation. IAWQ STR No 6. International Association on Water Quality, London. 216 pp. ISBN 900222 03 5, ISSN 1025-0913. [ Links ]
EKAMA GA and WENTZEL MC (1999) Denitrification kinetics in N and P removal activated sludge systems treating municipal wastewaters. Water Sci. Technol. 39 (6) 69-77. https://doi.org/10.2166/wst.1999.0264 [ Links ]
EKAMA GA and MARAIS P (2004) Assessing the applicability of the 1D flux theory to full scale secondary settling tank design with a 2D hydrodynamic model. Water Res. 38 (3) 495-506. https://doi.org/10.1016/j.watres.2003.10.026 [ Links ]
EKAMA GA and WENTZEL MC (2004) A predictive model for the reactor inorganic suspended solids concentration in activated sludge systems. Water Res. 38 (19) 4093-4106. https://doi.org/10.1016/j.watres.2004.08.005 [ Links ]
EKAMA GA (2009) Using bio-process stoichiometry to build a steady state plant wide wastewater treatment plant model. Water Res. 43 (8) 2101-2120. https://doi.org/10.1016/j.watres.2009.01.036 [ Links ]
EKAMA GA (2010) The role and control of sludge age in biological nutrient removal activated sludge systems. Water Sci. Technol. 61 (7) 1645-1652. https://doi.org/10.2166/wst.2010.972 [ Links ]
EKAMA GA (2011) Biological nutrient removal. In: Wilderer P (ed.) Treatise on Water Science, Vol 4. Academic Press, Oxford. 409-528. https://doi.org/10.1016/B978-0-444-53199-5.00094-4 [ Links ]
GERNAEY KV, JEPPSSON U, VANROLLEGHEM PA and COPP JB (2014) Benchmarking of control strategies for wastewater treatment plants. IWA Scientific and Technical Report (STR) No. 23. IWA Publishing, London. 120 pp. ISBN13:9781843391463, eISBN:9781780401171. https://doi.org/10.2166/9781780401171 [ Links ]
HARDING TH, IKUMI DS and EKAMA GA (2011) Incorporating phosphorus into plant wide wastewater treatment plant modelling - anaerobic digestion. 8th IWA Watermatex Conference, 20-22 June 2011, San Sebastian, Spain. [ Links ]
HENZE M, VAN LOOSDRECHT MCM, EKAMA GA and BRDJANOVIC D (2008) Biological Wastewater Treatment: Principles, Modelling and Design. IWA Publishing, London. 528 pp. ISBN - 10:1843391880; 13:9781843391883. [ Links ]
IKUMI DS, HARDING TH and EKAMA GA (2014) Biodegradability of wastewater and activated sludge organics in anaerobic digestion. Water Res. 56 (1) 267-279. https://doi.org/10.1016/j.watres.2014.02.008 [ Links ]
KAZADI-MBAMBA C, FLORES-ALSINA X, BATSTONE DJ and TAIT S (2016) Validation of a plant-wide phosphorus modelling approach with minerals precipitation in a full-scale WWTP. Water Res. 100 169-183. https://doi.org/10.1016/j.watres.2016.05.003 [ Links ]
LIU DHF and LIPTAK BG (1997) Environmental Engineers' Handbook (2nd edn). CRC Press. ISBN 9780849399718. https://doi.org/10.1201/NOE0849321573 [ Links ]
LIZZARALDE I, FERNANDEZ-AREVALO T, BROUCKAERT CJ, VANROLLEGHAM PA, IKUMI DS, EKAMA GA, AYESA E and GRAU P (2015) A new general methodology for incorporating physical-chemical transformations in multi-phase wastewater treatment process models. Water Res. 74 239-256. https://doi.org/10.1016/j.watres.2015.01.031 [ Links ]
PARCO V, DU TOIT GJG and EKAMA GA (2018) Chapter 2. Biological nutrient removal systems with membranes. In: Mannina G, Ekama GA, Odegaard H and Olsson G (eds) Advances in Wastewater Treatment. IWA Publishing, London. 396 pp. ISBN: 9781780409702. https://doi.org/10.2166/9781780409719_0031 [ Links ]
RAMPHAO MC, WENTZEL MC, MERRITT R, EKAMA GA, YOUNG T and BUCKLEY CA (2005) The impact of membrane solid-liquid separation on the design of biological nutrient removal activated sludge systems. Biotechnol. Bioeng. 89 (6) 630-646. https://doi.org/10.1002/bit.20311 [ Links ]
ROBERTSON J and EKAMA GA (2016) A comparison of conventional activated sludge and integrated fixed film media in MLE, UCT and JHB configurations. Proc. 14th Biennial WISA Conference and Exhibition, 15-19 May 2016, Durban. [ Links ]
SOLON K, FLORES-ALSINA X, KAZADI MBAMBA C, IKUMI DS, VOLCKE EIP, VANEECKHAUTE C, EKAMA GA, VANROLLEGHEM PA, BATSTONE DJ, GERNAEY KV and JEPPSSON U (2017) Plant-wide modelling of phosphorus transformations in wastewater treatment systems: Impacts of control and operational strategies. Water Res. 113 97-110. https://doi.org/10.1016/j.watres.2017.02.007 [ Links ]
SÖTEMANN SW, RISTOW NE, WENTZEL MC and EKAMA GA (2005) A steady state model for anaerobic digestion of sewage sludge. Water SA 31 (4) 511-528. https://doi.org/10.4314/wsa.v31i4.5143 [ Links ]
TARICSKA JR, LONG DA, CHEN JP, HUNG Y-T and ZOU S-W (2009) Chapter 14. Anaerobic digestion. In: Wang LK, Pereira NC, Hung Y-T and Shammas NK (eds) Biological Treatment Processes. Springer. ISBN 978-1-60327-156-1. [ Links ]
TCHOBANOGLOUS G, BURTON FL and STENSEL HD (2004) Wastewater Engineering: Treatment and Reuse (4th edn). Metcalf and Eddy Inc. and McGraw Hill Companies Inc, Boston. [ Links ]
VAN HAANDEL AC, DOLD PL and MARAIS GVR (1982) Optimization of nitrogen removal in the single sludge activated sludge process. Water Sci. Technol. 14 443-446. https://doi.org/10.2166/wst.1982.0118 [ Links ]
WENTZEL MC, DOLD PL, EKAMA GA and MARAIS GVR (1985) Kinetics of biological phosphorus release. Water Sci. Technol. 17 57-71. https://doi.org/10.2166/wst.1985.0221 [ Links ]
WENTZEL MC, EKAMA GA, DOLD PL and MARAIS GVR (1990) Biological excess phosphorus removal - steady state process design. Water SA 16 (1) 29-48. [ Links ]
WENTZEL MC, EKAMA GA and SöTEMANN SW (2006) Mass balances based plant wide wastewater treatment plant models -Part 1: Biodegradability of wastewater organics under anaerobic conditions. Water SA 32 (3) 269-275. https://doi.org/10.4314/wsa.v32i3.5261 [ Links ]
WRC (Water Research Commission) (1984) Theory, design and operation of nutrient removal activated sludge processes (Chapter 4-6). WRC Report No. TT16/84. Water Research Commission, Pretoria. ISBN 0 908356 13 7. [ Links ]
WU WYX and EKAMA GA (2015) A plant-wide steady-state design and analysis program for municipal wastewater treatment plants. 4th YWP-ZA Biennial Conference, 16-18 November 2015, Pretoria. [ Links ]
 Correspondence:
George A Ekama
Email: george.ekama@uct.ac.za
Received: 9 July 2019
Accepted: 12 April 2021
† Presented at the Joint IWA Large Wastewater Treatment (LWWTP) and Nutrient Removal and Recovery (NRR) Conference, Chongquin, China, 6-8 November, 2017
APPENDIX 1
List of abbreviations
1DFT one-dimensional idealized flux theory
AD anaerobic digestion
ADWF average dry weather flow
AS activated sludge
BNR biological nutrient removal
BNRAS biological nutrient removal activated sludge
BPO biodegradable particulate organics
C carbon
COD chemical oxygen demand
d day
DSVI diluted sludge volume index
DWL dewatering liquor
EBPR enhanced biological P removal
FBSO fermentable biodegradable soluble organics
FSA free and saline ammonia
H hydrogen
InOrg inorganic
ISS inorganic suspended solids
JHB Johannesburg NDEBPR system
kWh kilowatt hour
ML megalitre
MLE modified Ludzack-Ettinger ND system
N nitrogen
ND nitrification denitrification
NDEBPR nitrification denitrification enhanced biological P removal
O oxygen
OHO ordinary heterotrophic organism
OP ortho-phosphate
OTR oxygen transfer rate
P phosphorus
PAO phosphorus accumulating organism
PS primary sludge
PST primary settling tank
PSU primary separation unit
PWM plant-wide model
PWSSM plant-wide steady-state model
PWWF peak wet weather flow
SRT solids retention time
SS settleable solids
SSP specific sludge production
SST secondary settling tank
TKN total Kjeldahl nitrogen
TOD total oxygen demand
TP total phosphorus
TSS total suspended solids
TSuspS total suspended solids
UCT University of Cape Town NDEBPR system
UPO unbiodegradable particulate organics
USO unbiodegradable soluble organics
VFA volatile fatty acids
WAS waste activated sludge
WRC Water Research Commission
WRRF water and resource recovery facility
WW wastewater
List of symbols
2.86 electron accepting oxygen equivalent of nitrate (gO/gNO3-N)
a nitrogen composition of organics molN/mol
aopt optimum mixed liquor a-recycle ratio
aprac maximum practical mixed liquor a-recycle ratio
AST surface area of secondary settling tank
b phosphorus composition of organics molP/mol
bAT ANO endogenous respiration rate at
FC/d = bA20(1.029)(T-20) where bA20 = 0.04/d
bHT OHO endogenous respiration rate at T°C/d =
bH20(1.029)(T-20) where bH20 is the rate at 20°C = 0.24/d
Dp1 denitrification of the primary anoxic reactor (mgNO3-N/L influent)
E fraction of biodegradable organics converted to biomass and endogenous residue
fC carbon to mass ratio
fcv COD/mass ratio (gCOD/gVSS for particulates and gCOD/g for soluble)
fcvUPO COD/VSS ratio of influent UPO = 1.481 mgCOD/ mgVSS (see Table 1)
Similarly, each of the influent organics types (VFA, FBSO, USO, BPO and UPO) and biomass (OHO and PAO) has a fcv, fC, fH, fO, fN and fP mass ratio (g element/ gVSS for particulates and g element/g for soluble)
fH hydrogen to mass ratio
fH unbiodegradable fraction of OHO biomass = 0.20 mgVSS/mgOHOVSS
fiOHOinorganic suspended solids (ISS) content of OHO (0.15 mgISS/mgOHOVSS)
fN nitrogen to mass ratio
fO oxygen to mass ratio
fP phosphorus to mass ratio
fq PWWF/ADWF ratio
fSbs fraction of total COD that is readily biodegradable = [Sbsai(VFA) + Sbsfi(FBSO)]/[Sti]
fSupunbiodegradable particulate organics (UPO) COD fraction of total COD
fSusunbiodegradable soluble organics (USO) COD fraction of total COD
fSbs fraction of biodegradable COD that is readily biodegradable
= [Sbsai(VFA) + Sbsfi(FBSO)]/[Sbsai(VFA) + Sbsfi (FBSO) + Sbpi(BPO)]
FSti daily influent COD flux (kgCOD/d) = QADWF Sti
fx1 primary anoxic sludge mass fraction
fx3 secondary anoxic sludge mass fraction
fxa anaerobic sludge mass fraction
fxm maximum unaerated mass fraction of system
fxt total unaerated mass fraction of system (<fxm)
K1T1st (fast) denitrification rate in primary anoxic reactor of ND system due to readily biodegradable organics (VFA+FBSO) at T°C = K120(1.20)(T-20) where K120 is the rate at 20°C = 0.720 mgNO3-N/(mgOHOVSS-d)
K2T 2nd denitrification rate in primary anoxic reactor(s) of ND system due to slowly biodegradable organics (BPO) at T°C = K220(1.08)(T-20) where K220 is the rate at 20°C
= 0.101 mgNO3-N/(mgOHOVSS-d)
K3T denitrification rate in secondary anoxic reactor(s) of ND system due to endogenous respiration at T°C = K320(1.029)(T-20) where K320 is the rate at 20°C
= 0.072 mgNO3-N/(mgOHOVSS-d)
K'2T 2nd denitrification rate in primary anoxic reactor(s) of UCT system due to slowly biodegradable organics (BPO) at T°C = K'220(1.08)(T20) where K'220 is the rate at 20°C
= 0.255 mgNO3-N/(mgOHOVSS-d)
K'3T denitrification rate in secondary anoxic reactor(s) of NDEBPR system due to endogenous respiration at T°C = K'320(1.029)(T-20) where K'320 is the rate at 20°C = 0.114 mgNO3-N/(mgOHOVSS-d)
KnT Monod half saturation coefficient for ANO mgFSA-N/L = Kn20(1.123)(T20) where Kn20 is the coefficient at 20°C
= 1.0 mgN/L
LEBPR EBPR system load factor - kgTSS in reactor per kgCOD/d load on reactor
LND ND system load factor - kgTSS in reactor per kgCOD/c load on reactor
Lsyssystem load factor - kgTSS in reactor per kgCOD/d load on reactor
MXt mass of TSS in reactor = VR Xtave
n coefficient in flux theory settling velocity equation Vs = V0 enXt m/h
Nae effluent ammonia concentration mgN/L
= KnT(bAT + 1/Rs)/[(1-fxt)μAmT-(bAT+1/Rs)] for fxt< fxm
= KnT/(Sf - 1) for fxt= fxmmgFSA-N/L
Nc nitrification capacity = nitrate generated by nitrification mgNO3-N/L influent
Nne effluent nitrate concentration mgNO3-N/L
Nouse nitrogen concentration of the unbiodegradable soluble organics (USO) mgN/L
Nte effluent TKN concentration mgN/L = Nouse + Nae
Nti influent TKN concentration mgN/L
Oa dissolved oxygen concentration in the aerobic reactor mgO/L
Os dissolved oxygen concentration in the underflow from SST mgO/L
QADWF average dry weather flow (ML/d)
QPWWF peak wet weather flow (ML/d)
r mixed liquor recycle ratio from primary anoxic to anaerobic reactor
Rs solids retention time (SRT) or system sludge age (d)
s underflow recycle ratio
Sbsai VFA COD concentration in influent
Sbi biodegradable organics (VFA+FBSO+BPO) COD concentration in influent
Sbsfi fermentable biodegradable soluble (FBSO) COD concentration in influent
Sf safety factor on nitrification
Sti influent flow weighted total organics COD concentration mgCOD/L
T temperature in °C
V0 coefficient in flux theory settling velocity equation
Vs = V0 e-nXt m/h
VR volume of biological reactor (m3)
VS settling velocity (m/h) of activated sludge at Xt kgTSS/m3
x carbon composition of organics molC/mol (= 1.0)
XIOi flow-weighted average influent ISS concentration (mgISS/L)
XtaerTSS concentration in aerobic reactor
Xtavevolume-weighted average TSS concentration in biological reactor
y hydrogen composition of organics molH/mol
YADbiomass yield of the acidogens in AD = 0.113 g biomass VSS/gCOD substrate utilized
YH OHO VSS based yield coefficient = 0.45 mgVSS/mgCOD
z oxygen composition of organics molO/mol
μ Amt ANO maximum specific growth rate at T°C/d
= μAm20 (1.123)(T-20) where μAm20 is the rate at 20°C
APPENDIX 2
Explicit equation for balanced SRT of the MLE system
An explicit equation for the balanced SRT of an MLE system has been derived, viz.
subject to RsBalMLEvalues yielding fxm greater than fx1min in
where the composite parameters
A = influent biodegradable organics (VFA+FBSO+BPO) as mgCOD/L = Sbi = Sti(1-fS.us-fS.up)
B = fb. (1-fcv,OHO Yh)/2.86
C = influent minus effluent TKN concentrations = Nti- Nte mgN/L
D = (apracOa + s Os)/2.86
E = (aprac + s)/(aprac + s + 1) = proportion of nitrate recycled to primary anoxic reactor(s) in MLE and UCT systems

