


Servicios Personalizados
Articulo
 Inglés (pdf)
 Articulo en XML
 Referencias del artículo
Indicadores

Links relacionados
-
 Citado por Google
 -
 Similares en Google
Compartir

 Permalink
Water SA
versión On-line ISSN 1816-7950
versión impresa ISSN 0378-4738
Water SA vol.47 no.1 Pretoria ene. 2021
http://dx.doi.org/10.17159/wsa/2021.v47.i1.9453
RESEARCH PAPER
Water quality assessment using a portable UV optical absorbance nitrate sensor with a scintillator and smartphone camera
JMDFP InglesI; TM LouwII; MJ BooysenI
IDepartment of E&E Engineering, Stellenbosch University, Stellenbosch, South Africa
IIDepartment of Process Engineering, Stellenbosch University, Stellenbosch, South Africa
ABSTRACT
Nitrate contamination of water sources is a global environmental concern. A major source of pollution is agricultural runoff, which can contain decomposed organic matter, fertilizer, and animal or human waste. Nitrate adversely affects the stability of water systems such as dams and rivers and thus also public health. Regulation is essential but difficult to implement, given that measuring nitrates is laborious, and normally done using chemical assays in laboratories. We present a novel portable nitrate sensor that uses a smartphone camera fitted with low-cost optics. The sensor uses ultraviolet absorbance analysis to detect nitrates in water samples and quantify the concentration. The sensor's absorptivity when a bandpass filter was used was 0.0681 L-mg-1-cm-1 compared to 0.0934 L-mg-1-cm-1 measured with a spectrophotometer in a laboratory. Measurements by the sensor of the concentration of nitrates in two environmental samples differed from those taken by the spectrophotometer by 19% and 7%. The sensor achieved a nitrate concentration measurement resolution of 0.2 mg-L-1, and a detection range of 0-5 mg-L-1, with higher concentrations requiring dilution to quantify. Our tests showed that the smartphone-based nitrate sensor is sufficiently accurate to be used as an inexpensive instrument for nitrate analysis in the field.
Keywords: water quality, nitrates, spectroscopic analysis, UV absorbance analysis, smartphone, developing country
INTRODUCTION
Human activity can pollute water sources (Peavy et al., 1985). One of the worst pollutants is nitrogen, particularly nitrates. Nitrates can damage water systems and the health of those who use the water. Some sources of nitrogen are decomposed plants and animals, human and animal waste, wastewater and chemical fertilizers. These contaminate water systems through groundwater discharge, surface runoff or direct discharge into streams. As the contaminants come into contact with the water, the nitrogen is oxidized to form nitrates and released into the water.
Although the numbers reported are unreliable and definitions vary, many people living in Africa do not have access to safe water and sanitation and their survival is often dependent on agriculture, which has a sensitive relationship with water (WHO, 2018; Easterly, 2009). According to the WHO (2018), the practice of extensive agriculture can increase the levels of nitrates in nearby water sources to more than 200 mg-L-1. Most health organizations recommend a level of no more than 25 mg-L-1 - at higher levels complications can occur. People who are obliged to use such water are at risk from the dangers of nitrate pollution.
High concentrations of nitrates cause eutrophication, which can eventually lead to anoxia, threatening higher aquatic lifeforms and creating a favourable environment for disease-causing bacteria. Consumption of water with a high concentration of nitrates may lead to methemoglobinemia (a condition where the blood cannot carry enough oxygen), mucous membrane irritation and even gastric cancer (Peavy et al., 1985; Sohail and Adeloju, 2016; Temkin et al., 2019).
Chromatography, electrochemistry and spectroscopy are the most commonly used methods to detect nitrates (Sohail and Adeloju, 2016; Wang et al., 2017). Chromatography is extremely sensitive, with a low susceptibility to interference from non-analyte ions (i.e., those not of interest in the analysis) or organic materials in samples, but it requires several steps and specialized components, making it more complicated and more expensive than the other two methods. Electrochemistry has great potential, but its sensitivity and accuracy can be influenced by interfering ions and organics, which probably makes it the least suitable for assessing nitrates in most water sources, given their complex composition. Spectroscopy can also suffer from interference, but it is less complicated to use than the other two methods, and has the added advantage of obtaining fast results (Sohail and Adeloju, 2016; Wang et al., 2017).
The convenience and portability of smartphones has led to a surge in smartphone-based devices for analysing various substances (Vashist et al., 2014; Cloete et al., 2016; Srivastava et al., 2018). Levin et al. (2016) developed a smartphone-based fluoride sensor for colourimetric water analysis that compares favourably with established methods. The device uses a smartphone camera to capture colour in the visible spectrum and an algorithm to record and analyse the colour of the sample solutions. The authors reported that the device was compact, low-cost, field-portable, and had a detection range of 0-2 mg-L-1. Hussain et al. (2017) developed a similar inexpensive and portable smartphone-based fluoride sensor, also using colourimetry for testing drinking water. However, instead of using the smartphone camera as the sensor, they used the smartphones ambient light sensor as a light detector and created a smartphone application that can determine the concentration of the fluoride samples and send the collected data to a central water quality monitoring establishment, from any remote area. The device's performance was adequate and similar to that of commercial counterparts, having a resolution of 1.23 X 10⁻⁴ mg-L-1. Colourimetric methods for nitrate analysis are, however, hampered by the need for reagents to produce the chemical reaction that will result in a visible colour.
For mobile health applications, Ding et al. (2018) developed a highly accurate smartphone spectrophotometer that analysed absorption of light in the visible part of the electromagnetic spectrum for the detection of creatinine, an excess of which can indicate kidney problems. They improved the accuracy of the smartphone camera's CMOS sensor (the semiconductor that converts light to electronic signals, similar to the human retina) for spectroscopy by creating a spectral intensity correction algorithm. They found that without the intensity correction the device's performance was inferior to that of a commercial spectrophotometer, but with the intensity correction its performance was similar.
Hossain et al. (2016) developed a smartphone spectrometer which made use of the smartphone's LED flash as the light source and a fibre bundle to direct the light onto the sample. The purpose was mainly to analyse agricultural produce. Wilkes et al. (2017) developed an inexpensive smartphone spectrophotometer specifically for the analysis of sulphur dioxide at 310 nm. Unlike Hossain et al. (2016) and Ding et al. (2018), they used an external camera rather than the phone's internal camera. They modified the Raspberry Pi microcomputer's external camera to enable it to detect UV light at a wavelength of 310 nm. While the devices developed by Hossain et al. (2016) and Ding et al. (2018) required additional optical components, Wilkes et al.'s device needed only a diffraction grating. Their device was able to measure sulphur dioxide at concentration levels similar to those detected by costly counterparts, and they reported that the spectral detection resolution was 1nm.
Most relevant to the topic of this paper, Wang et al. (2015) developed a low-cost portable smartphone electrochemical nitrate sensor using cyclic voltammetry. They created an application for reporting the geospatial locations of the collected samples. Their device performed well using standard samples, but in certain environmental samples reported much lower concentrations than established methods.
The studies cited above demonstrate the effective use of smartphone-based technologies for measurements in the field in a variety of applications. However, the use of smartphones to perform spectroscopy in the wavelength range lower than 300 nm has to our knowledge not been reported. The device we describe in this paper can be used for UV analysis at wavelengths as low as 205 nm, without the need for an additional and/or modified external camera.
Our contribution to the growing list is a portable device that measures nitrate concentrations in water. The design of our smartphone-based nitrate sensor is based on a standard laboratory spectrophotometer, but with fewer components, and the advantage of being portable and less expensive. Since nitrates absorb light at 205 nm; we used UV absorbance analysis. We explored the use of a smartphone camera as the detecting mechanism for the analysis of nitrate in water samples. However, since smartphone cameras are unable to detect UV light at this wavelength, we used a scintillator to convert UV light into visible green light. In tests our smartphone-based nitrate sensor worked with an accuracy fairly similar to that of a typical spectrophotometer.
METHOD
The inspiration for our design was the common spectrophotometer whose design we adapted to be simpler and more compact than the typical laboratory spectrophotometer, and less expensive. The components are shown in Figure 1, which illustrates both the physical prototype, the functional diagram, and an example of the resulting captured image.
Our design uses a smartphone camera to detect the amount of UV light transmitted through the water samples. We used an iPhone Xs Max (Apple Inc) with a 12 MP camera, with the aperture sized fixed at f/1.8.
Nitrates absorb light mostly in a subsection of the UV-C range, between 195 and 210 nm, and has a peak absorbance at wavelength λmax= 205 nm (Drolc and Vrtovosek, 2010; Karlsson et al., , 1995). The absorbance of light passing through a sample is defined by:
where I0is the intensity of the light transmitted through a reference sample, and I is the intensity of the light transmitted through an analyte sample (i.e. a sample containing the substance to be measured) (Higson, 2004; Skoog et al., 2018). The Beer-Lambert Law states that the amount of light a sample absorbs is proportional to the concentration of the analyte sample (Higson, 2004; Skoog et al., 2018). The relationship between the absorbance and the concentration in a sample is given by:
where e is the molar absorptivity, C is the concentration of the analyte, and l is the path length.
Spectrophotometers are generally designed to analyse a wide range of chemicals, which means they must be able to measure the absorbance of light across a broad spectrum. However, a fit-for-purpose spectrophotometer can be designed for a specific wavelength.
For nitrates, the wavelength of interest is 205 nm. A basic spectrophotometer requires at least a light source, sample holder, and detector. Deuterium lamps are almost exclusively used to provide light in the UV spectrum (approximately 195 to 400 nm) (Skoog et al., 2018). Additional optics, such as a monochromator (an optical device that transmits a mechanically selectable narrow band of wavelengths of light), may be necessary if the desired accuracy is not achieved. Adjustable monochromators are used to ensure that light passing through the analyte sample radiates at a narrow band of wavelengths. Alternatively, a narrowband bandpass filter with a centre wavelength at λmaxof the analyte may be used (Skoog et al., 2018). The main shortcoming of such a filter is that it can test only for a fixed wavelength, whereas the monochromator can be adjusted to test in a narrow band for a range of wavelengths.
A cuvette is used as a sample holder in spectroscopy, made of either quartz, plastic or glass, depending on which part of the spectrum is being tested for. For our device the most suitable was quartz, since it is the only material with negligible absorbance at 205 nm (Skoog et al., 2018). We used a cuvette with an optical pathlength of 1 cm.
The sensitivity and accuracy of spectroscopic measurements are influenced by the analyte concentration and the presence of interfering ions or organic matter in the sample. The BeerLambert Law is limited to low concentrations; in highly concentrated samples, the absorbance properties of the molecules and the ability of light to travel through the sample are altered, thereby affecting the linear relationship described in Eq. 2 (Skoog et al., 2018; Simulab). Interfering ions or organic matter may lead to light dispersion or absorption at the wavelength of interest, thereby decreasing measurement accuracy (Skoog et al., 2018; Wenzel and Dana, 2020).
Since smartphone cameras do not detect UV light at wavelengths as low as 205 nm, we used a scintillator to convert the light transmitted through the analyte into the visible spectrum. We used a Lumilass-G9 (green fluorescent glass) (Sumita Optical Glass Inc, Japan), a scintillator that fluoresces a green light with an intensity proportional to that of UV light at 200 to 400 nm.
We evaluated a number of light sources and found that the only commercially available compact source that emits light at the relevant wavelength was the Compact FiberLight D2 (Heraeus, Germany), weighing 104 g, with a maximum power consumption of 7 W from a 12 V supply, and comprising two independently switchable deuterium and tungsten lamps (Heraeus Holding). The deuterium lamp is suited to UV analysis between 185 and 400 nm, thus including the band of interest. It would have been preferable to use an LED source, for size, power and cost considerations. However, we were unable to find any commercially available ones that worked at the required wavelengths.
Since optical components added to the size, complexity and cost of our device, we evaluated the effect of replacing or omitting them. Since the object was to detect only nitrates, we considered the monochromator unnecessary and replaced it with a narrow-band bandpass filter, which is more compact, easier to use, and cheaper. The narrow-band bandpass filter (Edmund Optics) was placed in between the sample holder and the light source, as shown in Figure 1. With a centre wavelength of 200 nm and a bandwidth of 10 nm, it was well suited for the peak wavelength of nitrates, 205 nm. We assessed the performance of our device with and without the bandpass filter, and compared the results with those from an AE-S60 laboratory spectrophotometer (A & E Lab Instruments).
The optically transparent sides of the cuvettes and the scintillator were placed in line with the light beam, as shown in Figure 1. The smartphone camera was positioned at a 90° angle to the scintillator, to minimize the unintended detection of scattered leaking light from the deuterium lamp. This is a configuration commonly used in fluorescence spectroscopy to eliminate interference from the light source (Yu et al., 2014; Zhao and Sakurai, 2017).
An image of the green light fluoresced by the scintillator was captured by the smartphone for each reference sample and nitrate sample. We quantified the intensity of the transmitted light by determining the aggregated intensity of the pixels of each green image. We could then calculate the absorbance by using Eq. 1. To measure and compare the UV light absorbances of the spectrophotometer and our smartphone-based nitrate sensor, we prepared triplicate nitrate samples by dissolving sodium nitrate in distilled water, with concentrations ranging from 1-10 mg-L-1. The measured absorbances were used to generate a nitrate concentration calibration curve, as described by Eq. 2. Using this equation, the sensor could determine the concentration of unspecified nitrate samples.
We evaluated the two versions of the smartphone-based nitrate sensor (with and without the bandpass filter) individually, against each other and against the AE-S60 spectrophotometer. The individual evaluations consisted of measuring the absorbance of three sets of known samples. The means of these three sets and standard errors are reported in the results. We determined and assessed the relationship between the absorbance and the concentration using the Beer-Lambert Law. We then compared the relationship found by both versions of our sensor with each other and with that found by the spectrophotometer. Finally, we compared the result from the version of our sensor that gave the better performance with the result from the spectrophotometer, using samples from a wastewater treatment plant.
RESULTS
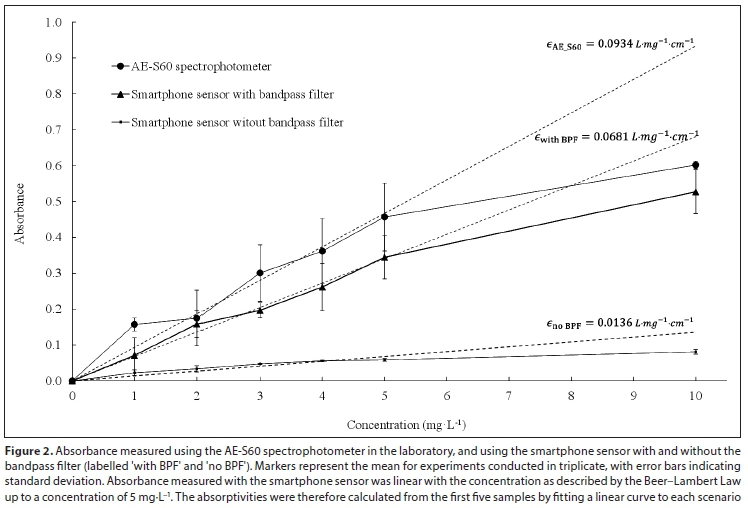
Figure 2 shows the absorbance levels measured with the AE-S60 spectrophotometer and with the smartphone-based sensor using concentrations of 1-10 mg-L-1. As mentioned, we evaluated our smartphone-based sensor with and without the bandpass filter.
Each concentration level was tested in triplicate with different samples, with the cuvette removed and replaced between tests to evaluate repeatability. The absorbance increased linearly with concentrations up to 5 mg-L-1. Above this point, the increase was non-linear, indicating that the Beer-Lambert Law fails above 5 mg-L-1. We therefore used only the results from the first five concentrations in a linear regression. The spectrophotometer achieved a molar absorptivity (a measure of how strongly the nitrate attenuates light at a particular wavelength) of 0.0934 L-mg-1-cm-1. The smartphone-based sensor achieved a molar absorptivity of 0.0136 L-mg-1-cm-1 without the bandpass filter, and 0.0681 L-mg-1-cm-1 with the bandpass filter. Although both versions measured absorbances proportional to the actual concentrations, the sensitivity was greater with the bandpass filter than without.
The results with the bandpass filter were also better aligned with the results obtained from the spectrophotometer. The molar absorptivity determined with the filter differed from that of the spectrophotometer by only 27%, compared to 85% without the filter. Without the filter, the light passing through the sample had a wide bandwidth of 185-400 nm; with the filter it was only 195205 nm. As noted earlier, nitrates absorb light mostly between approximately 195 nm and 210 nm, with peak absorption at 205 nm. Outside of this band little to no light is absorbed. If a wide interval of wavelengths between 185 and 400 nm passes through a sample containing nitrates, the fraction of light that is absorbed will be small. The transmitted light (primarily consisting of light with wavelengths longer than 210 nm) would still cause excitation and fluorescence in the scintillator, effectively decreasing the sensitivity of the instrument. The bandpass filter blocks approximately 95% of the light from the source, resulting in a larger fraction of the light being absorbed by a nitrate analyte. The inclusion of the bandpass filter thus decreases the noise induced by the use of a polychromatic light source, which leads to improved measurement sensitivity.
Our results demonstrated, firstly, that that the use of a scintillator enables the detection of UV range absorption using a smartphone and, secondly, that a narrow-band bandpass filter increases the sensitivity and performance of our smartphone-based nitrate sensor. Our final design therefore included the bandpass filter.
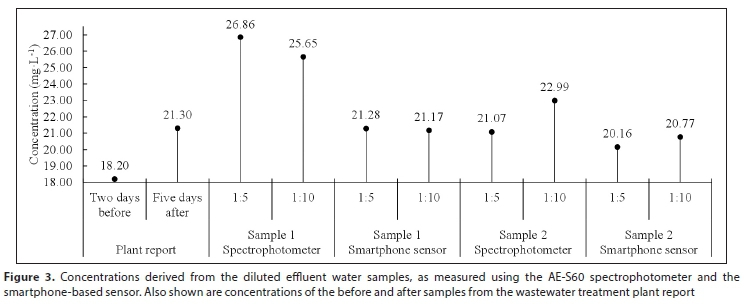
To demonstrate that our smartphone-based nitrate sensor also works with a real-world sample, we benchmarked it against the spectrophotometer using treated effluent from a wastewater treatment plant, which has stringent regulations for nitrate levels. The concentration of nitrates in effluent water depends on many factors, including season, region, and plant operations, so the concentration can vary from less than 1 mg-L-1 to over 30 mg-L-1 (Agoro et al., 2018). This gave us an environmental sample of which we did not know the concentration. Two separate samples were taken and each diluted to provide multiple sampling points, at ratios of 1:5 and 1:10. We analysed the four diluted samples and then calculated the original concentration in the two undiluted samples. We measured the concentration of each diluted sample using the spectrophotometer and the smartphone-based nitrate sensor and then calculated the average concentration of the original two samples. The results are shown in Figure 3.
The difference between the concentration of the effluent samples measured with the spectrophotometer and the smartphone-based nitrate sensor was 19% for the first and 7% for the second. At the wastewater treatment plant where the effluent water was collected, samples are taken weekly as part of operational reporting. Figure 3 also shows the concentrations reported by the wastewater treatment plant 2 days before and 5 days after our sample was taken.
Overall, the nitrate concentrations reported by the smartphone-based nitrate sensor were lower than those reported by the spectrophotometer, but within the values reported by the wastewater treatment plant. It is interesting to note that the smartphone-based sensor's readings were closer than the AE-S60 spectrophotometer's to the readings from the treatment plant.
CONCLUSION
The overall performance of our smartphone-based nitrate sensor suggested that it could be used to measure the concentration of nitrates in water. It was designed to be usable and portable beyond the confines of a laboratory. Although colourimetry can be used inexpensively for nitrate analysis, spectroscopy is more convenient as it does not require prerequisite steps to be performed on the sample. This was therefore the method we chose for our device. In contrast to existing methods described in the literature for analysing visible or UV light at 310 nm, our smartphone-based nitrate sensor can perform UV analysis at 205 nm.
Our experiment confirmed that UV spectrum absorbance analysis can be performed through the combined use of a smartphone and a scintillator and, further, that a bandpass filter can be used to replace a monochromator for applications focusing on a specific wavelength, thereby greatly simplifying the optical requirements.
Finally, when we compared the results obtained using a standard laboratory spectrophotometer with those obtained using the smartphone-based sensor for laboratory-prepared nitrate samples with known concentrations, we found that our device's performance was very similar to that of the laboratory instrument. Tests using samples from a wastewater treatment plant produced similar performances. Further research must be carried out to validate the system for in-the-field nitrate concentration measurement on water samples, to investigate the effects of interfering compounds in real water samples. Such a study would require investigating a large number of samples of different origins.
We focused on the detection of nitrates, but our results show that a low-cost fit-for-purpose smartphone-based device can achieve measurement accuracy and sensitivity similar to that of an established laboratory instrument, which comes with greater flexibility, but at much greater cost and the disadvantage of not being portable.
ACKNOWLEDGEMENT
The authors would like to thank MTN South Africa for their financial and technical support through the MTN Mobile Intelligence Lab.
REFERENCES
AGORO MA, OKOH OO, ADEFISOYE MA and OKOH AI (2018) Physicochemical properties of wastewater in three typical South African sewage works. Polish J. Environ. Stud. 27 491-499. https://doi.org/10.15244/pjoes/74156 [ Links ]
CLOETE NA, MALEKIAN R and NAIR L (2016) Design of smart sensors for real-time water quality monitoring. IEEE Access. 4 3975 - 3990. https://doi.org/10.1109/ACCESS.2016.2592958 [ Links ]
DING H, CHEN C, QI S, HAN C and YUE C (2018) Smartphone-based spectrometer with high spectral accuracy for mHealth application. Sensors Actuators A: Phys. 274 94-100. https://doi.org/10.1016/j.sna.2018.03.008 [ Links ]
DROLC A and VRTOVSEK J (2010) Nitrate and nitrite nitrogen determination in waste water using on-line UV spectrometric method. Bioresour. Technol. 101 4228-4233. https://doi.org/10.1016/j.biortech.2010.01.015 [ Links ]
EASTERLY W (2009) How the Millennium Development Goals are unfair to Africa. World Dev. 37 26-35. https://doi.org/10.1016/j.worlddev.2008.02.009 [ Links ]
HERAEUS HOLDING (2020) FiberLight D2* Portfolio. Heraeus Holding. URL: https://www.heraeus.com/en/hng/products_and_solutions/lamps_for_optics_and_analytics/fiberlight/fiberlight_d2/fiberlight.html (Accessed 13 December 2020). [ Links ]
HIGSON S (2004) Analytical Chemistry. Oxford University Press, New York. [ Links ]
HOSSAIN MA, CANNING J, COOK K and JAMALIPOUR A (2016) Optical fiber smartphone spectrometer. Optics Letters. 41 2237. https://doi.org/10.1364/OL.41.002237 [ Links ]
HUSSAIN I, AHAMAD KU and NATH P (2017) Low-cost, robust, and field portable smartphone platform photometric sensor for fluoride level detection in drinking water. Anal. Chem. 89 767-775. https://doi.org/10.1021/acs.analchem.6b03424 [ Links ]
KARLSSON M, KARLBERGB BO and OLSSONA RJ (1995) Determination of nitrate in municipal waste water by UV spectroscopy. Anal. Chim. Acta. 312 107-113. https://doi.org/10.1016/0003-2670(95)00179-4 [ Links ]
LEVIN S, KRISHNAN S, RAJKUMAR S, HALERY N and BALKUNDE P (2016) Monitoring of fluoride in water samples using a smartphone. Sci. Total Environ. 551-552 101-107. https://doi.org/10.1016/j.scitotenv.2016.01.156 [ Links ]
PEAVY HS, ROWE DR and TCHOBANOGLOUS G (1985) Environmental Engineering. McGraw-Hill Book Company, USA. [ Links ]
SIMULAB (2020) Study Notes: Deviations from Beer's Law. http://simulab.ltt.com.au/5/Laboratory/StudyNotes/snDeviatFromBeerLaw.htm (Accessed 13 December 2020). [ Links ]
SKOOG DA, HOLLER FJ and NIEMAN TA (2018) Principles of Instrumental Analysis 7th edn.). Cengage, Boston. [ Links ]
SOHAIL M and ADELOJU SB (2016) Nitrate biosensors and biological methods for nitrate determination. Talanta. 153 83-98. https://doi.org/10.1016/j.talanta.2016.03.002 [ Links ]
SRIVASTAVA S, VADDADI S and SADISTAP S (2018) Smartphone-based system for water quality analysis. Appl. Water Sci. 130 1-13. https://doi.org/10.1007/s13201-018-0780-0 [ Links ]
TEMKIN A, EVANS S, MANIDIS T, CAMPBELL C and NAIDENKO OV (2019) Exposure-based assessment and economic valuation of adverse birth outcomes and cancer risk due to nitrate in united states drinking water. Environ. Res. 176 108442. https://doi.org/10.1016/j.envres.2019.04.009 [ Links ]
VASHIST SK, MUDANYALI O, SCHNEIDER EM, ZENGERLE R and OZCAN A (2014) Cellphone-based devices for bioanalytical sciences. Anal. Bioanal. Chem. 406 3263-3277. https://doi.org/10.1007/s00216-013-7473-1 [ Links ]
WANG QH, YU LJ, LIU Y, LIN L, LU R, ZHU J, HE L and LU Z (2017) Methods for the detection and determination of nitrite and nitrate: A review. Talanta. 165 709-720. https://doi.org/10.1016/j.talanta.2016.12.044 [ Links ]
WANG X, GARTIA MR, JIANG J, CHANG TW, QIAN J, LIU Y, LIU X and LIU GL (2015) Audio jack based miniaturized mobile phone electrochemical sensing platform. Sensors Actuators, B: Chem. 209 677-685. https://doi.org/10.1016/j.snb.2014.12.017 [ Links ]
WENZEL T and DANA CA (2020) Beer's law. https://chem.libretexts.org/Bookshelves/Physical_and_Theoretical_Chemistry_Textbook_Maps/Supplemental_Modules_(Physical_and_Theoretical_Chemistry)/Spectroscopy/Electronic_Spectroscopy/Electronic_Spectroscopy_Basics/The_Beer-Lambert_Law (Accessed 13 December 2020). [ Links ]
WHO (2018) Developing drinking-water quality regulations and standards: general guidance with a special focus on countries with limited resources. World Health Organisation, Geneva. https://apps.who.int/iris/bitstream/handle/10665/272969/9789241513944-eng.pdf (Accessed 13 December 2020). [ Links ]
WILKES TC, MCGONIGLE AJS, WILLMOTT JR, PERING TD and COOK JM (2017) Low-cost 3D printed 1 nm resolution smartphone sensor-based spectrometer: instrument design and application in ultraviolet spectroscopy. Opt. Lett. 42 4323. https://doi.org/10.1364/OL.42.004323 [ Links ]
YU H, TAN Y and CUNNINGHAM BT (2014) Smartphone fluorescence spectroscopy. Anal. Chem. 86 8805-8813. https://doi.org/10.1021/ac502080t [ Links ]
ZHAO W and SAKURAI K (2017) CCD camera as feasible large-area-size X-ray detector for X-ray fluorescence spectroscopy and imaging. Rev. Sci. Instrum. 88. https://doi.org/10.1063/1.4985149 [ Links ]
 Correspondence:
MJ Booysen
Email: mjbooysen@sun.ac.za
Received: 8 April 2020
Accepted: 14 December 2020

