


Servicios Personalizados
Articulo
 Inglés (pdf)
 Articulo en XML
 Referencias del artículo
Indicadores

Links relacionados
-
 Citado por Google
 -
 Similares en Google
Compartir

 Permalink
Water SA
versión On-line ISSN 1816-7950
versión impresa ISSN 0378-4738
Water SA vol.47 no.1 Pretoria ene. 2021
http://dx.doi.org/10.17159/wsa/2021.v47.i1.9452
RESEARCH PAPER
Relationship between water quality and physical conditions of domestic storage tanks supplied by a water utility in a rapidly growing city
EW MakokoI; E WozeiII; L BirungiIII
INational Water and Sewerage Corporation. Plot 3, Nakasero Road, PO Box 7053, Kampala, Uganda
IIFaculty of Engineering and Environment, Uganda Christian University, PO Box 4, Mukono, Uganda
IIIClarke International University, Plot 4686, St. Barnabas Road, PO Box 7782, Kampala, Uganda
ABSTRACT
Domestic water storage tanks are commonly used in urban centres of developing countries such as Uganda to enable reliable access to water. However, little work has been done on the conditions of domestic water storage tanks since it is assumed that water received meets the required standards and guidelines for drinking water. In 2015, over 80% of the water quality complaints raised by water utility customers in Kampala were about water from storage tanks. In this study we assessed water quality in, and conditions of, domestic storage tanks, for customers supplied by a water utility from March - August 2017 in Kampala, Uganda. Longitudinal assessment of 372 storage tanks in 6 sampled wards involved a minimum of 6 samples collected from each site in both wet and dry months of 2017. A set of guiding questions was used to establish tank conditions, with a 'yes' or 'no' response and a range of 'low' to 'critical' risk ratings. The study showed that there were three main types of storage tanks: plastic (88%), concrete (7%), and metal (5%). Of these tanks, 84% were elevated, 41% were less than 5 years old, 69% were not cleaned annually, and 88% were covered. There was a statistically significant relationship (p < 0.05) between tank physical conditions and quality of stored water. Wards with unplanned and industrial settlements had the highest number of tanks with contaminated water. The study therefore revealed that the physical conditions and management of domestic water storage tanks have an effect on water quality. This is important information for a water utility as it means that it is not enough to supply safe water if the quality may deteriorate upon storage at the consumer premises. A routine inspection checklist and consumer guidelines for domestic storage tank management are proposed.
Keywords: water quality, domestic storage tank, tank conditions, contamination, water utility
INTRODUCTION
Worldwide, water supply systems include storage facilities. However, storage facilities were originally developed based on hydraulic system operation and not water quality (Kirmeyer, 1999). Many cities in developing countries are still faced with water supply problems. Intermittent water supply has led some households to install water storage tanks to respond to water outages (Malanda and Louzolo-Kimbembe, 2014), meaning that water utility customers use water storage facilities like overhead tanks to ensure a reliable continuous water supply on their premises.
Studies have revealed that water storage tanks have an impact on the quality of water if not properly managed in hygienic ways, such as routine cleaning and covering of openings (Chalchisa et al., 2017; EPA, 2002; Levy et al., 2008; Schafer and Mihelcic, 2012). Akuffo et al. (2013) and McLarnan (2017) reported the re-growth of bacteria in water stored during short or long periods. Bacterial re-growth is enhanced by high temperatures and low disinfectant residual. For example, Akuffo et al. (2013) recorded up to 250 colony forming units (CFU)/100 mL for faecal coliforms (FC) from water storage tanks in Ghana.
Furthermore, it has been reported by the EPA (2002) that sanitary conditions such as the presence of sediments, biological growth, and floatable debris/insects in the tank, and rodent or bird activity on and around the tank can compromise the quality of water. As such, the quality of water in these storage facilities is questionable since the Uganda's National Water and Sewerage Corporation (NWSC) mandate does not involve monitoring customer's water storage tanks (Water Act, 2000).
Kampala City in Uganda, a rapidly growing city in the developing world, is also faced with the challenge of water quality. Recently, there was an outbreak of typhoid fever in Kampala City (WHO, 2015). The outbreak was linked to the challenges to water quality from bacteria or other microorganisms unintentionally transferred from substances or objects to stored water (Murphy et al., 2017).
Additionally, most of the facilities used in Uganda for domestic water storage are located in sites such as rooftops, ceilings, on overhead stands or underground. This makes their monitoring, inspection, and maintenance difficult.
In 2015, as for previous years, the NWSC received numerous complaints about contaminated water from its customers, and especially those who had domestic storage tanks in Kampala. Over 80% of the water quality complaints raised were about water from storage tanks (NWSC, 2015a). It was thus considered important to assess the water quality, tank conditions and contamination levels of domestic water storage tanks of a water utility in a rapidly growing city in the developing world.
The study therefore answered the following research questions:
• What is the quality of water in the domestic water storage tanks for NWSC customers?
• What is the association between the tank conditions (such as the presence of sediment, biological growth, and floatable debris, insects in the tank, rodent or bird activity on and around the tank) and water quality in the domestic water storage tanks for NWSC customers?
• What is the comparison of contamination levels of domestic water storage tanks for NWSC customers in different wards of Central Division of Kampala City?
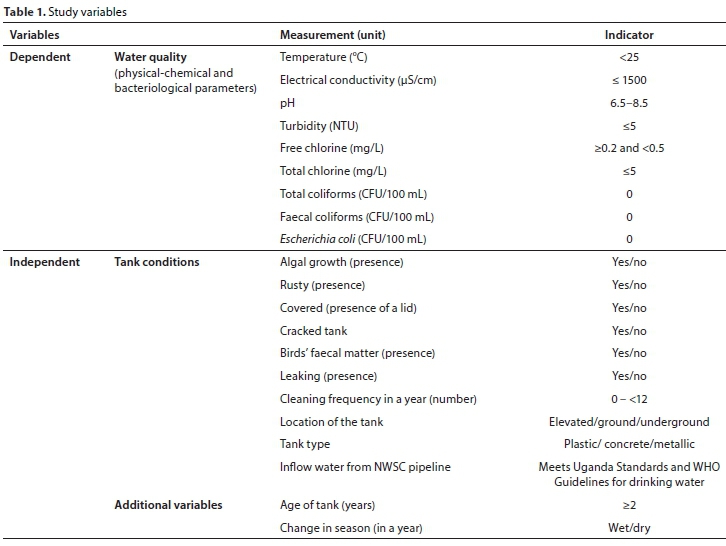
The conceptual framework describing the Ugandan scenarios and tracing the relationship that is theorized to exist between the conditions of domestic water storage tanks and water quality poses that water quality is influenced by the conditions of the tank (including type, covered, cracked, leaking, location, age of the tank), sanitary conditions (such as algal growth, cleaning frequency, rust and bird faecal matter), change in season and inflow water from NWSC pipeline. The independent variables are the factors potentially affecting the quality of water in the tank while the dependent variables are indicators of water quality (such as turbidity, free and total chlorine, faecal coliforms, total coliforms, Escherichia coli) in the tank.
METHODOLOGY
Study design
A longitudinal assessment of water quality in 372 storage tanks/ households in 6 sampled wards in Kampala District was conducted between March and August 2017. A minimum of 6 samples was collected from each site in both wet (March-May) and dry (June-August) months (Arnold and Elliot, 1996; Caffrey et al., 2013; Uganda National Meteorological Authority (UNMA), 2016; World Bank, 2016). Sampling was done weekly, with an average of 17 samples picked each day until 62 samples were obtained from each ward every month for the dry and wet seasons.
Data for wet and dry seasons were analysed separately, but we also analysed the data without considering the seasons. For the wet and dry seasons, observations were averaged for the three months to get a single measurement for each continuous variable. For the factor variables, the most frequently occurring observation within the three months was used. The observations for the 6 months were averaged to get a single measure to use for general analysis of each of the continuous variables, and the most frequently occurring observation over the six months was used for the factor variables. To answer the first research question, a multivariate analysis was conducted and the simultaneous 95% Hotellings's T2 interval was calculated. The null hypothesis (H0:μn = 0) was tested to reveal if the water quality variables met the guidelines and standards for water quality. A Hotelling-Lawley trace (trace(A)IMAGEMAQUI was used to test the null hypothesis.
To answer the second question, principal component analysis (PCA) was used to reduce the number of dependent variables. For all the analysis categories, the first principal component was used because it explained 87.6%, 91.2% and 92% ofthe total variation in the wet, dry and general data categories, respectively. We then applied the linear models to find factors associated with water quality.
To answer the third question, the sampling points (domestic water storage tanks) were georeferenced in the study area using a handheld global positioning system (GPS). A risk score analysis was conducted on each water storage tank. These risk scores were then used in categorising and mapping of water contamination levels in the wards. The sanitary conditions scores were collated with the E. coli contamination risk scores. The wards with increasing levels of risk, from 'low, 'medium, 'high' or 'critical' risk scores, in comparison to other wards were referred to as 'most risk-prone wards'.
Wet and dry seasons
March, April and May (18-28°C; 130-175 mm rainfall per month) were considered as wet months and June, July and August (16-25°C; 46-86 mm rainfall per month) as dry months (UNMA, 2016; World Bank, 2016). This was done in order to monitor the impacts due to a change in season on water storage tanks (WHO, 1996). Change in season (wet to dry) would further enhance algal growth which would in turn increase the turbidity and bacteriological contamination, thus influencing water quality in the tank. Additionally, light enhances algal growth.
Furthermore, inflow water from NWSC pipelines could already be contaminated, thus affecting the water in the storage tank.
Study area
The study was conducted in Kampala District, Kampala Capital City, in the Central Division. Kampala is the capital city of Uganda that is located in the central region of the country and covers a surface area of 195 km2 (Fig. 1) (MCHG, 2004). The city consists of 5 divisions: Central, Kawempe, Makindye, Rubaga and Nakawa.
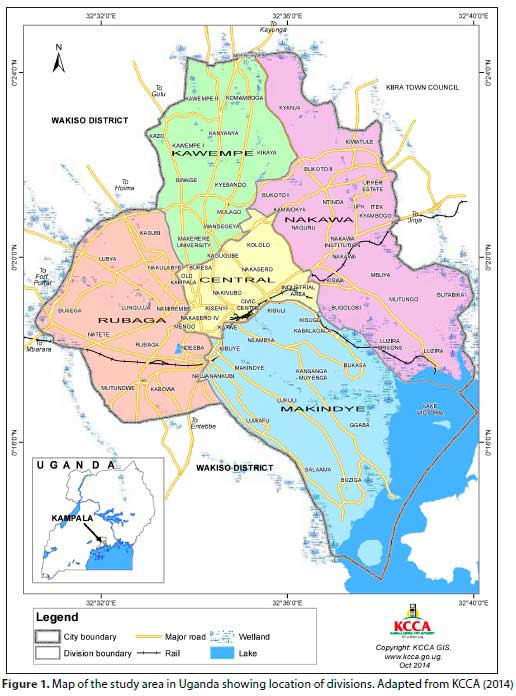
Population and sampling techniques
The study was conducted in the six wards of the Central Division of Kampala City, Uganda. Kampala City was chosen because it is one of the larger cities in sub-Saharan Africa with a growing population at about 3.9% per annum, and rapid development. (Kulabako et al., 2010). The Central Division (Fig. 1) comprises of central business district commercial areas (Nakasero, Kisenyi, Industrial Area), upmarket residential areas (Kololo, Kamwokya, Old Kampala) and slums (Kisenyi, Mengo/Namirembe-Bakuli, Bukesa, Kagugube), a combination that is common with most developing country cities. The Central Division also had the greatest number of NWSC customers with water connections and had registered the most complaints about questionable quality of water at their premises (NWSC, 2015c; NWSC, 2016). As of June 2016, the Central Division had the highest number (2 570 or 28%) of water connections in Kampala City, and 69% (1 897) of the Central Division connections had domestic water storage tanks (NWSC, 2016).
A preliminary study was conducted to identify buildings/NWSC customers that had a domestic water storage tank of more than 2 years old in use in each ward. This period was assumed to be adequate for tank conditions to cause water quality deterioration, if any, in the storage tanks. Only buildings that had a NWSC water connection with domestic water storage tanks were considered, to establish the water quality and their conditions for a water utility in a developing country. This was to generate and provide documented information about integrity of a water utility with domestic water storage tanks.
A Krejcie and Morgan table was used to determine the sample size (Krejcie and Morgan, 1970). The sample size calculation was based on p = 0.05; where the probability of committing a Type I error is less than 5% or p < 0.05. The following formula was used:
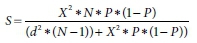
where S = required sample size; X2 = the table value of chi-square for 1 degree of freedom at the desired confidence level (0.05); N = the population size; P = the population proportion (assumed to be 0.50 since this would provide the maximum sample size and d = the degree of accuracy expressed as proportion (0.05) (Krejcie and Morgan, 1970).
While there were 1 897 NWSC customer connections in the study area, all of the 11 856 water connections in Kampala City Centre were taken as the population size (N), giving 372 connections as the sample size (S) from Krejcie and Morgan tables (320) plus 50 additional connections as a factor of safety. Cluster random sampling was used where the whole geographical population was divided into clusters (wards). A random sample from each cluster of 62 NWSC customers was performed (Wilson, 2010). This was done according to whether the customer had a water storage tank, accessibility and willingness to participate. This sample size was considered statistically significant and representative of NWSC customers in the study area and useful in drawing correct conclusions (Krejcie and Morgan, 1970). At a confidence level of 95% with an error of 0.05, the sample size gave valid and reliable results for a generalized population.
Data collection
The study considered the variables shown in Table 1.
Risk score
A set of guiding questions was used to establish tank conditions with a 'yes' or 'no' response. The seven questions used to assess sanitary conditions included: is the tank covered, is the tank always cleaned, is the tank cracked, does the tank leak, is there growth of algal in the tank, is the tank rusty/have accumulated sludge, and, are there foreign materials like bird faeces on or around the tank?. Each carried a maximum risk effect weight of 10. Each response had a risk score assigned with a range of 0 to 10; 0 being low and 10 being critical.
A total risk score for each sample point (domestic water storage tank) was then obtained by adding all risk scores to establish a risk ranking for sanitary conditions: 0-17 (low), 18-35 (medium), 36-53 (high), 54-70 (critical). Using CFU/100 mL, E. coli risk scores were categorised as 0 = low; 1-10 = medium; 11-19 = high; and >20 = critical. The risk scores were converted into percentages to allow for comparison (DPHE, 2005; DWAF, 1996; Howard and Bartram, 2003; WHO, 1996).
The tank conditions were considered because a cracked and leaking tank could provide a channel for contamination of the stored water from the environment. Rust, especially from metallic tanks, could contribute to the turbidity and colour of the water in the storage tank. This would directly affect the dependent variable. The age of the tank could also indicate the condition of the tank with regard to its ability to store water, and the level of accumulated sludge if it had never been cleaned, thus affecting the water quality. If the tank was located under a tree and is open, foreign matter and bird and animal droppings could contaminate the water.
Water quality
All samples were tested for physical, chemical and bacteriological properties.
250 mL pyrex glass bottles were used for samples of bacteriological parameters and 200 mL plastic bottles were used for samples for physicochemical parameters. All containers were prepared as outlined in the NWSC Standard Operating Procedures (NWSC, 2015b).
Sampling, and transportation of samples, was done in accordance with the recommended protocols as outlined by Standard Methods for the Examination of Water and Wastewater by Rice et al. (2017). Samples were collected from the water storage tanks using a previously sterilized deep sampler. A reference sample of inflow water from NWSC was also taken alongside this (this was not done consistently, but the monthly NWSC water quality results for a study period have been compared to the study findings for statistical comparisons -Table 2). Turbidity, pH, temperature, free and total chlorine were measured on site as they could change during transportation.
The laboratory experimental work involved determination of physical, chemical and bacteriological parameters of water samples using methods described in the APHA, AWWA and WEF joint publication, Standard Methods for the Examination of Water and Wastewater (Rice et al., 2017).
Turbidity was measured using a handheld turbidimeter (HACH 2100Q with ± 2% of reading plus stray light accuracy), while free and total chlorine were determined using a pocket colorimeter (HACH, Pocket Colorimeter II with ± 2nm wavelength accuracy), DPD and 1% potassium iodide (KI) solution, respectively. Electrical conductivity (EC), temperature and pH were measured using a multi-meter probe (HACH, HQ30D Portable Meter with 0.5 |iS/cm, ±0.3°C and 0.002 pH accuracies, respectively).
Faecal and total coliform counts of the water were determined by membrane filtration with sodium lauryl sulphate broth technique with 47 mm diameter, 0.45 |im pore size cellulose ester membrane filters incubated at 44°C and 37 °C for 18 h for faecal and total coliforms, respectively, and results reported as CFU/100 mL (Rice et al., 2017; Oshiro, 2002; NWSC, 2015b). For determining the presence of E. coli bacteria, E. coli agar was used instead of sodium lauryl sulphate broth and the same procedure as above was followed with incubation at 37°C for 18 h (Rice et al., 2017; Oshiro, 2002; NWSC, 2015b).
Association between tank conditions and water quality
A sanitary survey was conducted on each domestic water storage tank to ascertain its physical condition. Each tank was assessed for various characteristics (tank type; location; age; cleaning frequency in a year; whether covered, cracked or leaking; presence of bird faecal matter, algal growth, rust or sludge). This was to determine whether the various characteristics of the tanks had an effect on water quality relative to the standards for drinking water quality (Uganda Standards, 2014) and WHO (2017) guidelines. Seven guiding questions were used to assess sanitary conditions, each carried a maximum risk effect weight of 10.
A chi-square test of independence was used to assess the degree of association between study variables, while the factors associated with poor quality of water were analysed using principal component analysis (PCA) to reduce the dependent variables. The linear model to find factors associated with water quality was then applied. A p-value of less than 0.05 was considered to be statistically significant in this study. For every water sample in the storage tanks, whether it conformed (yes) or did not conform (no) to standards (Uganda Standards, 2014) and guidelines (WHO, 2017) for drinking water was established.
Mapping established water contamination levels in Central Division
The geographical coordinates of the sampling points for each water storage tank were recorded using a handheld global positioning system (GPS), Garmin eTrex10 model. Each set with a unique code from the GPS was then used for geo-referencing and to map water contamination levels in the wards.
ArcGIS software version 10.2.1 was used in geostatistical analysis when developing maps using the Kriging method (ESRI, 2014).
Data collection instruments
A data collection sheet (DCS) was used to gather information such as: sample point code, division, ward, GPS coordinates, and weather conditions, time of sampling, and physical, chemical and bacteriological parameters of the water sample.
A sanitary inspection form (SIF) was used to gather information about cleaning frequency, tank age, tank material, and location of the domestic water storage tanks. The SIF also captured the tank conditions of the storage tanks such as: the presence of sediments, biological growth, floatable debris and insects in the tank, rodent or bird activity on and around the tank. For each domestic water storage tank, a set of guiding questions was used to establish tank conditions based on a 'yes' or 'no' response.
Quality/error control
A preliminary test of data collection tools on tank conditions was done on a small number of respondents (6 samples from each ward) for establishing accuracy of questions and responses, clarity and ease of comprehension, redundancies, omissions, and feasibility of implementation. The results of the preliminary test helped the researcher to refine the data collection instruments to establish their validity and reliability in gathering the required information.
Data analysis
All data analyses were done in STATA software version 13.0 (StataCorp, 2013), and ArcGIS software version 10.2.1 was used for geostatistical analysis (ESRI, 2014).
Data were analysed using the Statistics and Data (STATA) analysis package to determine frequencies, percentages, and the relationships between variables. The gathered data were coded into themes before analysis and discussion of the content. Linear models were applied to find factors associated with water quality.
Data collected were tabulated in a spreadsheet including the GPS coordinates of all the sample locations. The data for the different months was averaged to obtain representative values for the 'wet season' (March, April and May), 'dry season' (June, July and August) and 'all seasons' (all sample months), respectively. The data were then converted into shapefiles using ArcCatalog 10.2.1 by creating feature classes from the XY table for the wet, dry and all seasons. The shapefiles were mapped in ArcMap 10.2.1 and then the symbology command was used to show the different ranges for all the sample parameters in colours indicating conformity and non-conformity.
Data for electrical conductivity, temperature and total chlorine were not included for analysis as they all met the WHO Guidelines (2017) and Uganda Standards (2014) for drinking water.
RESULTS AND DISCUSSION
In this study, a total of 372 (n = 372) samples were selected, with 62 samples from each of the six Wards of commercial and planned residential settlements (Kololo, Nakasero, Old Kampala, Kamwokya) and those with unplanned, industrial settlement patterns (Kisenyi, industrial area). Samples were then considered for physical, chemical and bacteriological drinking water quality determination. The results for physical, chemical and bacteriological water quality parameters were then compared to the Uganda Standards (2014) and WHO Guidelines (WHO, 2017) for drinking water.
Tank conditions for each of the 372 domestic water storage tanks were used for risk score ranking.
Water quality evaluation
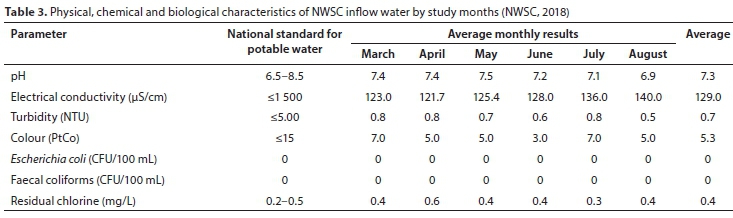
The monthly water quality findings for Inflow water from the NWSC pipeline during the study period (Table 3) revealed water quality that conformed to Uganda Standards and WHO Guidelines for drinking water.
Water quality by month
The study (Table 4) established that water pH in storage tanks was stable during the study period. However, the month of June registered a 3% non-conformance to the WHO and Uganda drinking water guidelines and standards because it was the beginning of the dry season, which caused changes in chemical composition (Mathur et al., 2007; Shinde et al., 2011; Verma et al., 2011). pH regulates several biological processes and bio-chemical reactions.
Furthermore, there was a gradual decrease in the number of samples conforming to the WHO and Uganda drinking water guidelines and standards for turbidity from the month of March, with 79% (295), to August, with 61% (228). As August is a dry month, there was high organic matter content due to algal growth as a result of raised temperatures. The presence of algal growth causes cloudiness and low transparency (Shinde et al., 2011).
The months of July and August 2017 had the highest number of samples with a free chorine measurement (347 or 93%) and faecal coliforms (290 or 78%) that exceeded the limits for potable water. There was depreciation of chlorine residual levels in the storage tanks in the months of July and August, facilitating the survival of faecal coliforms and growth of algae (Akuffo et al. 2013; Duer, 2016; LeChevallier et al., 1996).
Water quality by season
The study findings show that change in season impacted whether water quality conformed to WHO Guidelines (WHO, 2017) and Uganda Standards (2014) for drinking water. The raised temperatures in the dry season, to a maximum of 26°C, favoured microbial growth. Studies by Akuffo et al. (2013) and Olajire and Imeokparia (2001) produced similar findings, where temperature affected the rate of chemical reactions in the water body and enhanced survival and growth of microorganisms. Further, change in season from dry to wet reduced aerial contaminations from dust and debris, which are the remains of anything broken down or destroyed, including but not limited to rubble, animal waste or bird droppings (case of open tanks) (Ahmed et al., 2016).
There was an increase (Table 5) in the number of samples falling outside the normal range (<5 NTU) for turbidity as season shifted from wet to dry. In dry months there was an average of 6.8 NTU as compared to an average of 4.1 NTU in wet months. Similarly, Ojok et al. (2017) reported that turbidity changed with a change in season and had a significant influence on water quality. Additionally, a study by Evans et al. (2006) revealed that depositions by birds, decay of accumulated organic debris, atmospheric deposition of airborne micro-organisms and chemical pollutants can affect water quality in storage tanks. This is more so when the tanks are directly exposed to the environment due to not being covered with a lid. Evans et al. (2006) further elaborated that contamination in a tank depends on the amount of contaminants entering it and is affected by wind velocities.
Free chlorine levels were 0.1 mg/L on average, falling below the Uganda Standards and WHO Guidelines for drinking water in both wet and dry seasons. However, there was minimal divergence in microbial contamination (faecal coliforms) between the dry and wet season, with averages of 3.5 CFU/100 mL and 3.0 CFU/ 100 mL, respectively. This was further revealed in total chlorine levels that were on average 0.2 mg/L in both wet and dry seasons.
Additionally, change in season did not have a statistically significant effect on pH.
We further tested a multivariate null hypothesis using the WHO Guidelines (WHO, 2017) and Uganda Standards (2014) for pH (6.5-8.5), turbidity (<5 NTU), free and total chlorine (>0.2 and <0.5 mg/L), faecal coliforms and E. coli (0 CFU/100 mL):
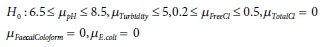
For the wet, dry and combined study period, the Hotelling-Lawley trace results were significant for all the analysis categories (p < 0.0001). This showed that the physical conditions of water storage tanks impacted the water quality in the tanks in relation to conforming to existing WHO Guidelines (WHO, 2017) and Uganda Standards (2014) for drinking water.
Association between tank conditions and water quality
Tank conditions
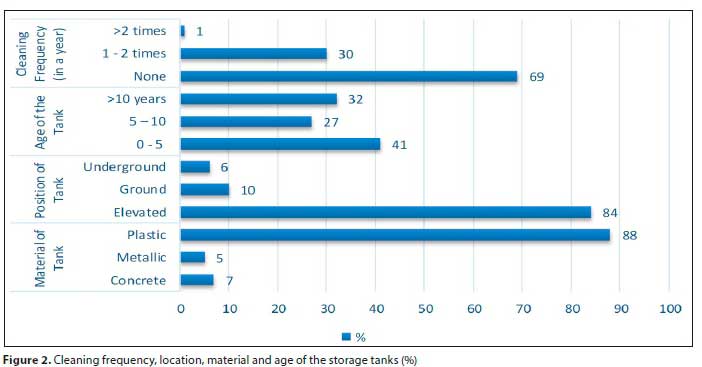
Study findings (Fig. 2) revealed that most tanks were made of plastic (88%), elevated (84%), under 5 years in age (41%) and had not been cleaned for at least a year (69%). A similar study by Aish (2013) showed that plastic tanks are frequently used for domestic water storage. Plastic water tanks are perceived to be durable, safe, cost-effective and readily available in a wide range of sizes. Most tanks are elevated because domestic water storage tanks are used to maintain the water pressure and act as a reservoir during interruptions in supply (EPA, 2002; Kirmeyer, 1999).
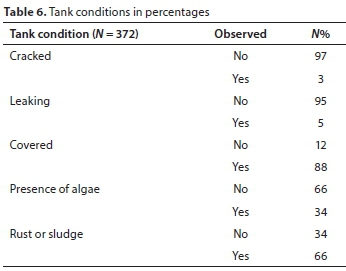
The study findings (Table 6) revealed that most of the tanks had rust/sludge (66%), 3% were cracked, 5% were leaking and 12% were not covered, while 34% had algal growth present. This was a clear indicator that most tanks had not been monitored and cleaned regularly. WHO (2013) had noted that poor handling and management of household water facilities contributes to the contamination of water.
Relation of physical conditions of tanks to water quality
As explained in the Methods section, the dependent variables were reduced in number using principal component analysis. The first principal component was then used and regressed with the tank conditions. First, dummy variables were created for the factor variables, and then linear regression used to assess the factors that affect water quality.
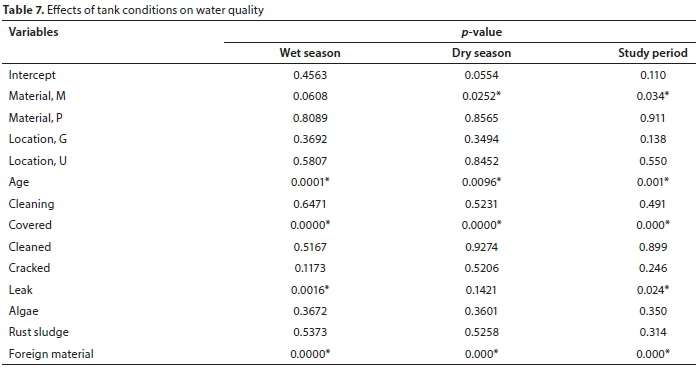
The study findings (Table 7) revealed that during the wet season, age of the tank, covering the tank, tank leaking and foreign material (p = 0.0001, p = 0.0000, p = 0.0016 and p = 0.0000, respectively) were statistically significantly related to the water quality in the storage tanks. Similarly, Schafer and Mihelcic (2012) found that water storage tank characteristics and conditions had an impact on water quality. They further stated that these characteristics and conditions are affected by the routine management of the tanks and not their positions.
Further, in the dry season, having metal as the tank material, unlike in the wet season, had a statistically significant (p = 0.0252) relationship with the water quality in the storage tanks. This was in addition to the age of the tanks, foreign material and covering the tank (p = 0.0096, p = 0.0000 and p = 0.0000, respectively).
During the study period (Table 7) - both wet and dry season - tank material being metal, tank age, covering the tank, leaking tank and foreign materials in the tank significantly affect the water quality at the 5% level of significance (p = 0.0342, p = 0.0007, p = 0.0000, p = 0.0240 and p = 0.0000, respectively). Material being metal, age of the tank and foreign material worsen the water quality while covering the tank improves the water quality. Other studies have shown that foreign material or accumulated sludge affects physical, chemical and bacteriological characteristics of water with an increase in turbidity levels, rapid depreciation of residual chlorine and a favourable environment for algae (Moyo et al., 2004; Schafer and Mihelcic, 2012). A similar study by Johnson et al. (2016) in Lalo Commune, Benin, revealed that bird droppings in water were a major contamination factor for potable water in storage tanks.
Determination of water contamination levels in Central Division
Wards with unplanned and industrial settlements (Kisenyi and Industrial Area) had the highest water contamination levels with a high risk of contaminated water in both wet and dry seasons.
When the sanitary conditions scores were collated with the E. coli contamination risk scores, wards with unplanned and industrial settlement patterns were found to be the 'most risk-prone wards' with a medium risk score level for E. coli risk and sanitary conditions in both dry and wet seasons. This could be because little attention is given to the domestic water storage tanks since most of the activities done in these wards are commercial, characterised primarily by industrial buildings and stores. Also, the unplanned settlements, characterised by overcrowding, especially for low-income earners (Howard et al., 2003), lead to compromised proper domestic water storage management by property owners. Only industries or factories such as beverage manufacturing were maintaining their water tanks.
Wards with commercial and planned residential settlements (Kololo, Nakasero, Old Kampala and Kamwokya) had low risk score rankings for sanitary conditions and E. coli in both dry and wet seasons. This was because most of the buildings in these wards house activities that required them to regularly clean their tanks, such as hotels, guesthouses, banks and embassies, among others. This confirmed that the domestic water storage tank owners/users in these wards were aware of the need for maintenance of their tanks.
Suggested consumer (household) storage tank best management practices (BMPs)
In order to ensure drinking water quality that meets the drinking water standards/guidelines at the point of consumption, adequate and appropriate monitoring and maintenance of water storage facilities/tanks is required. It should be noted however that the existing legal frameworks in Uganda have left the responsibility of maintaining the domestic water storage tanks to the owners. This study suggests that a change is needed to this legal framework to allow for a mandatory collaborative approach between the consumer/household/owner and a utility or any other legally binding entity.
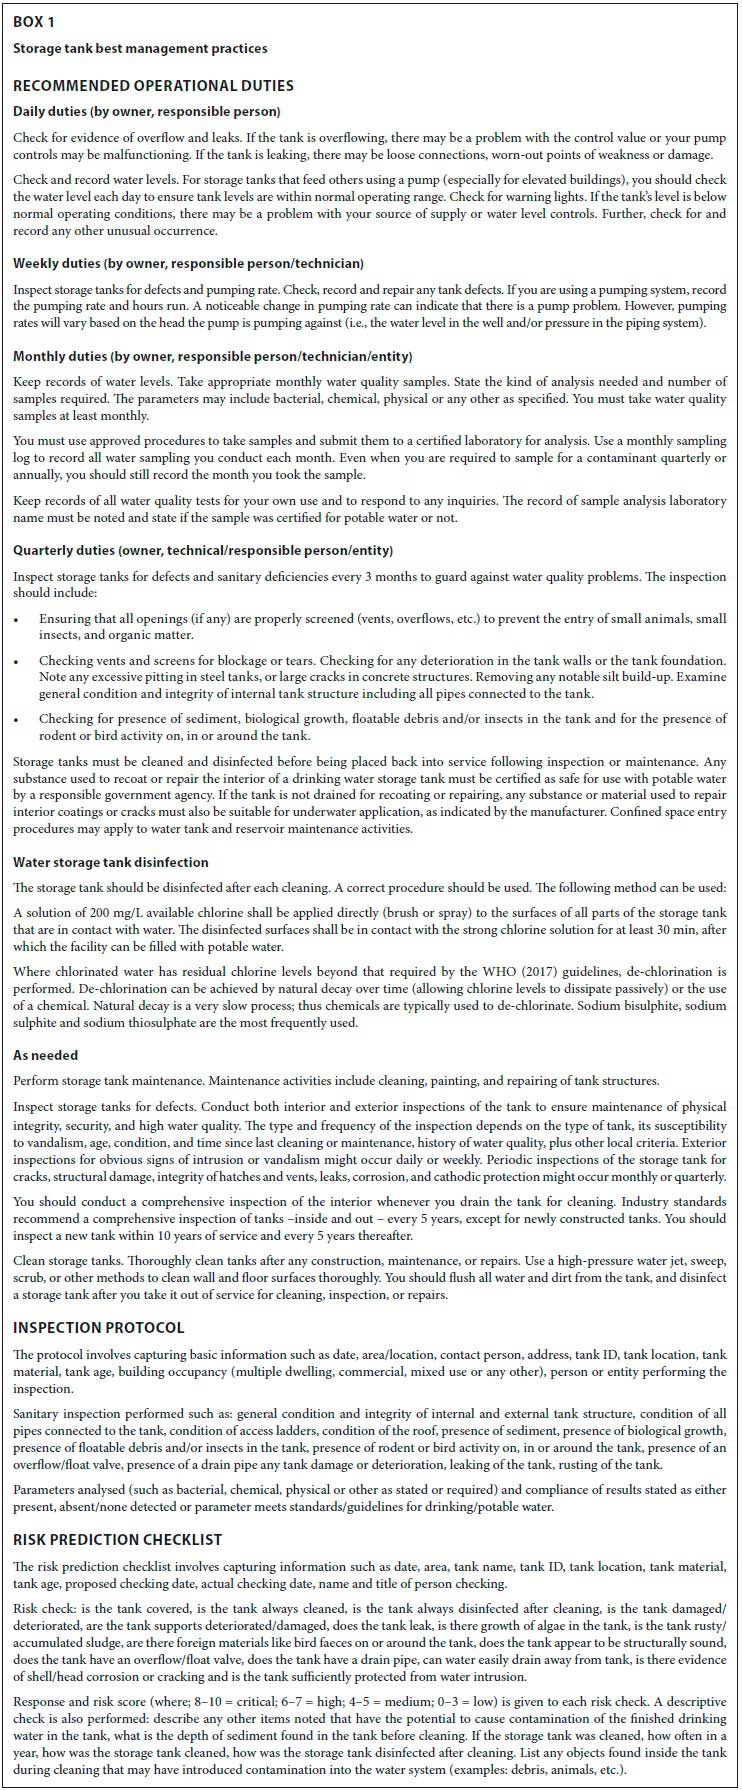
Box 1 provides a brief description of best management practices and monitoring tools, which were developed for NWSC as a result of the study, and customized for the purpose of proper customer storage tank management by the utility. The relevant forms are provided in the Supplementary Material published with this paper.
STUDY LIMITATIONS
It was not possible to view clearly inside every elevated storage tank, which may have resulted in under-reporting of poor sanitary conditions of storage tanks.
Another potential source of error was due to agitation of water in the storage tanks during sampling by a deep sampler. Agitation of settled particles and microbes has been shown to produce significantly higher microbial counts (Roberts et al., 2001).
CONCLUSIONS
Electrical conductivity and pH in storage tanks were stable during the study period, meeting the Uganda Standards and WHO Guidelines for drinking water (<1 500 |S/cm and 6.5-8.5, respectively).
There was a rise in turbidity levels as the season shifted from wet to dry. Free chlorine levels fell below the Uganda Standards and WHO Guidelines for drinking water in both wet and dry seasons.
The study showed that most of the tanks were plastic (88%), elevated (84%), and under 5 years in age (41%). The domestic water storage tanks were not always cleaned (69%). Only 3% (12) of the tanks were cracked, 5% were leaking, and 12% were not covered; 34% had algal growth and 66% had rust or sludge.
Additionally, the study showed that there was a statistically significant effect of tank conditions on the stored water quality in domestic water storage tanks. In both wet and dry seasons, tank material being metallic, tank age, covering the tank, leaking tank and foreign materials in the tank significantly affect the water quality at 5% level of significance (p = 0.0342, p = 0.0007, p = 0.0000, p = 0.0240 and p = 0.0000, respectively). The study further established that wards with unplanned and industrial settlements had the highest number of tanks with contaminated water levels. They were the wards with the highest risk scores for both sanitary conditions and E. coli contamination with a 'medium' risk score rank. Only a planned and upmarket residential ward (Kololo) had a 'low' risk score.
The study, therefore, established that tank conditions of domestic water storage tanks for customers of a water utility had an effect on the water quality, causing it not to meet the required Uganda Standards and WHO Guidelines for drinking water in some cases. Hence, regular management of the water storage tanks in the most affected wards and routine water quality checks should be done. A collaborative domestic water storage tank management arrangement is thus suggested between the household and the water utility.
ETHICAL CONSIDERATIONS
Permission was obtained from the water utility and water tank owners during data or sample collection. Respondents gave informed consent to use their responses. Respondent data was anonymised and their anonymity was observed according to Cohen et al. (2011) and Harris and Purdy (1998).
ACKNOWLEDGEMENTS
This study was partially sponsored by Uganda National Water and Sewerage Corporation. Special thanks go to the laboratory, data collection and analysis team (S Gubamwoyo, D Akejo, A Majja, N Kasunumba, F Sendawula).
AUTHOR CONTRIBUTIONS
EWM is the first and corresponding author. EWM and EW conceived and designed the study. EWM and LB analysed the data and interpreted the results. EWM, EW and LB drafted the initial and final manuscript. EWM, LB and EW performed critical revision of the manuscript. All authors approved the final revision of the manuscript.
CONFLICT OF INTEREST
The authors declare no conflict of interest regarding the publication of this paper.
REFERENCES
AHMED W, HAMILTON KA, GYAWALI P, TOZE S and HAAS CN (2016) Evidence of avian and possum faecal contamination in rainwater tanks as determined by microbial sources tracking approaches. Appl.Environ. Microbiol. 82 (14) 4379-4386. https://doi.org/10.1128/AEM.00892-16 [ Links ]
AISH AM (2013) Drinking water quality assessment of the Middle Governorate in the Gaza Strip, Palestine. Water Resour. Ind. 4 1320. https://doi.org/10.1016/j.wri.2013.09.004 [ Links ]
AKUFFO I, COBBINA SJ, ALHASSAN EH and NKOOM M (2013) Assessment of the quality of water before and after storage in the Nyankpala community of the Tolon-Kumbungu District, Ghana. Int. J. Sci. Technol. Res. 2 (2) 2277-8616. [ Links ]
ANAND N (2011) Pressure: The politechnics of water supply in Mumbai. Cult. Anthropol. 26 (4) 542-564. https://doi.org/10.1111/j.1548-1360.2011.01111.x [ Links ]
ARNOLD CD and ELLIOT WJ (1996) CLIGEN weather generator predictions of seasonal wet and dry spells in Uganda. Trans. ASAE 39 (3) 969-972. https://doi.org/10.13031/2013.27583 [ Links ]
AWWA (2000) National Water-Quality Assessment Programme. U.S. Department of the Interior: Geological Survey Ground Water and Drinking Water. American Water Works Association, Denver, Colorado. http://water.usgs.gov/nawqa/informing/sourcewater.html (Accessed 20 February 2017). [ Links ]
CAFFREY P, FINAN T, TRZASKA S, MILLER D, LAKER-OJOK R and HOUSTON S (2013) Uganda climate change vulnerability assessment report. USAID African and Latin American Resilience to Climate Change (ARCC) August. USAID, Washington, DC. [ Links ]
CHALCHISA D, MEGERSA M, and BEYENE A (2017) Assessment of the quality of drinking water in storage tanks and its implication on the safety of urban water supply in developing countries. Environ. Syst. Res. 6 (1) 1. https://doi.org/10.1186/s40068-017-0089-2 [ Links ]
CHOWNS E (2015) Is community management an efficient and effective model of public service delivery? Lessons from the rural water supply sector in Malwa. Public Admin. Dev. 34 (4) 263-276. https://doi.org/10.1002/pad.1737 [ Links ]
COHEN L, MANION L and MORRISON K (2011) Surveys, longitudinal, cross-sectional and trend studies. In. Research Methods in Education (7th edn). Routledge, Abingdon. 261-264. [ Links ]
DPHE (2005) Water quality monitoring and surveillance protocol for rural water supply. Department for Public Health Engineering, Dhaka. [ Links ]
DUER MJ (2016) Water storage tanks: the science of mixing and improving water quality. URL: http://www.processoline.com.au/content/process-control-systems/article/water-storage-tank-the-science-of-mixing-and-improving-water-quality-850228344 (Accessed 3 June 2018). [ Links ]
DWAF (Department of Water Affairs and Forestry, South Africa) (1996) South African Water Quality Guidelines (2nd edn). Department of Water Affairs and Forestry, Pretoria. [ Links ]
ESRI (Environmental Systems Research Institute) (2014). ArcGIS software package version 10.2.1. ESRI, Redlands, CA. [ Links ]
EPA (United States Environmental Protection Agency) (2002) Finished water storage facilities. United States Environmental Protection Agency, Washington DC. [ Links ]
EVANS CA, COOMBES PJ and DUNSTAN RH (2006) Wind, rain and bacteria: the effect of weather on the microbial composition of roof-harvested rainwater. Water Res. 40 (1) 37-44. https://doi.org/10.1016/j.watres.2005.10.034 [ Links ]
GRABOW WOK (1996) Waterborne diseases: update on water quality assessment and control. Water SA. 22 (2) 193-202. [ Links ]
HARRIS CR and PURDY RL (1998) The role of participative management in the implementation of total quality management programs. Int. J. Technol. Manage. 16 (4-6) 466-478. https://doi.org/10.1504/IJTM.1998.002674 [ Links ]
JURZIK L, HAMZA IA, PUCHERT W, ÜBERLA K and WILHELM M (2010) Chemical and microbiological parameters as possible indicators for human enteric viruses in surface water. Int. J. Hyg. Environ. Health. 213 (3) 210-216. https://doi.org/10.1016/j.ijheh.2010.05.005 [ Links ]
KCCA (Kampala City Council Authority) (2014) GIS Maps: Kampala City Council Authority. October 2014. URL: https://www.kcca.go.ug/ (Accessed 15 August 2020). [ Links ]
KIRMEYER GJ, KIRBY L, MURPHY BM, NORAN PF, MARTEL KD, LUND TW, ANDERSON JL and MEDHURST R (1999) Maintaining water quality in finished water storage facilities. AWWARF, Denver, CO. [ Links ]
KOTHARI CR (2004) Research Methodology: Methods and Techniques (2nd revised edition). New Age International (P) Ltd Publishers, New Delhi. [ Links ]
KREJCIE RV and MORGAN DW (1970) Determining sample size for research activities. Educ. Psychol. Meas. 30 607-610. https://doi.org/10.1177/001316447003000308 [ Links ]
KULABAKO RN, NALUBEGA M, WOZEI E and THUNVIK R (2010) Environmental health practices, constraints and possible interventions in peri-urban settlements in developing countries -a review of Kampala, Uganda. Int. J. Environ. Health Res. 20 (40) 231-257. https://doi.org/10.1080/09603120903545745 [ Links ]
LECHEVALLIER MW, WELCH NJ and SMITH DB (1996) Full-scale studies of factors related to coliform regrowth in drinking water. Appl. Environ. Microbiol. 62 (7) 2201-2211. https://doi.org/10.1128/AEM.62.7.2201-2211.1996 [ Links ]
LEVY K, NELSON KL, HUBBARD A and EISENBERG JN (2008) Following the water: a controlled study of drinking water storage in northern coastal Ecuador. Environ. Health Perspect. 116 (11) 1533. https://doi.org/10.1289/ehp.11296 [ Links ]
MALANDA N and LOUZOLO-KIMBEMBE P (2014) Survey on Storage of Water for Domestic Use in Underground Reinforced Concrete Tanks: The Case of Brazzaville (Republic of Congo). Open J. Civ.Eng. 4 (01) 13. https://doi.org/10.4236/ojce.2014.41002 [ Links ]
MATHUR P, AGARWAL S and NAG M (2007) Assessment of physico-chemical characteristics and suggested restoration measures for Pushkar Lake, Ajmer Rajasthan (India). In: Proceedings of Taa2017: The 12th World Lake Conference. 1518 1529. [ Links ]
MCHG (Minimum Cost Housing Group) (2004) Kampala City Information. Minimum Cost Housing Group. McGill University, Montreal. [ Links ]
MCLARNAN SM (2017) Escherichia coli as a water quality indicator organism: a case for responsive, science-based policy. All College Thesis Program, 2016-present. 38. URL: https://digitalcommons.csbsju.edu/honors_thesis/38 (Accessed 14 March 2018) [ Links ]
MOHAMMED AB and ABDULRAHMAN AS (2017) Water supply and distribution problems in developing countries: a case study of Jimeta-Yola, Nigeria. Int. J. Sci. Eng. Appl. Sci. 1 (4). [ Links ]
MOYO S, WRIGHT J, NDAMBA J and GUNDRY S (2004) Realising the maximum health benefits from water quality improvements in the home: a case from Zaka district, Zimbabwe. Phys. Chem. Earth. 29 1295-1299. https://doi.org/10.1016/j.pce.2004.09.012 [ Links ]
MURPHY JL, KAHLER AM, NANSUBUGA I, NANYUNJA EM, KAPLAN B, JOTHIKUMAR N and HILL VR (2017) Environmental survey of drinking water sources in Kampala, Uganda, during a typhoid fever outbreak. Appl. Environ. Microbiol. 83 (23) e01706-17. https://doi.org/10.1128/AEM.01706-17 [ Links ]
NWSC (National Water and Sewerage Corporation, Uganda) (2014) Customer Service Charter. National Water and Sewerage Corporation, Kampala. [ Links ]
NWSC (National Water and Sewerage Corporation, Uganda) (2015a) Water quality reports. National Water and Sewerage Corporation, Kampala. [ Links ]
NWSC (National Water and Sewerage Corporation, Uganda) (2015b) Standard Operating Procedures (2nd edn). Rev 3. National Water and Sewerage Corporation, Kampala. [ Links ]
NWSC (National Water and Sewerage Corporation, Uganda) (2015c) Annual Report 2014-2015. National Water and Sewerage Corporation, Kampala. [ Links ]
NWSC (National Water and Sewerage Corporation, Uganda) (2016) Monthly Report: Commercial Department; September 2016. National Water and Sewerage Corporation, Kampala. [ Links ]
OJOK W, WASSWA J and NTAMBI E (2017) Assessment of seasonal variation in water quality in river rwizi using multivariate statistical techniques, Mbarara Municipality, Uganda. J. Water Resour. Protect. 9 (01) 83. https://doi.org/10.4236/jwarp.2017.91007 [ Links ]
OSHIRO R (2002) Method 1604: Total Coliforms and Escherichia coli in water by membrane filtration using a simultaneous detection technique (MI Medium). United States Environmental Protection Agency, Washington, DC. [ Links ]
POTGIETER N (2008) Water storage in rural households: intervention strategies prevent waterborne diseases. Doctoral dissertation, Faculty of Health Sciences, University of Pretoria. [ Links ]
RICE EW, BAIRD RB, EATON A.D (2017) Standard Methods for the Examination of Water and Wastewater. (23rd edn.). American Public Health Association, Washington, DC. [ Links ]
SCHAFER CA and MIHELCIC JR (2012) Effect of storage tank material and maintenance on household water quality. J. Am. Water Works Assoc. 104 (9). https://doi.org/10.5942/jawwa.2012.104.0125 [ Links ]
SHINDE SE, PATHAN TS, RAUT KS and SONAWANE DL (2011) Studies on Physico-Chemical parameters and correlation coefficient of Harsool-Savangi dam, District Aurangabad, India. Middle East J. Sci. Res. 8 544-554. [ Links ]
STEEL EW and MCGHEE TJ (1991) Water Supply and Sewerage. McGraw-Hill Company, New York. [ Links ]
UNMA (Uganda National Meteorological Authority) (2016) Climate Forecast: Uganda National Meteorological Authority. URL: https://www.unma.go.ug/ (Accessed 15 November 2016). [ Links ]
UGANDA STANDARDS (2014) Potable Water Specification (1st edn.) Uganda National Bureau of Standards, Kampala. [ Links ]
VERMA PU, CHADAWAT DK and SOLANKI HA (2011) Seasonal variation in physico-chemical and phytoplankton analysis of Kankaria Lake. Life Science Leaflets. 19 842-854. [ Links ]
WHO (1996) Guidelines for Drinking-water Quality (2nd edn.) Vol 2. Health criteria and other supporting information. World Health Organization, Geneva. [ Links ]
WHO (2004c) Water, sanitation and hygiene links to health: Facts and figures. World Health Organization, Geneva. URL:http://www.who.int/water_sanitation_health/publications/facts2004/en/index.html (Accessed 13 March 2017). [ Links ]
WHO (2011) Guidelines for Drinking-water Quality (4th edn.) World Health Organization, Geneva. [ Links ]
WHO (2014) Water-related diseases. URL: http://www.who.int/water_sanitation_health/diseases/en/ (Accessed 28 May 2017). [ Links ]
WHO (2015) Emergencies preparedness, response. Disease outbreak news: Typhoidfever - Uganda, 17th March 2015. URL: www.who.int/csr/don/17-march-2015-uganda/en/ (Accessed 12 April 2017). [ Links ]
WHO (2017) Guidelines for Drinking-Water Quality (4th edn.) World Health Organization, Geneva. [ Links ]
WILLMS WD, KENZIE OR, MCALLISTER TA, COLWELL D, VEIRA D, WILMSHURST JF and OLSON ME (2002) Effects of water quality on cattle performance. J. Range Manage. 452-460. https://doi.org/10.2307/4003222 [ Links ]
WILSON J (2010) Essentials of Business Research: A Guide to doing your Research Project. Sage Publication, Washington DC. [ Links ]
WORLD BANK (2016) Climate change knowledge portal for development practitioners and policy makers. URL: http://sdwebx.worldbank.org/climateportal/index.cfm?page=country (Accessed 24 November 2016). [ Links ]
 Correspondence:
EW Makoko
Email: enoch.makoko@nwsc.co.ug
Received: 19 July 2019
Accepted: 7 December 2020

