


Services on Demand
Article
 English (pdf)
 Article in xml format
 Article references
Indicators

Related links
-
 Cited by Google
 -
 Similars in Google
Share

 Permalink
Water SA
On-line version ISSN 1816-7950
Print version ISSN 0378-4738
Water SA vol.47 n.1 Pretoria Jan. 2021
http://dx.doi.org/10.17159/wsa/2021.v47.i1.9451
RESEARCH PAPER
Effect of reactor characteristics on the seasonal effectiveness of solar disinfection: a factorial study
Ekene Jude Nwankwo; Jonah Chukwuemeka Agunwamba
Department of Civil Engineering, University of Nigeria, Nsukka, Nigeria
ABSTRACT
Solar disinfection (SODIS) involves exposing water stored in transparent polyethylene terephthalate (PET) containers to the sun for about 6 h of strong sunlight, after which the water is rendered safe for consumption. This study investigated the seasonal effect of reactor characteristics on the inactivation kinetics/constant of faecal coliforms by conducting a 23 factorial experiment, involving two levels of PET bottle size, PET bottle thickness, and PET bottle rear surface, uniquely combined to form 8 SODIS reactors/experimental units. The faecal coliform population of hourly samples taken from the 8 SODIS reactors showed that the inactivation kinetics/constant depends on the irradiation energy and maximum water temperature as dictated by the reactor characteristics. The average rate constant of the reflective reactors (1.37 ± 0.43 h-1) was significantly better (p < 0.001) than the absorptive reactors (1.17 ± 0.59 h-1) between June and October. The average rate constant of the small PET bottles (1.73 ± 0.65 h-1) is significantly higher (p < 0.002) than the large PET bottles (1.46 ± 0.51 h-1) from December to May; while the average rate constant of the light PET bottles (1.58 ± 0.64 h-1) is significantly better (p < 0.001) than the thick PET bottles (1.41 ± 0.52 h-1) year-round. Analyses of results confirmed a two-way interaction effect between PET bottle size and PET bottle thickness and between PET bottle rear surface and PET bottle thickness for periods with average radiation intensity of 450-500 W-m-2. Although container size and thickness were the most significant factors, combining light PET bottles with absorptive rear-surface could extend the applicability of SODIS to regions that fall short of the recommended radiation intensity threshold of 500 W-m-2 for 5 h.
Keywords: solar disinfection, factorial experiment, kinetics, drinking water, faecal coliform, diarrhoea
INTRODUCTION
An estimated 78% of the 663 million people who still drink water from contaminated sources live in the rural communities of developing countries (WHO, 2017). This has resulted in a tremendous burden of diarrhoeal disease among these populations. This is especially more so in Nigeria, which accounts for about 35% of water-related diarrhoea deaths globally (WHO and UN-Water, 2014). The problem calls for the exploration of household-based, self-sustaining methods for purifying drinking water, including solar water disinfection (SODIS) (Mintz et al., 2001; WHO, 2007). SODIS procedure involves exposing water stored in transparent containers to strong sunlight for a period of about 6 h after which the water is rendered safe for consumption (Acra et al., 1980; Wegelin et al., 1994; Luzi et al., 2016). The pathogens are destroyed by the combined action of infrared heat and UV portions of the solar spectrum through denaturation of cell proteins by heat and the damaging effect of the UV-generated reactive oxygen species (ROS) on cell DNA (Sinha and Häder, 2002; Leuenberger et al., 2017). It is one of the effective and affordable methods recommended by the World Health Organisation (WHO) for point-of-use water treatment (WHO, 2007), especially for communities whose drinking water sources are unprotected or questionable. SODIS processes have no adverse effect on water taste, and SODIS water has been shown to taste better than boiled and chlorinated water (Heri and Mosler, 2008).
Over time, transparent polyethylene terephthalate (PET) plastic bottles have emerged as the container/reactor of choice due to their availability, high UV transmittance, chemical stability, and ability to withstand mechanical scratches over prolonged use. Other plastic bottles made of polyvinyl chloride (PVC) and polycarbonate (PC) are not recommended for SODIS because they have the potential to release bisphenol A, a carcinogenic compound not found in PET (Luzi et al., 2016). An identifying symbol and a simple test that could be used to differentiate PET bottles from other plastic bottles are described in the SODIS guidelines (Luzi et al., 2016). Glass bottles can also be used as a SODIS reactor, especially for those whose concern about the toxicity potential of plastic bottles is the major psychological barrier against the uptake of SODIS. Glass bottles are chemically inert and can be used to store water and beverages over a longer period under adverse conditions. Asiimwe et al. (2013) compared the effectiveness of glass and PET bottles at removing pathogens under tropical conditions and reported no significant difference. Although transparency and clearness are requisites for a plastic bottle to qualify as a SODIS container, PET bottles with light blue tint demonstrated satisfactory UV transmittance and can also be used for SODIS purposes (Luzi et al., 2016). Other potential gains that could accrue from the recycling and reuse of PET bottles for SODIS purposes include the reduction of microplastics in the aquatic environment (Jiang, 2018).
SODIS is recommended for regions where the 5-h average of radiation intensity is above 500 W-m-2 (Wegelin et al., 1994; Meierhofer and Wegelin, 2002). This radiation intensity threshold is associated with 3 log reduction unit of bacterial pathogens at a water temperature of 30°C and water turbidity of 30 NTU. SODIS is most effective at water temperature values above 50°C, at which the radiation threshold required for complete inactivation could be lowered by as much as two-thirds (Sommer et al., 1997). Such elevated water temperature values are easily achievable in the tropics by painting the underside of the SODIS bottles black or exposing them on an absorptive background. The amount of radiation received can be boosted by exposing SODIS bottles on a reflective support. Kehoe (2001) reported an average 85% increase in the pathogen die-off rate for SODIS bottles on reflective aluminium foil. The wall thickness of PET bottles is another factor that could affect the inactivation efficiency of SODIS through the effect it has on the UV transmission capacity (Mani et al., 2006). Studies on the effect of PET bottle size, PET bottle diameter, and the depth of light path it provides are inconclusive. Inactivation kinetics were found to be independent of PET bottle size in the range of 0.5-1.5 L under strong sunlight conditions (820 W-m-2) (Kehoe et al., 2001). The diameter of PET bottles for this volume range usually varies from 5 cm to 8 cm. Another study conducted at a much lower radiation intensity condition found a significant difference in the log reduction value of faecal coliform for depths of light path in the range of 5.5-10 cm (Dessie et al., 2014). These conflicting findings indicate that the effect of PET bottle size on SODIS effectiveness could vary depending on radiation intensity and season. The use of higher PET bottle sizes is not encouraged, especially if they offer a light path greater than 10 cm, which is the recommended maximum. A conclusive study would require the evaluation of SODIS effectiveness over a wide range of reactor characteristics and experimental conditions.
The question of which combination of PET bottle size, PET bottle thickness, and rear-surface enhancement gives the maximum inactivation efficiency under different weather conditions has not been satisfactorily answered. These factors control the inactivation rate kinetics by the influence they have on water temperature and the amount of UV reaching SODIS water. The standing recommendation is to use absorptive enhancement during strong and medium sunlight if there is a reasonable expectation of reaching the water temperature of 45°C and to use reflective enhancement during periods of moderate and weak sunlight. Furthermore, what constitutes strong, moderate, and weak sunlight with respect to how they affect bottle water temperature and treatment efficiency have been variously defined as different ranges of radiation intensity (Mani et al., 2006; Mustafa et al., 2013; Dessie et al., 2014). Whether specific combinations of container type, size, and rear-surface enhancement will have an interaction effect on treatment efficiency during specific conditions has not been investigated. Therefore, the objective of this study was to evaluate the seasonal effect of PET bottle size, PET bottle thickness, and rear-surface enhancement on treatment effectiveness and test for possible interaction effect among these factors under different conditions. A factorial experiment is usually employed when the effect of multiple factors and conditions is under investigation. It allows for the effects of each factor to be estimated at several levels of the other factors, testing for possible interactions between two or more factors and producing results that are valid over a range of experimental conditions (Montgomery, 2013). A factorial design can have excellent statistical power even if few experiments are conducted for each experimental unit (Collins et al., 2014).
METHODOLOGY
Study area
The study was conducted in Nsukka (6.84°N and 7.37°E), Enugu State, located in the southeastern part of Nigeria with an average altitude of 552 m amsl. Enugu (meaning 'hilltop') is a region named for its hilly geography with a substantial difference in its atmospheric characteristics compared with the surrounding areas due to the orographic effect.
Southern Nigeria is known for its cloud coverage and copious rainfall from July to September and an extended dry season between November and February. The climatic information of the study area is provided in Table 1. Figure 1 shows the map of the study area.


Factorial design and experimental setup
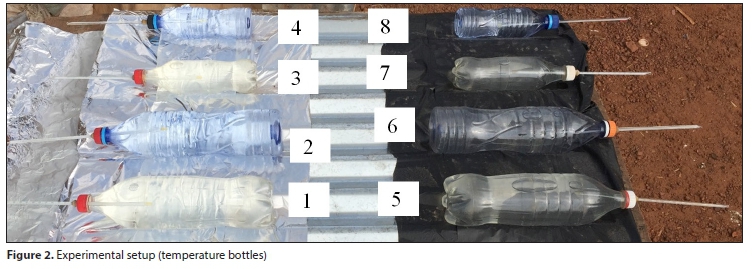
The study was formulated as a 23 factorial experiment, which resulted in 8 SODIS reactors/experimental units as shown in Figure 2. Each SODIS reactor represents a unique combination of PET bottle size, PET bottle thickness, and rear-surface enhancement, as defined in Table 2.
The eight unique SODIS reactors were induced in the design to account for all the possible combinations of PET bottle types and rear-surface enhancements used in the experiment.
Table 2 shows a detailed description of the characteristics and objectives of each SODIS reactor used in the experiment. While the light PET bottles were represented by the commercially available Aqua-Rapha mineral water bottle, the thick PET bottles were represented by the Coca-Cola beverage bottles. The two PET bottles were chosen because they have the most contrasting physical and thermal properties of all the PET bottles brands considered. Coca-Cola PET bottles are sturdier and more likely to withstand prolonged use and mechanical scratches when compared with the thin-walled and easily deformed Aqua-Rapha PET bottles. The two are common PET bottle brands in the region. Other selection criteria included clearness, size, and countrywide availability. The absorptive and reflective rear surfaces were achieved by placing the PET bottles on a corrugated iron sheet lined with a black polythene sheet and food-grade aluminium foil, respectively.
The PET bottles were initially cleaned by rinsing with tap water and then soaked overnight with about 100 mg-L-1 of sodium hypochlorite (Hypo) for sterilisation purposes.
They were then thoroughly rinsed with sterilised water and then with the test water before being filled with the test water for the SODIS experiment. The same water bottles, each one uniquely labelled, were used repeatedly for the experiments conducted each month, with the sterilisation procedure always conducted prior to the experiments.
Two separate sets of reactors were prepared for each experiment. One set was fitted with a standard mercury thermometer for temperature measurement, and the other was used for the bacterial count and the determination of pathogen die-off kinetics. The thermometers were snugly fitted into catheter hubs before being inserted into perforated corks so that leakage could be prevented without the need for glue. The temperature bottles remained exposed year-round for diurnal and hourly monitoring of water temperature. The thermometers were regularly calibrated by comparing with a reference digital thermometer, and the difference in the thermometer readings was ensured to be within ± 0.5°C of each other.
Preparation of test water and microbial examination
Before each experiment, a batch of potable water would be sterilized and then contaminated with 5-7% of raw, clarified sewage obtained from the University of Nigeria, Nsukka wastewater treatment facility. This was done to simulate worst-case contamination of source water by increasing to a more reasonable bacterial population of 105-106 CFU-mL-1. All the test water was confirmed to have no detectable chlorine residue and had a turbidity of less than 5 NTU. The PET bottles were filled one after the other after vigorous shaking of the batch water to ensure homogeneity and absorption of oxygen. The bottles were exposed to the sun after the initial sample had been drawn using a sterilised hypodermic syringe. Subsequent samples were drawn at hourly intervals or less, depending on the dose of sunlight received since the last sample was taken.
The samples were assayed for culturability of faecal coliform using the McConkey agar and drop plate method. They went through a four 10-fold dilution series using a pH-adjusted, sterilized ringer's solution. Twenty microliters from the four dilutions were aseptically inoculated into sectored plates containing gelled McConkey agar using a 100 ||L micropipette. Each plate was divided into 8 sectors such that the 4 dilutions could be plated in duplicate (Hoben and Somasegaran, 1982). Sterile techniques, including autoclaving of pipette tips and agar medium, were observed throughout the experiment to prevent contamination. Afterwards, the plates were incubated at 44.5 ± 0.5°C for 24 h and the colonies counted. Relevant meteorological data (radiation, air temperature, wind speed, and humidity) were collected from a weather station at the National Centre for Energy Research and Development (NCERD). NCERD is located within 300 m of the study location.
Data and analysis of the factorial experiment
A common and straightforward method of analysing the result of a factorial experiment is to fit a regression model to the results so that significant factors and factor interactions can be identified (Montgomery, 2013; Kugler et al., 2018). The regression equation of a 23 factorial design is given as follows:
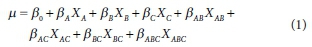
Where μ is the measured response (inactivation rate constant of faecal coliform); XA, XBand XC are the main effect variables; XAB, XAC and XBC are the two-way interaction effect variables; XABC is the three-way interaction effect variable; ßA, ßB, ßC, ßAB, BC and ßABCare the corresponding regression coefficients.
Data for computing the rate constants (μ) were collected from the 57 SODIS experiments carried out during the 12 months between November 2017 and October 2018. The remaining faecal coliform populations of samples from the eight SODIS reactors were determined at hourly intervals from 9:00 to 17:00 using the technique described above. A minimum of 3 experiments was performed monthly, and efforts were made to spread the experiments evenly throughout each month. Experiments were cancelled if the day dawned rainy and overcast. The inactivation rate constant (μ) was evaluated using the classic first-order kinetic. Equation 1 was written for each of the 8 SODIS reactors used in the experiment and for the 57 experiments conducted year-round, which resulted in 456 equations (the eight SODIS reactors multiplied by the 57 experiments). The equations for each month were subjected to analysis separately. Table 5 shows the number of experiments performed for each month. The varying number of experiments conducted per month was determined by power and sample size analyses carried out during the design phase of the experiment using Minitab 18 statistical software. The software requires input parameters such as the p-value (a = 0.05), and the mean and standard deviation of inactivation rate constants previously obtained from preliminary experiments. Thus, sample sizes sufficient for the detection of significant effects in each month were determined. Therefore, the varying number of experiments was a resource management strategy that was employed to enable efficient utilisation of the available resources to answer the research questions.
To solve Eq. 1, the variables are represented by numbers in a process termed 'coding'. Table 4 shows the coded level of the eight SODIS reactors using the 'effect coding' scheme as described in Kugler et al. (2018) with rate constant as the response variable. In an effect coding scheme, the two levels of the factors (A, B, and C) are either represented by -1 or 1, as defined in Table 3 and demonstrated in Table 4. Variables representing the product terms (AB, AC, BC, and ABC) are mere products of the elements in the vectors (A, B, and C) involved.

RESULTS AND DISCUSSION
Seasonal variation of radiation intensity, air temperature, and water temperature
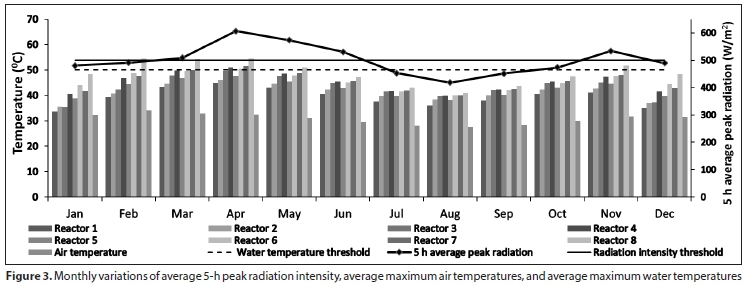
Figure 3 shows the pattern of seasonal variation of the 5-h average of peak radiation intensity, average maximum air temperature, and average maximum water temperatures of the eight SODIS reactors. The characteristics of each reactor are described in Table 1 and depicted in Figure 2. Comparing the solid trend line, which represents the monthly variation of the average 5-h peak radiation intensity, with the solid horizontal line drawn through the 500 W-m 2 radiation intensity threshold, shows that only the months of March (510 ± 23 W-m-2), April (607 ± 19 W-m-2), May (573 ± 18 W-m-2), June (531 ± 20 W-m-2) and November (534 ± 19 W-m-2) met the threshold on average. Again, comparing the height of the bars with the dotted horizontal line drawn through the 50°C threshold revealed that Reactor 8 (small/ light/absorptive) met the temperature threshold in February (54 ± 2°C), March (54 ± 3°C), April (54 ± 1°C), May (51 ± 3°C), and November (53 ± 3°C); Reactor 7 (small/thick/absorptive) met the temperature threshold in March (50 ± 2°C) and April (51 ± 1°C); Reactor 6 (big/light/absorptive) met the temperature threshold in March (50 ± 2°C) and April (50 ± 1°C); Reactor 4 (small/light/reflective) met the temperature threshold in March (50 ± 3°C) and April (50 ± 2°C); while Reactor 3 (small/thick/reflective) met the temperature threshold only in April (50 ± 2°C).
The interesting observation is that Reactor 8 attained a water temperature average greater than the 50°C threshold in February (492 ± 22 W-m-2), which did not meet the radiation threshold of 500 W-m-2. Such a scenario will have implications for where and when SODIS is recommended. At a water temperature above 50°C, radiation intensity plays a secondary role and about one-third of the threshold radiation energy is required for complete inactivation of bacterial pathogens (Luzi et al., 2016). Therefore, temperature enhancing materials, especially absorptive rear-surface, should be pursued in regions and seasons that fall short of the recommended radiation intensity threshold. This might be especially helpful in microclimates in the tropics with insufficient solar energy resources due to the orographic effect and extended cloud coverage. Such materials may always be required to raise the water temperature above the threshold of 50°C, thereby extending the applicability of SODIS to regions where SODIS will otherwise not be recommended. Therefore, the seasonal maximum water temperature should also be assessed, together with the seasonal radiation intensities, prior to the implementation of SODIS in any region.
This observation is contrary to the recommendation that rear-surface enhancement should no longer be promoted because it increases the complexity of the SODIS method without achieving a commensurate reduction in the required exposure time (Luzi et al., 2016). The study of Mani et al. (2006), which was cited in Luzi et al. (2016) to support this claim, was carried out in a region where the average radiation intensity generally exceeds 700 W-m-2 to a considerable degree and may not be representative of an unfavourable microclimate with insufficient sunlight but high ambient temperature, where the role of absorptive enhancement and water temperature could be crucial.
Seasonal variation of the inactivation rate constant of faecal coliforms
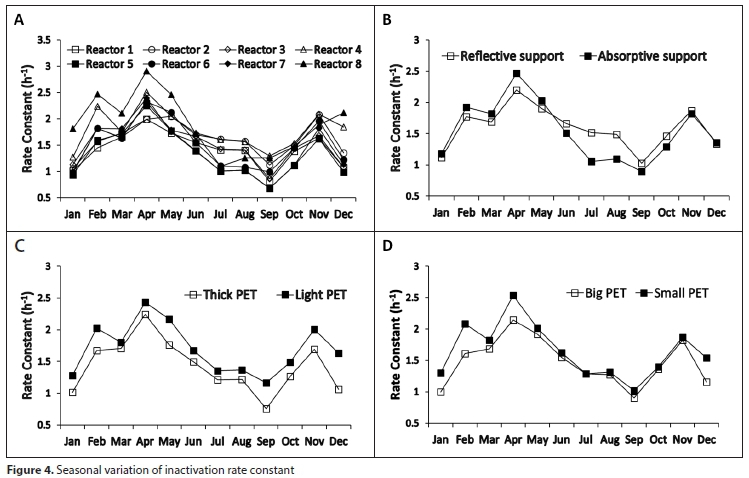
Figure 4a shows the seasonal variation of the rate constants for all the reactors, plotted on the same graph. Figures 4b-4d compared the seasonal variation of the aggregate inactivation rate constant obtained from the factor levels: absorptive versus reflective, small PET bottle versus large PET bottle, and light PET bottle versus thick PET bottle, respectively. As expected, the seasonal variation of the rate constant followed the same trend with the seasonal variations of the 5-h average radiation intensity, maximum water temperature, and air temperature shown in Figure 3. These values all peaked in April and November and reached their lowest points in August and September. Two-way analysis of variance (ANOVA) shows that different reactors (p < 0.001) and months (p < 0.001) are associated with different inactivation rate constants. However, there is no evidence of an interaction effect between the reactors and the months (p = 0.998).
The difference between the aggregate performance of the absorptive and the reflective reactors was only significant during the rainy period between June and October when the inactivation rate constant of the reflective reactors (1.37 ± 0.43 h-1) was found to be higher (p < 0.001) than that of the absorptive reactors (1.17 ± 0.59 h-1). The average radiation and water temperature conditions for this period were 465 ± 81 W-m-2; 42 ± 5°C for the reflective reactors, and 46 ± 5°C for the absorptive reactors. The general observation is that the performance of the reflective reactors tends to be close to or better than the absorptive reactors when the 5-h average of radiation intensity is close to or lower than 500 W-m-2. Another plausible explanation is that June to October is a period of lower ambient temperature and the water temperature threshold of 50°C was rarely reached even for the absorptive reactors. Therefore, the optical inactivation processes may have played the dominant role in the bacterial inactivation processes during this period, as a result of the increased amount of UV radiation absorbed by the bottles due to reflection and double penetration (Kehoe et al., 2001; Mani et al., 2006). The UV content of solar radiation is also known to peak between June and September for regions close to the equator (Acra et al., 1990). This result is consistent with the findings of Mani et al. (2006) and Mustafa et al. (2013), who recommended use of a reflective rear surface during overcast periods and an absorptive rear surface for periods of strong sunlight.
It can also be seen from Figure 4d that, aside from the period of June to November when the average rate constants of the large PET bottles and the small PET bottles were close, the rate constant of the small PET bottles (1.73 ± 0.65 h-1) was significantly higher (p < 0.002) than that of the large PET bottles (1.46 ± 0.51 h1) for the rest of the months, i.e., from December to May. The average radiation and water temperature conditions for the period of November to June are 477 ± 81 W-m-2, 41 ± 4°C for the large PET bottles, and 44 ± 4°C for the small PET bottles. The average radiation and water temperature conditions for the period of December to May are 525 ± 76 W-m-2, 43 ± 5°C for the large PET bottles, and 47 ± 5°C for the small PET bottles. Therefore, PET bottle size may not matter under the conditions of < 500 W-m-2 average radiation intensity and water temperature of < 45°C. Hence, bigger PET bottles should be pursued for larger volumes under such conditions. This result is a partial confirmation of the original hypothesis that the effect of container size on treatment efficiency may also depend on radiation intensity.
The inactivation rate constant of the light PET bottles (1.58 ± 0.64 h-1) is significantly higher (p < 0.001) than the inactivation rate constant of the thick PET bottles (1.41 ± 0.52 h-1) year-round, as can be seen from Figure 4c. The year-round average radiation was 501 ± 82 W-m-2, and the year-round average maximum water temperatures were 43 ± 5°C for the thick PET bottles and 45 ± 5°C for the light PET bottles. The higher rate constant observed for the light PET bottles may have been achieved through the lower heat capacity and better temperature performance observed for the light PET bottles and better transmission of UV light associated with lighter PET bottles (Mani et al., 2006). The effect of the UV transmission properties of PET bottles on SODIS processes is well documented (Mani et al., 2006; McGuigan et al., 1998).
Effect of radiation energy and water temperature on the inactivation kinetics of faecal coliform
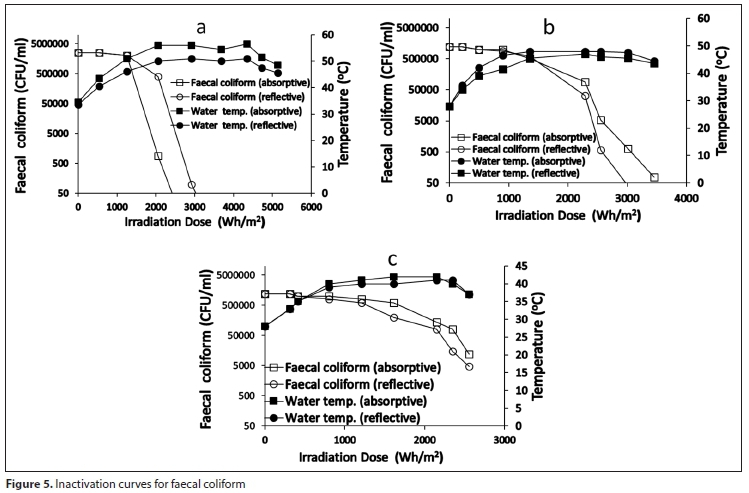
Figures 5a-5c show typical inactivation curves of faecal coliforms as influenced by irradiation energy, maximum water temperature, and rear-surface enhancement. In general, the irradiation dose required for complete inactivation depends on the maximum water temperature, and the maximum water temperature, in turn, predicted the shape of the inactivation curve. Under strong sunlight conditions (>500 W-m-2), the small, light PET bottles on the absorptive surface (Reactor 8) demonstrated the most rapid conversion of radiation to heat and reached 50°C after about 2 h of exposure. Upon reaching the 50°C temperature threshold, there was a sharp drop in the bacterial population, which invariably led to complete inactivation within 2 h of subsequent exposure irrespective of radiation intensity and initial faecal coliform concentration, as can be seen in Figure 5a. On occasions when the reflective reactors reached 50°C, they did so about 1 h after the absorptive reactors, during which the faecal coliform population of the absorptive reactors might have been reduced below the detection limit (see Figure 5a).
For maximum water temperatures of 45-50°C, the trend reversed and the reflective reactors demonstrated a significantly higher inactivation rate than the absorptive reactors, reaching 3 log reduction units or below detection limit within 3 h of subsequent exposure, from an initial faecal coliform population of 106-105 CFU-mL-1 (see Figure 5b). For this maximum temperature range, the coliform population in the absorptive reactors was reduced to below the detection limit after about 1 h of the reflective reactors. The reflective enhancement, on numerous occasions, was the difference between complete and incomplete inactivation in this water temperature range.
The maximum water temperature attained by the reactors could harbour some dosimetric information. All reactors that recorded a water temperature of >50°C achieved complete inactivation after 1 day of exposure, and no culturable cells were observed after 48 h of post-irradiation storage. Most of the reactors with a maximum water temperature of 45-50°C also achieved complete inactivation if they were exposed on the reflective support. No reactor with a maximum water temperature of < 45°C achieved complete inactivation in a single day of exposure, even though the reflective reactors showed slightly better performance (see Figure 5c). In general, the maximum water temperature, which usually occurred around 14:00, predicted the shape of the inactivation curve, depending on the rear-surface enhancement used, and could serve as a reliable indicator of treatment effectiveness. This is largely because, in the tropics, sunny days are always hot, and SODIS water temperature is highly correlated with radiation intensity. Conditions such as 'sunny and cool' do not co-exist.
Result of the factorial experiment
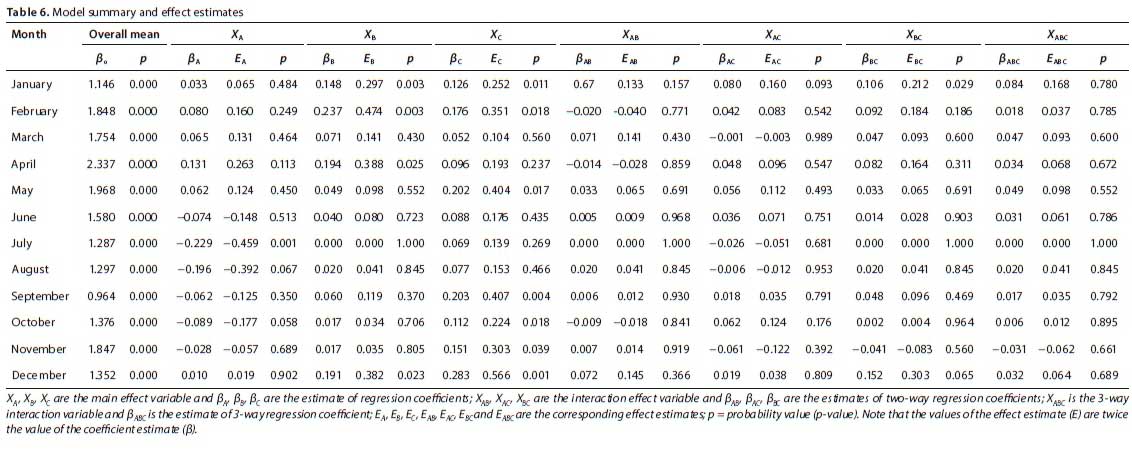
Table 6 displays the model summary and effect estimates obtained from the monthly regression analyses, together with their ^-values of significance. The values under the effect estimate vectors (E) are twice the estimates of regression coefficients (ß). The algebraic signs indicate the factor level that increases rate constant. For example, a positive main effect estimate means that 'high level (+1)' of that factor increases rate kinetics on average; whereas a negative effect estimate means that the 'low level (-1)' of that factor increases the rate kinetics on average. Factor levels associated with 'high level (+1)' and 'low level (-1)', were defined in Table 3.
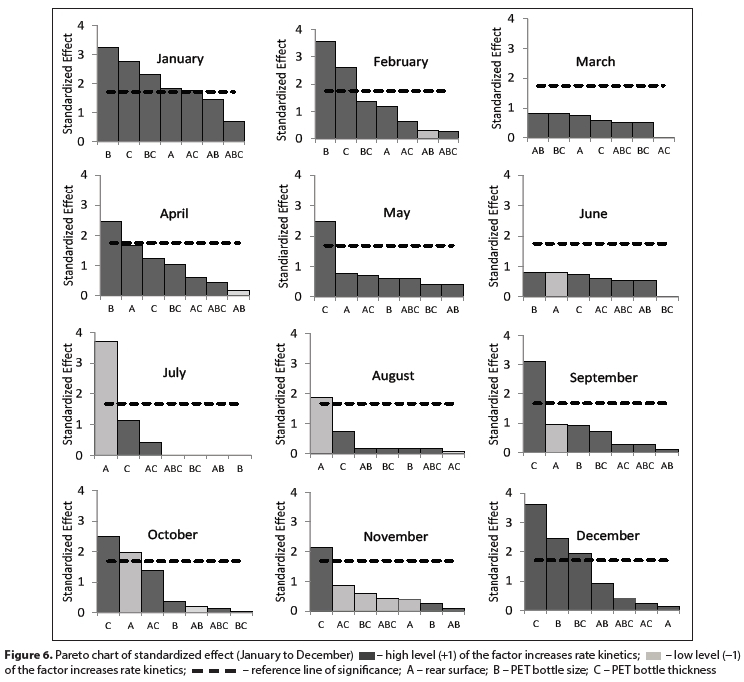
Figure 6 shows the Pareto charts of standardized effects from January to December. A Pareto chart uses bars to show the magnitude and the importance of the factors and factor combinations from left to right in descending order. The chart will inform the selection of the most suitable reactors during different periods of the year. The height of the bars is proportional to the absolute value of the estimated effect (E), divided by the standard deviation. The dotted horizontal line is the reference line of significance, and depends on the selected significance level (a). An effect estimate is significant if the bar that represents it is touching the reference line of significance. One limitation of the Pareto chart is that it displays only the absolute values of the effect but does not indicate which effect decreases or increases the response (rate constant). This study introduced two shades of grey in the chart to indicate which factor level increases the rate constant. The light-grey bars suggest that it is the 'low level (-1)' of that factor that increases the rate constant; whereas dark-grey bars suggest that it is the 'high level (+1)' of that factor that increases the rate constant. For the months in which no significant difference exists and the available evidence could not establish the superiority of any particular factor level, convenient and available reactors should be used. For example, large PET bottles should be pursued for larger volumes of water.
Figure 7 shows the interaction effect plots. It can be seen that the 2-way interaction effect between PET bottle size and PET bottle thickness and between rear surface and PET bottle thickness are significant. The interaction effect was plotted only for January (480 W-m-2) and December (489 W-m-2) because these are the only months that have significant interaction effect estimates. The plots illustrate how the relationship between one factor and the rate constant depends on the factor levels of the second factor.
The presence of an interaction effect indicates that the combined effect of the factors and factor levels involved is greater than the sum of their individual effects. An interaction effect exists when the lines connecting the means of the factor levels cross each other (see Figure 7). The lines in Figure 7i, for example, cross each other, indicating that the relationship between PET bottle size and rate constant also depends on the factor level of the rear surface used. If large PET bottles are used, the reflective rear surface is associated with a higher rate constant. However, if small PET bottles are used, the absorptive rear surface is associated with the higher rate constant.
The reduced radiation and high ambient temperature observed during December and January gave a comparative advantage to the reactors on the absorptive rear-surface, more than for any other period, and may be the reason for the interaction effect observed during this period. Another plausible explanation is that during that time of the year the sun reaches its lowest point and the UV content of the radiation reaching the region is minimal.
Therefore, the effect of temperature may have played the dominant role in removing the pathogens during this period.
Unlike chlorinated water, SODIS water has high acceptance among many communities of developing countries because the process does not impart taste to water (Heri and Mosler, 2008; Luzi et al., 2016). However, there are lingering concerns about the safety of water disinfected in plastic bottles in light of the disclaimers made by manufacturers in the bottling industry who instruct users not to reuse plastic bottles. The main concern, which is about the migration of genotoxins and other potentially harmful chemicals into SODIS water during exposure, has been addressed through numerous dark-controlled experiments (Mustafa et al., 2013; Schmid et al., 2008; Ubomba-Jaswa et al., 2010). The balance of scientific evidence suggests that the health risk for SODIS users is not different from the risk to people consuming water and beverages from regular PET bottles without solar exposure. The World Health Organisation approved the safety and recommended the use of SODIS in 2007 (WHO, 2007). More than 5 million people, spread across 55 countries, were using SODIS for their daily water treatment in 2016 (Luzi et al., 2016).
CONCLUSIONS
Year-round assessment of radiation intensity, air temperature, bottle water temperature, and the inactivation rate kinetics of faecal coliforms shows that PET bottle size, PET bottle thickness, and the rear-surface enhancement affect the effectiveness of SODIS treatment, depending on the prevailing weather conditions, through the effect they have on water temperature and the irradiation energy reaching the water. Regions that fall short of the radiation intensity requirement of an average of 500 W-m-2 should still be assessed for seasonal water temperature variations using smaller and lighter PET bottles placed on an absorptive rear-surface. SODIS might still be applicable in such regions for some periods of the year if the maximum water temperature of 50°C could still be attained. Under less favourable conditions, especially during the period of reduced ambient and water temperature, the combination of lighter PET bottles and reflective rear-surface enhancement is crucial for SODIS effectiveness if SODIS must be used. Bigger PET bottles should be pursued for higher treatable volumes during cloudy spells and periods of reduced sunlight intensity because smaller PET bottles are not more effective at removing pathogens under such conditions.
A factorial study is an efficient and effective way of determining reactor characteristics that are best suited for different seasons of the year. Testing for SODIS effectiveness across different levels of different factors could reveal factors and factor levels that interact to improve the treatment efficiency of SODIS. Monitoring of the maximum water temperature should be part of daily SODIS operation. This could be done by fitting standard mercury thermometers to identical bottles permanently designated for temperature measurement. The maximum water temperature of the bottles, which usually occurs around 14:00, could be used to predict the level of treatment. This could help prevent needless second or third-day exposure without the fear of underexposure, while facilitating better utilization of PET bottles, especially in regions where PET bottles are in short supply.
ACKNOWLEDGEMENTS
The advice and technical assistance of Engr. Emeka Aroh and Mrs VO Eze of the Sanitary Engineering Laboratory, University of Nigeria, Nsukka, was crucial for the successful completion of the experiment.
REFERENCES
ACRA A, JURDI M, MU'ALLEM H, KARAHAGOPIAN Y and RAFFOUL Z (1990) Water disinfection by solar radiation: assessment and application. IDRC, Ottawa, ON, CA. [ Links ]
ACRA A, KARAHAGOPIAN Y, RAFFOUL Z and DAJANI R (1980) Disinfection of oral rehydration solutions by sunlight. Lancet. 2 (8206) 1257-8. https://doi.org/10.1016/S0140-6736(80)92530-1. [ Links ]
ASIIMWE JK, QUILTY B, MUYANJA CK and MCGUIGAN KG (2013) Field comparison of solar water disinfection (SODIS) efficacy between glass and polyethylene terephalate (PET) plastic bottles under sub-Saharan weather conditions. J. Water Health. 11 (4) 729737. https://doi.org/10.2166/wh.2013.197 [ Links ]
COLLINS LM, DZIAK JJ, KUGLER KC and TRAIL JB (2014) Factorial experiments: Efficient tools for evaluation of intervention components. Am. J. Prev. Med. 47 (4) 498-504. https://doi.org/10.1016/j.amepre.2014.06.021 [ Links ]
DESSIE A, ALEMAYEHU E, MEKONEN S, LEGESSE W, KLOOS H and AMBELU A (2014) Solar disinfection: an approach for low-cost household water treatment technology in Southwestern Ethiopia. J. Environ. Health Sci. Eng. 12 (1) 25. https://doi.org/https://doi.org/10.1186/2052-336X-12-25 [ Links ]
HERI S and MOSLER HJ (2008) Factors affecting the diffusion of solar water disinfection: a field study in Bolivia. Health Educ. Behav. 35 (4) 541-560. https://doi.org/10.1177/1090198108321248 [ Links ]
HOBEN HJ and SOMASEGARAN P (1982) Comparison of the pour, spread, and drop plate methods for enumeration of Rhizobium spp. in inoculants made from presterilized peat. Appl. Environ. Microbiol. 44 (5) 1246-1247. [ Links ]
JIANG JQ (2018) Occurrence of microplastics and its pollution in the environment: A review. Sustain. Prod. Consum. 13 (1) 16-23. https://doi.org/10.1016/J.SPC.2017.11.003 [ Links ]
KEHOE SC, JOYCE TM, IBRAHIM P, GILLESPIE JB, SHAH AR RA and MCGUIGAN KG (2001) Effect of agitation, turbidity, aluminium foil reflectors and container volume on the inactivation efficiency of batch-process solar disinfectors. Water Res. 35 (4) 1061-1065. https://doi.org/10.1016/S0043-1354(00)00353-5 [ Links ]
KUGLER KC, DZIAK JJ and TRAIL J (2018) Coding and interpretation of effects in analysis of data from a factorial experiment. In: Optimization of Behavioral, Biobehavioral, and Biomedical Interventions. Springer, Cham. 175-205. https://doi.org/10.1007/978-3-319-91776-4 [ Links ]
LEUENBERGER P, GANSCHA S, KAHRAMAN A, CAPPELLETTI V, BOERSEMA PJ, VON MERING C, CLAASSEN M and PICOTTI P (2017) Cell-wide analysis of protein thermal unfolding reveals determinants of thermostability. Science. 355 (6327) eaai7825. https://doi.org/10.1126/science.aai7825 [ Links ]
LUZI S, TOBLER M, SUTER F and MEIERHOFER R (2016) SODIS Manual: Guidance on Solar Water Disinfection. SANDEC (Water & Sanitation in Developing Countries ), EAWAG, Dübendorf. [ Links ]
MANI SK, KANJUR R, SINGH B, ISAAC S and REED RH (2006) Comparative effectiveness of solar disinfection using small-scale batch reactors with reflective, absorptive and transmissive rear surfaces. Water Res. 40 (4) 721-727. https://doi.org/10.1016/j.watres.2005.11.039 [ Links ]
MCGUIGAN KG, JOYCE TM, CONROY RM, GILLESPIE JB and ELMORE-MEEGAN M (1998) Solar disinfection of drinking water contained in transparent plastic bottles: Characterizing the bacterial inactivation process. J. Appl. Microbiol. 84 (6) 1138-1148. https://doi.org/10.1046/j.1365-2672.1998.00455.x [ Links ]
MEIERHOFER R and WEGELIN M (2002) Solar Water Disinfection: A Guide for the Application of SODIS. SANDEC (Water & Sanitation in Developing Countries), EAWAG, Dübendorf. [ Links ]
MINTZ ED, BARTRAM J, LOCHERY P and WEGELIN M (2001) Not just a drop in the bucket: Expanding access to point-of-use water treatment systems. Am. J. Public Health. 91 (1) 1565-1570. https://doi.org/10.2105/AJPH.91.10.1565 [ Links ]
MONTGOMERY DC (2013) Design and Analysis of Experiment (8th edn.) John Wiley & Sons, Hoboken. 724 pp. [ Links ]
MUSTAFA A, SCHOLZ M, KHAN S and GHAFFAR A (2013) Application of solar disinfection for treatment of contaminated public water supply in a developing country: Field observations. J. Water Health. 11 (1) 135-145. https://doi.org/10.2166/wh.2012.119 [ Links ]
SCHMID P, KOHLER M, MEIERHOFER R, LUZI S and WEGELIN M (2008) Does the reuse of PET bottles during solar water disinfection pose a health risk due to the migration of plasticisers and other chemicals into the water? Water Res. 42 (20) 5054-60. https://doi.org/10.1016/j.watres.2008.09.025 [ Links ]
SINHA RP and HÄDER DP (2002) UV-induced DNA damage and repair: A review. Photochem. Photobiol. Sci. 1 (4) 225-236. https://doi.org/10.1039/b201230h [ Links ]
SOMMER B, MARINO A, SOLARTE Y, SALAS ML, DIEROLF C, VALIENTE C, MORA D, RECHSTEINER R, SETTER P, WIROJANAGUD W and co-authors (1997) SODIS - An emerging water treatment process. J. Water Supply Res. Technol. AQUA. 46 (3) 127-137. [ Links ]
UBOMBA-JASWA E, FERNÁNDEZ-IBÁÑEZ P and MCGUIGAN KG (2010) A preliminary Ames fluctuation assay assessment of the genotoxicity of drinking water that has been solar disinfected in polyethylene terephthalate (PET) bottles. J. Water Health. 8 (4) 712-719. https://doi.org/10.2166/wh.2010.136 [ Links ]
WEGELIN M, CANONICA S, MECHSNER K, FLEISCHMANN T, PESARO F and METZLER A (1994) Solar water disinfection: Scope of the process and analysis of radiation experiments. Aqua J. Water Supply Res. Technol. 43 (4) 154-169. [ Links ]
WHO (2017) Safely managed drinking water - thematic report on drinking water 2017. World Health Organization, Geneva. 108 pp. [ Links ]
WHO (2007) Combating waterborne disease at the household level. International Network to Promote Household Water Treatment and Safe Storage, World Health Organization. Geneva. 108 pp. [ Links ]
WHO and UN-WATER (2014) UN-water global analysis and assessment of sanitation and drinking-water (GLAAS) 2014 report: investing in water and sanitation: increasing access, reducing inequalities. World Health Organization. Geneva. 90 pp. [ Links ]
 Correspondence:
Ekene Jude Nwankwo
Email: ekene.nwankwo@unn.edu.ng
Received: 11 June 2020
Accepted: 7 December 2020

