


Servicios Personalizados
Articulo
 Inglés (pdf)
 Articulo en XML
 Referencias del artículo
Indicadores

Links relacionados
-
 Citado por Google
 -
 Similares en Google
Compartir

 Permalink
Water SA
versión On-line ISSN 1816-7950
versión impresa ISSN 0378-4738
Water SA vol.47 no.1 Pretoria ene. 2021
http://dx.doi.org/10.17159/wsa/2021.v47.i1.9449
RESEARCH PAPER
Relationships between agronomic and environmental phosphorus analyses of selected soils
MM Nthejane; CC du Preez; CW van Huyssteen
Department of Soil, Crop and Climate Sciences, University of the Free State, PO Box 339, Bloemfontein, 9300, South Africa
ABSTRACT
Phosphorus (P) is an essential nutrient in crop production and is therefore typically applied as phosphatic fertilisers. This can induce soil P concentrations that may contribute to freshwater eutrophication. Soil P tests developed from a water pollution protection perspective are unlike those developed for agronomic purposes and are also not easily adapted to routine analyses. The aim with this study was therefore to establish whether the values of P extracted from a range of soils by various agronomic and environmental P determination methods are related or not. Topsoil samples were collected from virgin soils in central South Africa and treated with KH2PO4 to induce different P concentrations and then incubated for 3 months, while subjected to various wetting and drying cycles. The samples were then analysed for P using the extractants of Bray 1, citric acid, ISFEI, Olsen, and Truog, commonly employed to establish the agronomic P status of soils. Environmental P status was determined with calcium chloride (CaCl2) and ammonium oxalate (DPSox) extractants. Generally good relationships were found between CaCl2 and ISFEI (R2= 0.72), between DPSox and Truog (R2 = 0.79), and between DPSox and citric acid (R2 = 0.82). Agronomic P soil tests therefore have the potential to be used in regulating application of phosphatic fertilisers to ensure optimum crop yields, while simultaneously limiting freshwater pollution. Further field studies are, however, recommended to determine threshold values from an environmental point of view.
Keywords: crop production, soil phosphorus tests, threshold values, water pollution
INTRODUCTION
Phosphorus (P) is a key element in crop production. This essential macro-nutrient is therefore an integral part of soil fertility programmes, and is applied to agricultural land as either inorganic or organic fertiliser to meet crop requirements (Havlin et al., 2014). However, the long-term use of phosphatic fertiliser in excessive amounts may increase soil P concentrations to levels beyond crop needs and hence increase the risk of non-point-source pollution (Sharpley and Tunney, 2000). Phosphorus is the principal nutrient associated with eutrophication of recipient water bodies (Haygarth et al., 2013).
Loss of P from agricultural land to surface water bodies has been a concern in South Africa (Harding et al., 2009), with freshwater pollution estimated to be 0.0047 mgP-L-1 water. An average P concentration in the natural water resources of the country (as orthophosphate) has been estimated at 0.07 mg-L-1, while an upper threshold value of 0.1 mg-L-1 is recommended in Australia, New Zealand, and the United States of America (USEPA, 1986; ANZECC, 2000). The report of De Villiers and Thiart (2007) on the nutrient status of the 20 largest river catchments in South Africa indicated that 60% of the rivers showed significant (p <0.05) upward trends in dissolved orthophosphate content. Harding et al. (2009) state that 35% of the South Africa's total freshwater resources are eutrophic, further indicating P enrichment.
Phosphorus is considered an undesirable element in water bodies because it results in ecological, economic and social problems. This is because P accelerates blue-green algae and various aquatic vegetative growth (Rossouw et al., 2008). The dissolved oxygen levels of water bodies under these eutrophic conditions thus diminish quickly as micro-organisms decompose organic matter. Oxygen depletion impairs the water body and restricts its use for drinking, fishing, industry, and recreation.
Against this backdrop, the South African Water Research Commission initiated investigations into non-point-source pollution of water by agriculture from field to catchment scale, focusing on nitrogen and phosphorus management through modelling (Rossouw and Görgens, 2005; Van der Laan et al., 2012; Van der Laan and Franke, 2019). However, Mardamootoo (2015) emphasised that a more holistic approach is preferable. Such an approach could include soil P testing for quantifying susceptibility of water pollution due to soil P runoff (Horta and Torrent, 2006), modelling of P movement from agricultural land to surface water (Sharpley, 2007), and P indices to establish water pollution risk with P from non-point agricultural sources (Weld and Sharpley, 2007).
The existing environmental soil P testing methods, e.g., calcium chloride (CaCl2) and ammonium oxalate (DPSox), are tedious and time-consuming, which therefore contribute to their unlikely use in routine soil P testing (McDowell and Sharpley, 2001). Unlike the environmental P tests, various routine agronomic soil P test methods, e.g., Bray, citric acid, ISFEI, Olsen, and Truog, have been recommended and used to effectively assess the P-status of soils, and are calibrated for making fertiliser recommendations (Sharpley and Tunney, 2000). It would therefore be prudent if these agronomic methods could also be used in addressing water quality issues, while maintaining the equally important agronomic soil productivity. Moreover, the methods can also be implemented where limited resources are available, making them appropriate for agronomic and environmental soil P tests. However, agronomic P tests require more evaluation in terms of accuracy in measuring the soil P susceptible to runoff (Magyar et al., 2006).
The aim of this study was therefore to provide information that authenticates the importance of agronomic and environmental soil tests in measuring the P concentration in the surface layer of soils, with the purpose of determining threshold values critical for proper regulatory compliance and management of P sources for both agronomic and environmental purposes.
MATERIAL AND METHODS
Topsoil samples were collected in natural vegetated veld from the Jacobsdal, Bloemfontein, and Ficksburg districts, all in the Free State Province, South Africa. These districts are located along the 29°S latitude, resulting in different mean annual precipitation (MAP) and mean annual evaporation (MAE) values. Jacobsdal, Bloemfontein, and Ficksburg are classified as arid (200-300 mm MAP and 1 700-1 800 MAE), semi-arid (500-600 mm MAP and 1 600-1 700 MAE), and sub-humid (700-800 mm MAP and 1 300-1 400 MAE), respectively (Midgeley et al., 1994). Their approximate elevation above mean sea level increases from 1 150 m at Jacobsdal, to 1 400 m at Bloemfontein, and 1 850 m at Ficksburg.
The geology is typical of the Karoo Supergroup sequence, with shale of the Ecca Group at Jacobsdal, and sandstone, shale, and mudstone of the Beaufort Group at Bloemfontein. Dolerite intrusions are common in both districts. At Ficksburg, Elliott Formation sandstone and mudstone occurs predominantly, with some inliers of Molteno Formation sandstone, mudstone, and grit, due to narrow dolerite dykes, as well as Clarens Formation sandstone outliers (Geological Survey, 1984).
Soils in Jacobsdal are characterised by shallow to deep, structureless, well-drained, red, eutrophic soils, with yellow soils occurring sub-dominantly (Chromic Luvisols; IUSS Working Group WRB, 2015). The soils in Bloemfontein are structureless, well-drained, red and yellow, eutrophic soils (Chromic Luvisols), with plinthic (Chromic Stagnic Plinthic Luvisols) and duplex (Cutanic Luvisols) soils occurring sub dominantly. In the Ficksburg area, the soils are structureless, red and yellow, well-drained, dystrophic to eutrophic soils (Chromic Lixisols and Luvisols), with plinthic soils (Chromic Stagnic Plinthic Lixisols and Luvisols) occurring sub-dominantly.
Jacobsdal, with Mixed Nama Karoo vegetation, is situated on the edge of the Nama Karoo Biome. Both Bloemfontein, with Dry Sandy Highveld vegetation, and Ficksburg, with Moist Cool Highveld vegetation, occur in the Grassland Biome (Low and Rebelo, 1996).
Mixed crop and stock farming is practised in all the districts. Stock farming entails grazing of natural vegetation by cattle and/ or sheep. Cattle are more dominant in the sub-humid climate of Ficksburg, while sheep farming is more dominant in the arid climate of Jacobsdal. At Jacobsdal, cropping of cotton, lucerne, maize, peanut, potato and wheat is only viable under irrigation. Rainfed maize and wheat are the major crops at Bloemfontein and Ficksburg. Soybean at Ficksburg and sunflower at Bloemfontein are also often planted as alternatives.
Four sites within a radius of 5 km of each other were selected in each district for collection of bulk topsoil samples from vegetated veld with low extractable P content (Table 1), while the other soil properties were very similar to that of cropped soils in the district (Table 2). At each site about 150 kg of soil was collected from the orthic A horizon (approximately 0-300 mm), and all living plants and plant residues were removed. The wet soil was mixed, air dried, crushed, sieved through a 2 mm sieve and mixed again before being stored for treatment and analysis.
Seven different P concentrations (equivalent to 0, 5, 13, 25, 42, 65 and 95 mgP-kg-1 soil) were applied using KH2PO4 solution to each of the 12 bulk samples, replicated 3 times, giving 252 treatments. For each treatment, 400 g of soil was weighed and spread evenly in a thin layer on a plastic sheet. Sufficient KH2PO4 solution of appropriate concentration was then sprayed onto the soil to wet it to approximately 70% of field water capacity. This was done with a sprayer connected to a burette, to ensure precision application. After spraying, the soil was mixed thoroughly and then placed in a 500 mL plastic container. A perforated lid was put on, which allowed drying at room temperature during incubation. During the three months of incubation, the soil was wetted several times to 70% of field water capacity with distilled water, mixed, and dried again, as described above. After incubation, the treated soil was air dried, sieved and stored for P analyses.
Standard methods (The Non-Affiliated Soil Analysis Working Committee, 1990) were used to analyse the 252 treated samples for particle size distribution (pipette and sieve method), organic carbon (Wakley-Black method), pH (1:2.5 soil water suspension), exchangeable cations and cation exchange capacity (1 mol dm-3 NH4OAc at pH 7). Each of these analyses was done in triplicate.
Soil from the 252 P-treated samples were also analysed in triplicate for extractable P. The agronomic P status of the treated samples was determined using the Bray 1, citric acid, ISFEI, Olsen, and Truog methods (The Non-Affiliated Soil Analysis Working Committee, 1990), while the environmental P status was determined using the CaCl2 (Kuo 1996) and DPSox (Beck et al., 2004) methods. The DPSox method actually calculates the P saturation from ammonium oxalate extractable P, Fe, and Al. The concentration of P in solution was determined colorimetrically, irrespective of the extraction method used, with the ammonium molybdate method in which ascorbic acid is the reducing agent (Murphy and Riley, 1962).
Linear and non-linear regression models, using Microsoft Excel 2007 in Windows XP were used to establish correlations between P extracted through the different methods. The most suitable model was selected based on the correlation coefficient (R2), to determine the relationship between and/or among agronomic and environmental P tests for each individual soil's data, when data of all soils from one district were pooled, and when data from all three districts were combined.
RESULTS
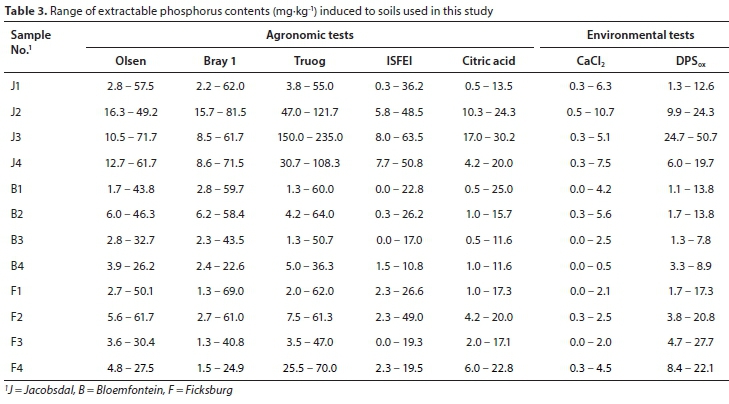
The induced soil P concentrations varied considerably between the studied soils (Table 3), depending on soil properties and extraction method. The smallest differences were observed in the B4 soil, regardless of extraction method used. These differences were, in increasing order: 0.5 mgP-kg-1 for CaCl2, 5.6 mgP-kg-1 for DPSox, 9.3 mgP-kg-1 for ISFEI, 10.6 mgP-kg-1 for citric acid, 20.2 mgP-kg-1 for Bray 1, 22.3 mgP-kg-1 for Olsen, and 31.3 mgP-kg-1 for Truog. On the other hand, the largest differences were observed in the J2 (CaCl2), J3 (Olsen, Truog, and DPSox), B1 (citric acid), and F1 (Bray 1) soils. These differences were, in decreasing order: 85.0, 67.7, 61.2, 55.5, 26.0, 24.5, and 10.2 mgP-kg-1, for the Truog, Bray 1, Olsen, ISFEI, DPSox, citric acid, and CaCl2 methods, respectively.
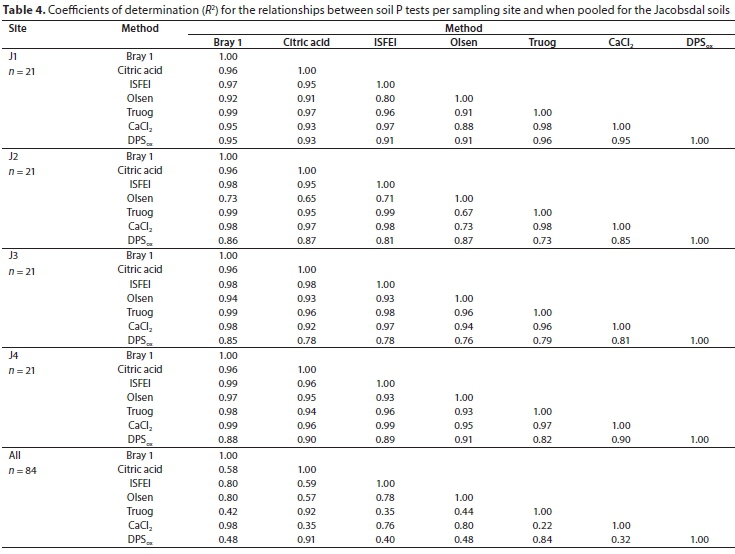
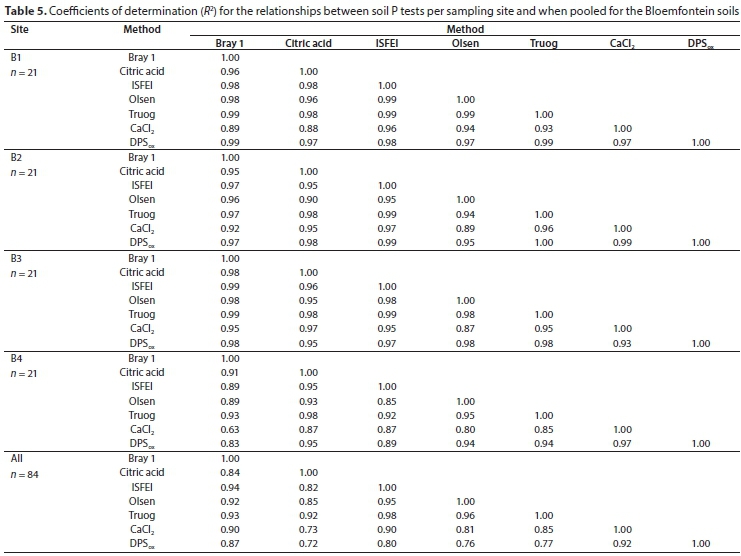
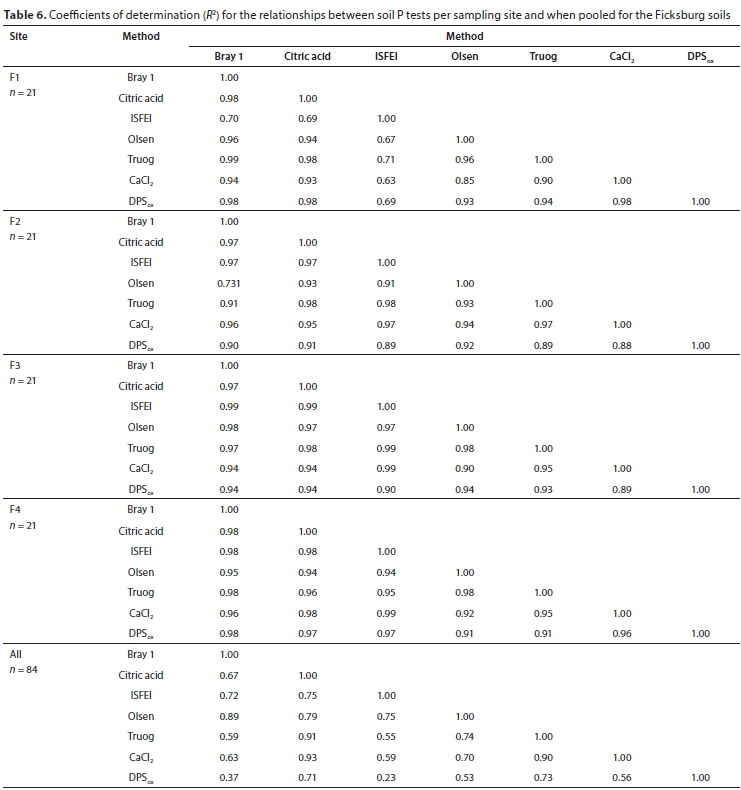
Soil P tests are significantly related to each other per sampling site and when sampling sites were pooled for the Jacobsdal (Table 4), Bloemfontein (Table 5), and Ficksburg (Table 6) districts. The lowest R2 values were estimated for the Olsen vs. ISFEI at J1 (0.80), Truog vs. Olsen at J2 (0.67), DPSox vs. Olsen at J3 (0.76), and DPSox vs. Truog at J4 (0.82). At B1, B2, B3, and B4 the lowest R2values were realised for the CaCl2 vs. citric acid (0.88), CaCl2 vs. Olsen (0.89), CaCl2 vs. citric acid (0.73), and DPSox vs. Bray 1 (0.83), respectively. The R2-values of CaCl2 vs. ISFEI at F1 (0.63), DPSox vs. CaCl2 at F2 (0.88), DPSox vs. CaCl2 at F3 (0.87), and DPSox vs. CaCl2 at F4 (0.91) were the lowest. A large variation between soil P tests was therefore experienced per sampling site.
Lower R2values were calculated when the measured soil P concentrations of the sampling sites per district were pooled (Tables 4, 5, and 6). For Jacobsdal, the R2values ranged from 0.22 (CaCl2 vs. Truog) to 0.92 (Truog vs. citric acid). The range of R2 values for Bloemfontein was from 0.72 (DPSox vs. citric acid) to 0.98 (Truog vs. ISFEI). The R2 values for Ficksburg varied between 0.23 (DPSox vs. ISFEI) and 0.93 (CaCl2 vs. citric acid).
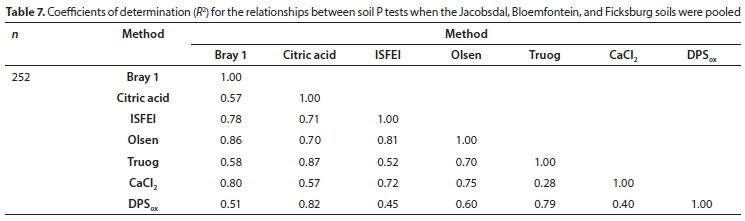
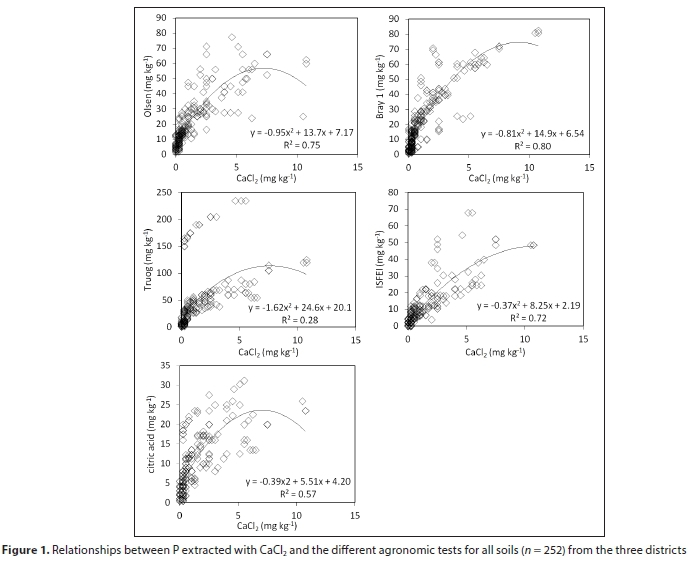
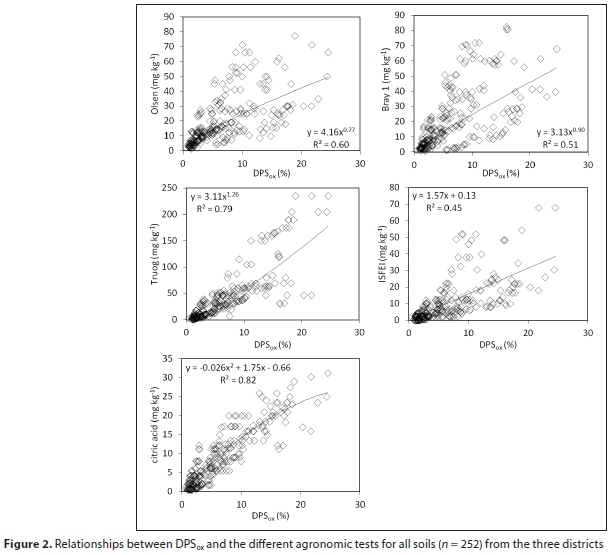
The pooling of soil P concentrations from all three districts gave R2 values (Table 7) of 0.40 (DPSox vs. CaCl2) to 0.87 (Truog vs. citric acid). Soil P extracted with CaCl2 correlated well with ISFEI (R2 = 0.72), Olsen (R2 = 0.75), and Bray 1 (R2 = 0.80), indicating that these agronomic soil P tests can probably be used for the determination of environmental soil P (Fig. 1). Conversely, soil P extracted with DPSox correlated well with those soils extracted with Truog (R2 = 0.79), and citric acid ((R2 = 0.82), suggesting that these two agronomic soil P tests can also be considered to measure environmental soil P (Fig. 2).
DISCUSSION
The results presented here proved that a generally good relationship exists between the environmental and agronomic soil P tests. The strength of these observed relationships depends on the extractant used, because they differ in their abilities to extract P from different soils (Kuo, 1996). The closeness of a relationship also depends on the group of soils included since the correlation was stronger when individual soils were correlated separately rather than when all the soils from a district were grouped. As expected, a weaker correlation manifested when all soils' extractable P data were regressed. This reflects the conclusions of other studies (Lookman et al., 1996; Pote et al., 1996; Sims et al., 1998), which stated that the correlation is usually strong when the studied soils are fairly homogeneous in clay content and pH, but weaker if soils with a wide range in these properties are considered. However, White et al. (2020) report strong correlations (r > 0.85) between some agronomic soil P tests for 48 South African pristine and cultivated soils with large pH (4-8) and clay content (6-45%) ranges. They emphasise that each agronomic soil P test was developed for a specific set of soil conditions and that inconsistencies in soil P analyses can be expected. No environmental soil P tests were, however, included in their study.
Some threshold values for the CaCl2 extractable P and for DPSox extractable P are given in Tables 8 and 9, respectively. The values were 1.49 mgP-kg-1 for CaCl2 extractable P and 21.1% for DPSox extractable P. These averages were subsequently used to calculate agronomic P threshold values for each of the three districts and when the districts' data were grouped (Table 10).
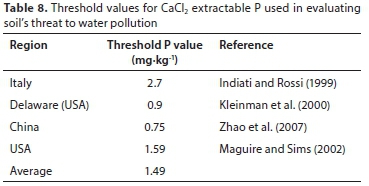

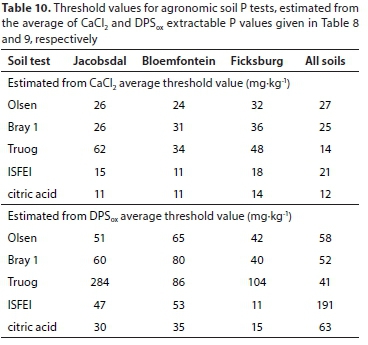
Based on the average CaCl2 extractable P threshold value, the estimated P threshold values of the agronomic soil P tests for each district and over the three districts were lower than the optimum extractable P values used locally for P fertiliser recommendations (Table 11), except for the Olsen P test (Table 10). The implication is that when the extractable P status of cropped soils are maintained at optimum levels, as measured with Bray 1, citric acid, ISFEI, and Truog, the fertilised soil may be a threat in terms of causing water P pollution.
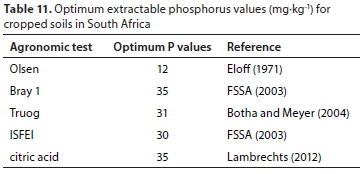
When the threshold values of the agronomic soil P tests for each district and over the three districts were estimated with the average DPSox extractable P threshold value, they were much higher (Table 10) than the optimum extractable P values used in South Africa for fertiliser recommendations (Table 11). Thus, the maintenance of the cropped soil P status at optimum levels should not result in a threat of water P pollution from these soils. This was converse to the threshold values estimated for the CaCl2 extractable P.
In general, the results presented here indicated that the estimated threshold values depend on the extractant used and on the variation in soil properties. This therefore implies that grouping of soils that would respond similarly to P extraction is essential in areas where soils exhibit substantial variation in chemical and mineralogical properties, if these agronomic P tests are to be used for effective management of surface water P pollution.
Generally, it seemed feasible that agronomic soil P tests, used in routine soil analyses for fertiliser recommendations, can also be appropriate in managing the risk of surface water P pollution from cropped soils. Of the five agronomic soil P tests evaluated in this study, it was only the Olsen test that showed the potential to develop a simple threshold for all soils. Further studies are however warranted to establish reliable threshold P values before agronomic soil P tests could be considered for this purpose. It is believed that reliable threshold values can be only established through field studies, by relating the P in runoff to the extracted P from cropped soil.
CONCLUSIONS
The results presented here indicated that P threshold values for the agronomic P soil tests, which were established from the average P threshold values for the environmental P soil tests, vary depending on the test used and also on the soil properties. Some of the values were below and others were above the optimum extractable P values used in South Africa for crop P fertiliser recommendations. Thus, the use of agronomic soil P tests for the environmental assessment of soil P would require further investigation into the grouping of soils for an appropriate extraction method for selecting threshold values from an environmental point of view. However, the general observation made from the data reported in this study was that agronomic soil P tests could be used in regulating application rates of P fertiliser to decrease the risk of excessive P accumulation and its subsequent loss to the environment, while still ensuring optimum agricultural production.
ACKNOWLEDGEMENTS
We gratefully acknowledge Inkaba ye Africa (paper No 258) and the University of the Free State for funding this research.
REFERENCES
ANZECC (2000) The Australian and New Zealand guidelines for fresh and marine water quality. Australian and New Zealand Environment and Conservation Council and Agriculture and Resource Management Council of Australia and New Zealand. Canberra. https://doi.org/10.1300/j252v01n02_09 [ Links ]
BECK MA, ZELAZNY LW, DANIELS WL and MULLINS GC (2004) Using the Mehlich-1 extract to estimate soil phosphorus saturation for environmental risk assessment. Soil Sci. Soc. Am. J. 68 1762-1771. https://doi.org/10.2136/sssaj2004.1762 [ Links ]
BOTHA F and MEYER JH (2004) Cost implications and grower perceptions of phosphorus fertilizer recommendations based on soil tests not calibrated for sugar cane. Proc. S. Afr. Sugar Technol. Assoc. 78 373-382. [ Links ]
BREEUWSMA A, REIJERINK JGA and SCHOUMANS OF (1995) Impact of manure on accumulation and leaching of phosphate in areas of intensive livestock farming. In: Steele K (ed) Animal Waste and Land Water Interface. Lewis Publishers-CRC, New York. [ Links ]
DE SMET J, HOFMAN G, VANDERDEELEN J, VAN MEIRVENNE M and BAERT L (1996) Phosphate enrichment in sandy loam soils of West-Flanders, Belgium. Fertiliser Res. 43 209-215. https://doi.org/10.1007/bf00747704 [ Links ]
DE VILLIERS S and THIART C (2007) The nutrient status of South Africa rivers: Concentration, trends and fluxes from the 1970's to 2005. S. Afr. J. Sci. 103 7-8. [ Links ]
ELOFF JF (1971) Studies oor die toeganklike fosforstatus van sekere Vaalhartsgronde. M.Sc. Agric. dissertation, University of the Free State, Bloemfontein. [ Links ]
FSSA (Fertilizer Society of South Africa) (2003) Fertilizer Handbook (6th edn.) Fertilizer Society of South Africa, Pretoria. [ Links ]
GEOLOGICAL SURVEY (1984) Geological map of the Republics of South Africa, Transkei, Bophuthatswana, Venda and Ciskei and the Kingdoms of Lesotho and Swaziland. Scale 1:1 000 000. Geological Survey of South Africa, Council for Geoscience, Pretoria. https://doi.org/10.2307/1222283 [ Links ]
HARDING WR, DOWNING TG, VAN GINKEL CE and MOOLMAN AP (2009) An overview of cyanobacterial research and management in South Africa post-2000. Water SA. 35 479-484. https://doi.org/10.4314/wsa.v35i4.76792 [ Links ]
HAVLIN JL, TISDALE LS, NELSON LW and BEATON JD (2014) Soil Fertility and Fertilizers: An Introduction to Nutrient Management (8th edn). Pearson Inc., New Jersey. [ Links ]
HAYGARTH PM, BARDGETT RD and CONDRON LM (2013) Nitrogen and phosphorus cycles and their management. In: Gregory PJ, and Northcliff S (eds) Soil Conditions and Plant Growth. Wiley-Blackwell, Chester. https://doi.org/10.1002/9781118337295.ch5 [ Links ]
HORTA MC and TORRENT J (2006) The Olsen P method as an agronomic and environmental test for predicting phosphate release from acid soils. Nutr. Cycl. Agroecosyst. 77 283-292. https://doi.org/10.1007/s10705-006-9066-2 [ Links ]
INDIATI R and ROSSI N (1999) Extractability of residual phosphorus from highly manured soils. Ital. J. Agron. 3 63-73. [ Links ]
IUSS WORKING GROUP WRB (2015) World Reference Base for Soil Resources 2014, update 2015. International soil classification system for naming soils and creating legends for soil maps. World Soil Resources Reports No. 106. FAO, Rome. https://doi.org/10.1007/springerreference_76722 [ Links ]
KLEINMAN PJA, BRYANT RB, REID WS, SHARPLEY AN and PIMENTEL D (2000) Using soil phosphorus behavior to identify environmental thresholds. Soil Sci. 165 943-950. https://doi.org/10.1097/00010694-200012000-00004 [ Links ]
KUO S (1996) Phosphorus. In: Sparks DL, Page AL, Helmeke PA, Loeppert RH, Soltanpour ON, Tabatabai MA, Johnston CT and Summer ME (eds) Methods of Soil Analysis. Part 3. Chemical Methods. Soil Science Society of America, Madison. https://doi.org/10.2136/sssabookser5.3 [ Links ]
LAMBRECTS JJN (2012) Personal communication, 19 March 2012. Mr Jan Lambrects, Department of Soil Science, University of Stellenbosch. [ Links ]
LAND TYPE SURVEY STAFF (2002) Land types of South Africa. ARC- Institute for Soil, Climate and Water, Pretoria. [ Links ]
LEINWEBER P, LÜNSMANN F and ECKHARDT KU (1997) Phosphorus sorption capacities and saturation of soils in two regions with different livestock densities in Northwest Germany. Soil Use Manage. 13 82-89. https://doi.org/10.1111/j.1475-2743.1997.tb00562.x [ Links ]
LOOKMAN R, JANSEN K, MERCKX R and VLASSAK K (1996) Relationship between soil properties and phosphate saturation parameters: A transect study in northern Belgium. Geoderma. 69 265-274. https://doi.org/10.1016/0016-7061(95)00068-2 [ Links ]
LOW AB and REBELO AG (1996) Vegetation of South Africa, Lesotho and Swaziland. Department of Environmental Affairs and Tourism, Pretoria. [ Links ]
MAGUIRE RO and SIMS J (2002) Soil testing to predict phosphorus leaching. J. Environ. Qual. 31 1601-1609. https://doi.org/10.2134/jeq2002.1601 [ Links ]
MAGYAR M, CSATHO P, DEBRECZENI K and SARDI K (2006) Evaluation of agronomic and environmental soil P test methods in a network of Hungarian long-term field trials. Commun. Soil Sci. Plant Anal. 37 2423-2446. https://doi.org/10.1080/00103620600820006 [ Links ]
MARDAMOOTOO T (2015) Developing an index for phosphorus loss from sugarcane soils in Mauritius. PhD dissertation, University of the Free State, Bloemfontein. [ Links ]
MCDOWELL RW and SHARPLEY AN (2001) Approximating phosphorus release from soils to surface runoff and subsurface drainage. J. Environ. Qual. 30 508-520. https://doi.org/10.2134/jeq2001.302508x [ Links ]
MIDGLEY DC, PITMAN WV and MIDDLETON BJ (1994) Surface water resources of South Africa 1990 Book of maps. WRC Report No. 298/2/94. Water Research Commission, Pretoria. [ Links ]
MURPHY J and RILEY JP (1962) A modified single solution method for the determination of phosphate in natural waters. Anal. Chim. Acta. 27 31-36. https://doi.org/10.1016/s0003-2670(00)88444-5 [ Links ]
NAIR VD, PORTIER KM, GRAETZ DA and WALKER ML (2004) An environmental threshold for degree of phosphorus saturation in sandy soils. J. Environ. Qual. 33 107-113. https://doi.org/10.2134/jeq2004.1070 [ Links ]
PAUTLER MC and SIMS JT (2000) Relationship between soil test phosphorus, soluble phosphorus, and phosphorus saturation in Delaware soils. Soil Sci. Soc. Am. J. 64 765-773. https://doi.org/10.2136/sssaj2000.642765x [ Links ]
POTE DH, DANIEL TC, SHARPLEY AN, MOORE PA, EDWARDS DR and NICHOLS DJ (1996) Relating extractable soil phosphorus to phosphorus losses in runoff. Soil Sci. Soc. Am. J. 60 855-859. https://doi.org/10.2136/sssaj1996.03615995006000030025x [ Links ]
PROVIN TL (1996) Phosphorus retention in Indiana soils. PhD thesis, Purdue University, West Lafayette, Indiana. [ Links ]
ROSSOUW JN and GÖRGENS AHM (2005) Knowledge review of modelling non-point source pollution in agriculture from field to catchment scale. WRC Report No. 1467/1/05. Water Research Commission, Pretoria. [ Links ]
ROSSOUW JN, HARDING WR and FATOKI OS (2008) A guide to catchment-scale eutrophication assessments for rivers, reservoirs and lacustrine wetlands. WRC Report No. TT 352/08. Water Research Commission, Pretoria. [ Links ]
SHARPLEY AN (2007) Modelling phosphorus movement from agriculture to surface waters. In: Radcliffe DE and Cabrera ML (eds). Modelling Phosphorous in the Environment. CRC Press, Boca Raton. [ Links ]
SHARPLEY AN and TUNNEY H (2000) Phosphorus research strategies to meet agricultural and environmental challenges of 21st century. J. Environ. Qual. 29 176-181. https://doi.org/10.2134/jeq2000.00472425002900010022x [ Links ]
SIMS JT, SIMARD RR and JOERN BC (1998) Phosphorus loss in agricultural drainage: Historical perspective and current research. J. Environ. Qual. 27 277-293. https://doi.org/10.2134/jeq1998.00472425002700020006x [ Links ]
SOIL CLASSIFICATION WORKING GROUP (1991) Soil classification - A taxonomic system for South Africa. Memoirs on the Agricultural Natural Resources of South Africa No. 15. Department of Agriculture and Water Supply, Pretoria. [ Links ]
THE NON-AFFILIATED SOIL ANALYSIS WORK COMMITTEE (1990) Handbook of standard soil testing methods for advisory purposes. Soil Science Society of South Africa, Pretoria. [ Links ]
USEPA (United States Environmental Protection Agency) (1986) Quality criteria for water, 1986. United States Environmental Protection Agency, Office of Water Regulations and Standards. Washington, DC. [ Links ]
VAN DER LAAN M, ANNANDALE JG, TESFAMARIAM EH, DU PREEZ CC, BENADE N, BRISTOW K and STIRZAKER RJ (2012) Modelling nitrogen and phosphorous dynamics in cropping systems at the field scale. WRC Report No. 1516/1/12. Water Research Commission, Pretoria. [ Links ]
VAN DER LAAN M and FRANKE AC (2019) Quantifying and managing agricultural nitrogen and phosphorous pollution from field to catchment scale. WRC Report No. TT 792/12. Water Research Commission, Pretoria. [ Links ]
WELD J and SHARPLEY AN (2002) Phosphorous indices. In: Radcliffe DE and Cabrera ML (eds) Modelling Phosphorus in the Environment. CRC Press, Boca Raton. [ Links ]
WHITE VG, HARDIE AG and RAATH PG (2020) Relationships between commonly used South African and international soil phosphorus extraction methods on pristine and cultivated soils. S. Afr. J. Plant Soil. 37 (4) 265-272. https://doi.org/10.1080/02571862.2020.1741708 [ Links ]
ZHAO X, ZHANG X, BAO H, LI H, LI G, TUO D, LIN Q and BROOKES PC (2007) Relating soil phosphorus concentration at which phosphorus movement occurs to soil properties in Chinese agricultural soils. Geoderma. 142 237-244. https://doi.org/10.1016/j.geoderma.2007.07.012 [ Links ]
 Correspondence:
CW van Huyssteen
Email: vanhuyssteencw@ufs.ac.za
Received: 20 April 2020
Accepted: 23 November 2020

