


Services on Demand
Article
 English (pdf)
 Article in xml format
 Article references
Indicators

Related links
-
 Cited by Google
 -
 Similars in Google
Share

 Permalink
Water SA
On-line version ISSN 1816-7950
Print version ISSN 0378-4738
Water SA vol.47 n.1 Pretoria Jan. 2021
http://dx.doi.org/10.17159/wsa/2021.v47.i1.9445
RESEARCH PAPER
Poly- and perfluorinated substances in environmental water from the Hartbeespoort and Roodeplaat Dams, South Africa
B Batayi; OJ Okonkwo; AP Daso
Department of Environmental, Water and Earth Sciences, Faculty of Science, Tshwane University of Technology, Arcadia Campus, Pretoria, South Africa
ABSTRACT
Concentrations of poly- and perfluorinated substances (PFASs) were determined in Hartbeespoort and Roodeplaat Dams, South Africa. Water samples were collected from the dams in February-March, and May-June, representing southern hemisphere summer and winter seasons, respectively. Solid phase extraction (SPE) was used to extract the analytes from the water samples and liquid chromatography-tandem mass spectrometry (LC-MS/MS) used for analysis. The mean PFAS concentrations detected ranged from 1.38-346.32 ng-L-1 and 2.31-262.29 ng-L-1 in the Hartbeespoort Dam and Roodeplaat Dam, respectively. Perfluorooctanoic acid (PFOA), perfluorooctane sulfonic acid (PFOS), perfluorohexane sulfonic acid (PFHxS) and perfluoroheptanoic acid (PFHpA) were the most dominant PFASs detected. The PFAS concentrations detected were higher in summer than in winter, but the difference between seasons was not statistically significant (p = 1). Furthermore, the concentrations of short-chain PFASs were higher than the longer chains. Overall, the PFAS concentrations in the present study are comparable to those reported in other parts of South Africa, and also Ghana, higher than the concentrations reported in Uganda, Singapore, and Vietnam, and lower than those in Germany, Japan and China. The measured concentrations of PFOA and PFOS raise concerns of human exposure to these chemicals since they are above the USEPA advisory limit. This suggests that communities living within the vicinity of the dams are most likely to be exposed to these chemicals.
Keywords: PFASs, concentrations, Hartbeespoort and, Roodeplaat Dams;, surface water, South Africa
INTRODUCTION
Poly- and perfluorinated substances (PFASs) are synthetic organic chemicals, produced since the 1950s by two methods, known as the Simons electrochemical fluorination and telomerization of tetrafluoroethylene (Lehmler, 2005). These methods yield fluorinated molecules of various carbon chain lengths and alcohols that can be transformed into final products for commercial applications (Lau et al., 2007). These compounds are persistent, bio-accumulative and toxic (Lau et al., 2007; Giesy et al., 2010). The properties of PFASs, such as water, oil, and grease repellence, cause them to be widely applied in industrial and consumer products such as textiles, firefighting foams and floor polishes (Prevedouros et al., 2006; Wang et al., 2010; Vierke et al., 2012). However, the eight-carbon chain perfluorooctane sulfonate (PFOS) and perfluorooctanoic acid (PFOA) are of most concern amongst the group of PFASs (Melzer et al., 2010).
PFASs have spread globally over the years in various environmental matrices, including air, surface water, sediments, fish, other wildlife, and in the aqueous environment (Martin et al., 2003). Giesy and Kannan, (2001) and Hansen et al. (2001) reported the first occurrence in global wildlife and in human serum, respectively. Since then, PFASs have been detected in a variety of environmental matrices and this has raised concern over human exposure to these matrices, as some are sources of drinking water (Banzhaf et al., 2017). Countries have set restrictions and regulations on the use of PFASs (Nguyen et al., 2017) in order to combat or minimise human exposure to these compounds.
High concentrations of PFASs in human serum have been detected among individuals who drank suspected PFASs-contaminated water (USEPA, 2001; LHWA, 2005; Skutlarek et al., 2006; Loos et al., 2007). Investigations of PFASs compounds from contaminated drinking water in the United States, Europe, Asia and China suggest that water treatment steps may not be sufficient in removing PFASs (Saito et al., 2004; Skutlarek et al., 2006; Loos et al., 2007; Jin et al., 2009). High PFOS and PFOA levels have been reported to result in increased liver and kidney weight, reduced postnatal survival with impaired growth, cardiac abnormalities, maternal weight loss, mortality and induced immunological alterations in laboratory animal studies (3M Company, 2005; Lieder et al., 2007; Lau et al., 2007; White et al., 2007; Lau et al., 2003; Xia et al., 2011; Chen et al., 2012b; Qazi et al., 2012). The USEPA and IARC concluded that PFOA and PFOS have carcinogenic potential in humans (USEPA, 2016a; USEPA, 2016b; IARC, 2017).
In many countries, PFASs have been detected in drinking water resources. However, there has been limited information on the levels of PFASs in South African water systems. In a study conducted in the Western Cape Province, South Africa, PFASs were detected in both raw and treated drinking water, and the concentration of the majority of the PFASs detected in treated water was higher than that quantified in raw water (Booi, 2013). The suggested source of possible contamination was by materials used during water treatment. In another study, Mudumbi et al. (2014) reported PFOS and PFOA concentrations of 181.8 ng-L-1 and 390 ng-L-1, respectively, in three rivers in the Western Cape Province, South Africa. Groffen et al. (2018) also detected PFASs in the Vaal River, Gauteng Province, South Africa; however, this was at lower concentrations of PFOS (34.5 ng-L-1) and PFOA (4.2 ng-L-1) compared to the study by Mudumbi et al. (2014). The detection of these compounds in these rivers suggests that PFASs are present in South African rivers and, therefore, information is needed for other water systems (Mudumbi et al., 2014). PFAS contamination levels are usually associated with industrial activities, highly populated areas, and economic development of a country (Cai et al., 2012; Cao et al., 2019). However, the appreciable levels of these compounds detected in South African surface waters to date reveals the need for further studies, in order to generate more data that can be used to make informed decisions on the fate of these compounds and their sources in the environment.
The aim of the present study was, therefore, to identify the presence and concentrations of targeted PFASs in water samples from two important water sources, Hartbeespoort and Roodeplaat Dams, since the dams provide water for domestic consumption, irrigation, fishing and recreational activities.
MATERIALS AND METHODS
Site description
The sampling sites were Hartbeespoort and Roodeplaat Dams, South Africa. The dams are important water resources in the country. Roodeplaat Dam is located approximately 24 km northeast of Pretoria, north of the Magaliesberg, while Hartbeespoort Dam is located in the North West Province, in the Crocodile River catchment, within the Limpopo River system. Three water treatment plants abstract raw water from Roodeplaat Dam, which supply potable water to three provinces, namely, Gauteng, North West and Limpopo (City of Tshwane, 2007). The quality of the water in the Roodeplaat Dam has been a cause for concern due to hypertrophic conditions (DWS, 2016a). Hartbeespoort Dam is a storage reservoir primarily providing water for irrigation and domestic consumption, recreation, and compensation flows to downstream portions ofthe Crocodile River (DWS, 2016b). About 90% of the inflow of the Hartbeespoort Dam is derived from the Crocodile River, which is balanced by inflow generated from the Magalies River watershed (DWAF, 2006). Since the Crocodile River drains a large, highly industrialised and urbanised area, the dam is subject to high levels of pollution (Walmsley et al., 1999). The locations of the dams are shown in Figs 1 and 2.
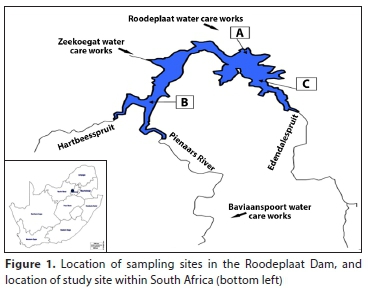

In the Roodeplaat Dam (Fig. 1), Sampling Point A is located at the dam wall. Point B is located upstream of the dam, where there is inflow from the Hartbeesspruit and Pienaars Rivers. The Pienaars River drains into the central part ofthe Roodeplaat Dam, receiving run-off from the Mamelodi Township, and treated sewage from the Baviaanspoort sewage works (Pieterse et al., 1990). The river is also the largest contributor to the dam. The Hartbeesspruit drains the suburban western part of the Roodeplaat Dam catchment, as well as an industrial area, through its tributary, the Moreletaspruit (Bosman et al., 1985). The Hartbeesspruit is the second-largest contributor of water to the Roodeplaat Dam. Point C is located downstream of the dam, where there is an inflow from the Edendalespruit, which mainly drains into the agricultural area on the east side of the Roodeplaat Dam catchment (Bosman et al., 1985).
Sampling Point A in the Hartbeespoort Dam (Fig. 2) represents the Magalies River inflow into the dam, where significant irrigation and mining activities are present (DWAF, 2008). Sampling Point B is located in the middle of the dam, between Points A and C. Sampling Point C of the dam represents the Crocodile River inflow. The Crocodile River contributes about 90% of the annual inflow into the dam (DWAF, 2006) and drains a highly industrialised and urbanised area (DWAF, 2008). The Jukskei River, which has a history of poor water quality because of the indiscriminate dumping of waste along its banks, mostly by the residents of Alexandra in Johannesburg, is a tributary of the Crocodile River (Abbott, 2002; DWS, 2016b).
Chemicals, reagents and materials
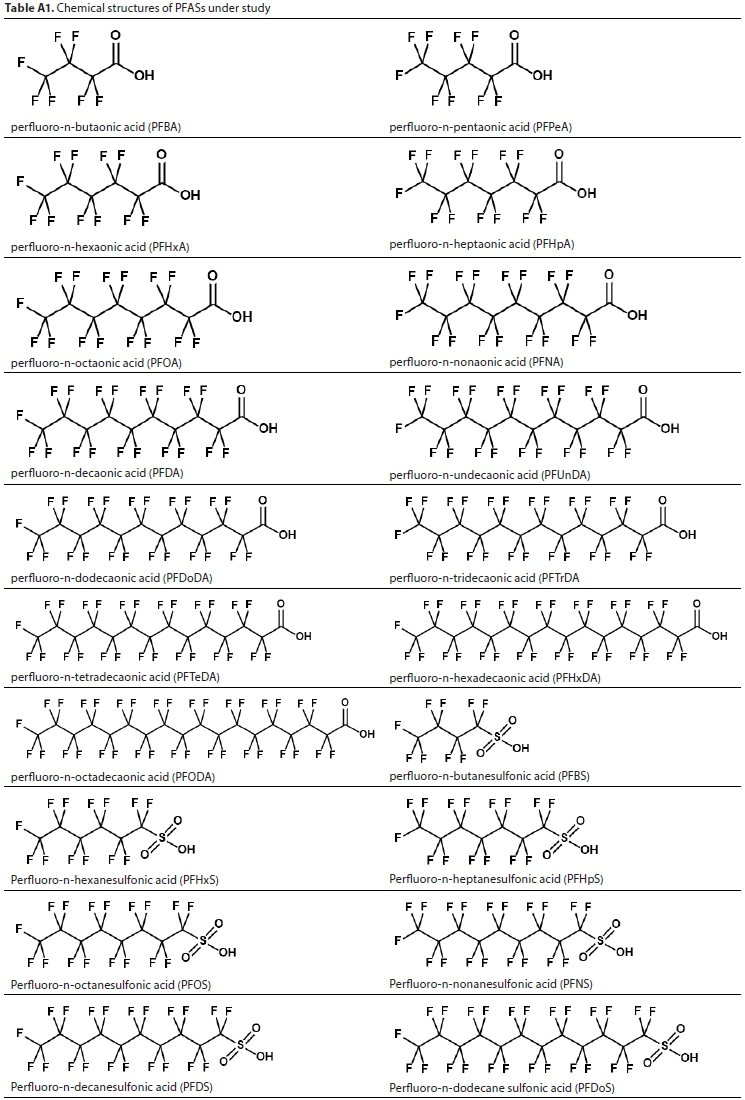
A 50 mg-L-1 PFAS standard mix, with 20 investigated PFASs, namely, perfluoro-n-butaonic acid (PFBA), perfluoro-n-pentaonic acid (PFPeA), perfluoro-n-hexaonic acid (PFHxA), perfluoro-n-heptaonic acid (PFHpA), perfluoro-n-octaonic acid (PFOA), perfluoro-n-nonaonic acid (PFNA), perfluoro-n-decaonic acid (PFDA), perfluoro-n-undecaonic acid (PFUnDA), perfluoro-n-dodecaonic acid (PFDoDA), perfluoro-n-tridecaonic acid (PFTrDA), perfluoro-n-tetradecaonic acid (PFTeDA), perfluoro-n-hexadecaonic acid (PFHxDA), perfluoro-n-octadecaonic acid (PFODA), perfluoro-n-butanesulfonic acid (PFBS), perfluoro-n-hexanesulfonic acid (PFHxS), perfluoro-n-heptanesulfonic acid (PFHpS), perfluoro-n-octanesulfonic acid (PFOS), perfluoro-n-nonanesulfonic acid (PFNS), perfluoro-n-decanesulfonic acid (PFDS) and perfluoro-n-dodecane sulfonic acid (PFDoS) (Table A1, Appendix), were purchased from Wellington Laboratories, Ontario, Canada. Similarly, stable isotopically labelled PFASs standard employed as surrogates were perfluoro-n-[1,2,3, 4-13C4] octanoic acid (MPFOA), perfluoro-n- [1,2,3,4, 5-13C5] nonanoic acid (MPFNA), perfluoro-n-[1,2-13C2] undecanoic acid (MPFUnDA), perfluoro-n-[1,2-13C2] dodecanoic acid (MPFDoDA) and sodium perfluoro-[1,2,3,4-13C4] octanesulfonate (MPFOS). Internal standards were perfluoro-n-[1,2,3,4-13C4] butanoic acid (MPFBA), perfluoro-n-[1,2-13C2] hexanoic acid (MPFHxA), perfluoro-n-[1,2-13C2] decanoic acid (MPFDA) and sodium perfluoro-1-hexane[13C2] sulfonate (MPFHxS) purchased in methanol from Wellington Laboratories (Ontario, Canada). LC-MS grade water, methanol and ammonium acetate were purchased from Sigma-Aldrich (Aston Manor, South Africa). Supelco ENVI-18 SPE cartridges (500 mg, 6 mL) were purchased from Sigma-Aldrich (Aston Manor, South Africa). Amber glass bottles (4 L) previously rinsed with methanol were used during sample collection and clear glass bottles (500 mL) were used during extraction.
Sampling
Water samples were collected using a hosepipe sampler from downstream to upstream of the dams. Staff from the Department of Water and Sanitation (Resource Quality Information Services) in Pretoria assisted with sampling equipment, sampling point selection and sample collection. The samples were collected from three sampling points in each of the selected dams using cleaned 4 L Winchester brown bottles. The samples were collected from February to June 2016, representing southern hemisphere summer and winter seasons. A total of 30 water samples were collected from both dams. The bottles were filled completely to the top with water. Thereafter, the bottles were tightly closed below the water surface, kept cool in a portable ice chest, and transported to the laboratory where they were kept in the cooler room at 4°C until analysis. No preservative was added to the samples because they were analysed within 1-2 days of collection.
Sample preparation
The water samples were extracted using the solid phase extraction (SPE) method previously described by Wang et al. (2011), with some modifications. The Supelco ENVI-18 SPE cartridges were preconditioned with 2 mL methanol followed by 2 mL Milli-Q water. Prior to the extraction, the samples were spiked with 500 |iL of 100 ng-mL-1 labelled surrogate standard (MPFOA, MPFNA, MPFUnDA, MPFDoDA, and MPFOS) and allowed to equilibrate for about 1 hr. Then 500 mL water samples were loaded into the SPE cartridges and a flow rate of one drop per second was maintained. After extraction, the SPE cartridge was vacuumed dry for 1 hr and eluted with 2 x 5 mL methanol into 10 mL polyethylene tubes. Thereafter, the cleaned extracts were blown to incipient dryness under a gentle stream of nitrogen gas. The extracts were reconstituted to 1 mL with methanol and 100 |iL of 2 mg-L-1 internal standards (MPFBA, MPFDA, MPFHxS, MPFHxA), and then centrifuged and transferred to 1mL amber vials prior to instrument analysis.
Instrumental quantification
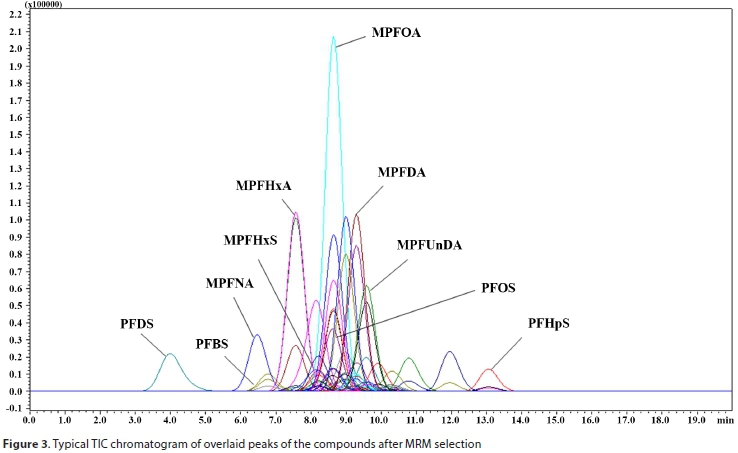
The PFASs were determined using liquid chromatography-tandem mass spectrometry (Shimadzu LC-MS 8030 triple quadrupole system, Kyoto, Japan). The instrument was equipped with an electrospray ionization (ESI) source and the target compounds were separated on an InertSustain C18 (3 |m, 2.1 i.d. x 150 mm) HPLC column (Kyoto, Japan). The injection volume was 10 |iL. The mobile phases consisted of (A) 20 mM ammonium acetate, and (B) 100 % methanol. The mobile phase was initially maintained at 20% B, ramped to 80% B over 7 min, and thereafter increased to 100% B over 20 min, returned to 20% over 22 min, and maintained at 20% over 30 min. The flow rate of 0.2 mL-min-1 was maintained throughout the analysis. The quantitation of the target compounds was based on internal standard method calibration with concentrations ranging from 1.0-250 ng-mL-1. A correlation co-efficient (R2 > 0.99) was achieved in all the calibrations with good precision of the internal standard. The method was developed and optimized through the analysis of the calibration standards employing the highly selective and sensitive multiple reaction monitoring (MRM) mode of analysis (Table A2, Appendix). The MRM selection was under a full scan of ions. Ions corresponding to the compounds of interest were targeted followed by the fragmentation of the targeted parent ions, thus producing a range of daughter ions. The ions and transitions corresponding to the compounds of interest were then selected and isolated from other ions within the mass spectrometer for quantitative analysis using the optimised method. Figure 3 shows a typical total ion chromatogram (TIC) of some of the targeted compounds (overlaid).
Quality assurance and quality control (QA/QC)
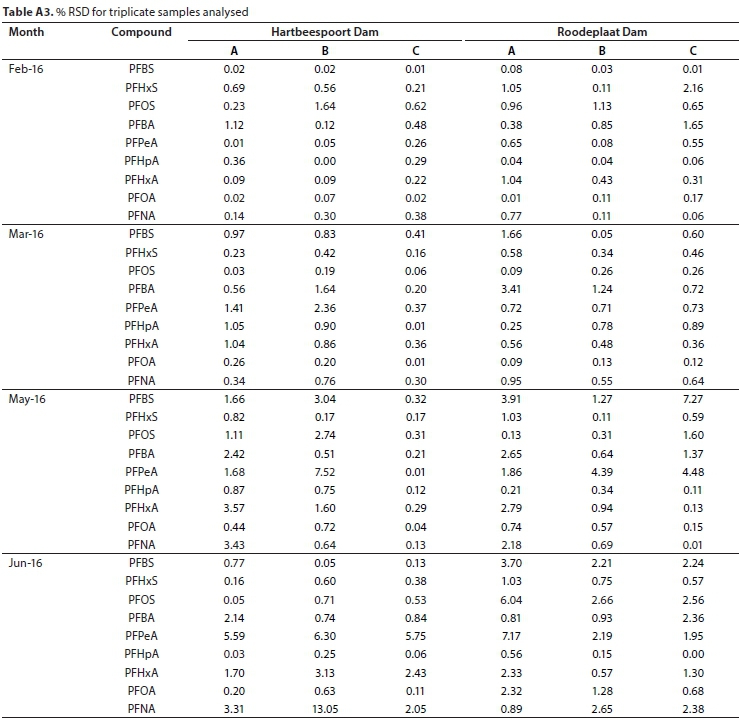
Sample blanks (Milli-Q water) were prepared following the same procedure used for environmental samples to ensure that there was no contamination during sample preparation. Concentrations of target chemicals were subtracted from concentrations found in blanks, when applicable. During the analysis of samples, solvent blanks were run in between samples to check for possible carryovers and a quality control standard (100 ng-L-1) was analysed in each batch to check consistency during instrumental analysis. To assess the accuracy of the extraction method, samples were spiked with the surrogate standard and the recoveries of each compound calculated. Recoveries ranged from 84-115% MPFOS, 116-124% MPFNA, 113-119% MPFUnDA, 108-116% MPFDoA, and 108-114% MPFOA. LOD and LOQ were calculated at 3x and 10x the S/N ratio, respectively (Table A2, Appendix). All the samples were prepared in triplicate and the instrumental analyses were performed in duplicate. Then, the percentage relative standard deviations (% RSD) were calculated for each set of triplicates and these were also generally less than 10% (Table A3, Appendix).
Statistical analysis
Statistical analyses were performed using Statistical Package for Statistical Sciences (SPSS) version 16. Analysis of variance (ANOVA) was performed to test for significant differences in PFAS concentrations between seasons, dams and sampling points, as well as the different PFAS compounds. A p-value < 0.05 was considered statistically significant for all datasets (Table 1).
RESULTS
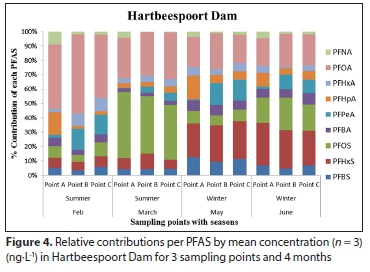
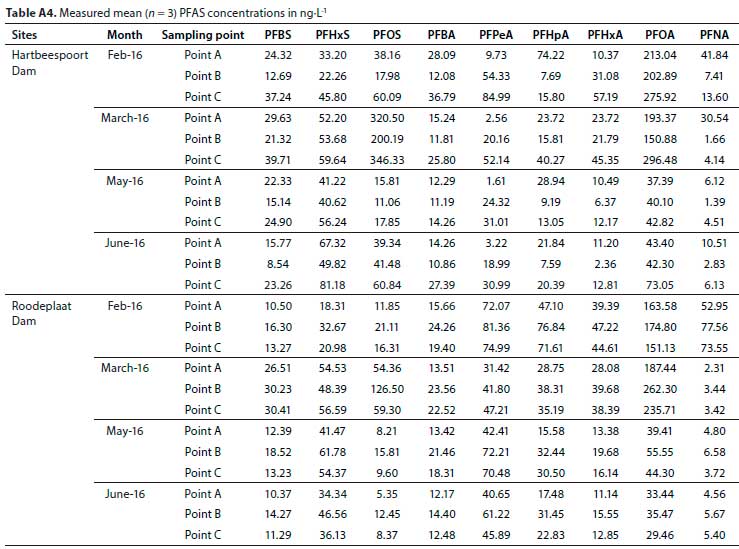
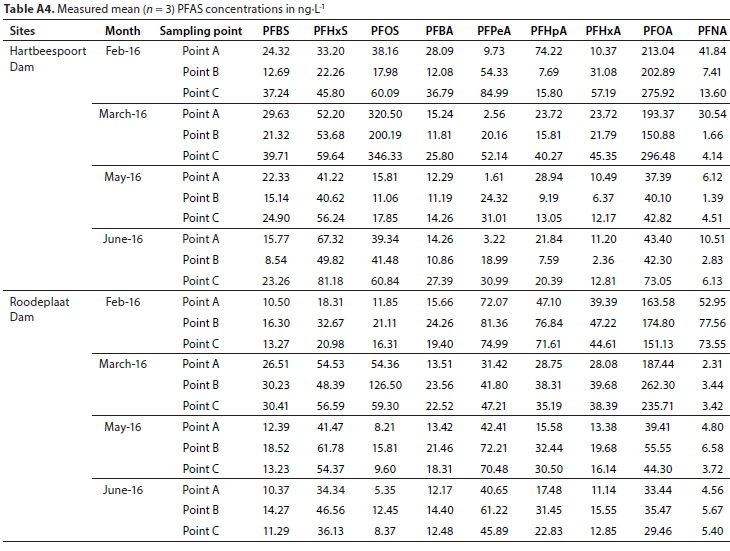
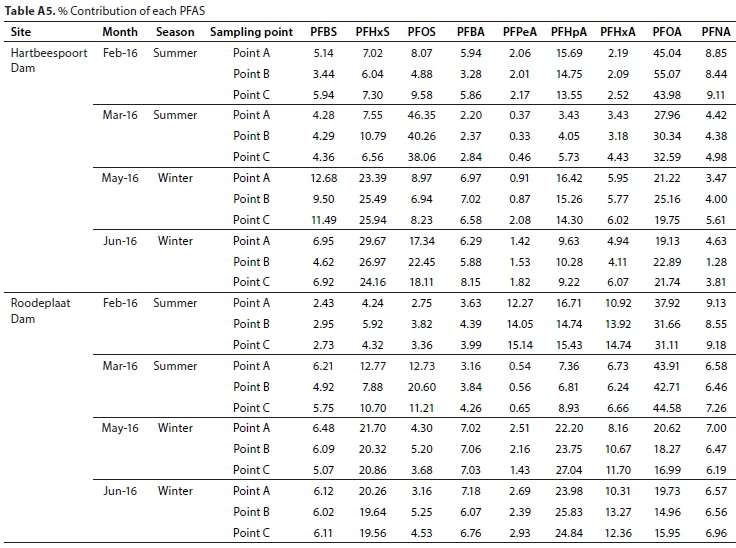
The mean concentrations and percentage (%) contribution of PFASs detected in Hartbeespoort and Roodeplaat Dams are represented in Table A4 (Appendix) and Figs 4 and 5, respectively. Of the 20 targeted PFASs, only 9 PFASs were detected (PFBA, PFHpA, PFPeA, PFHxA, PFOA, PFNA, PFBS, PFHxS, PFOS). In the Hartbeespoort Dam, the mean PFAS concentrations found were in the range of 1.38-346.32 ng-L-1 during the months of February, March, May and June 2016. At Sampling Point A (Table A4, Appendix), of Hartbeespoort Dam, the PFAS concentrations detected were higher in summer than in winter. In February and March, the highest compounds exhibited concentration ranges of 213.04 ng-L-1 (PFOA) and 320.50 ng-L-1 (PFOS), with contribution factors of 55.07% and 46.35%, respectively (Fig. 4; Table A5, Appendix). In May and June, PFHxS showed marginally higher concentrations 41.22 and 67.32 ng-L-1 than the other compounds, respectively. At Sampling Point B (Table A4, Appendix) the detected concentrations of PFASs were also higher in summer than in winter. In February and March, PFOA (202.90 ng-L-1) and PFOS (200.19 ng-L-1) exhibited the highest concentration detected. In May and June, PFHxS was detected at higher concentrations, with mean concentration of40.62 and 49.82 ng-L-1, respectively. PFHxS also contributed 25.94% and 29.67% in May and June, respectively (Fig. 4; Table A5, Appendix). At Sampling Point C (Table A4, Appendix), the PFASs detected were observed to be higher in summer than in winter. In February and March, PFOA (275.92 ng-L-1) and PFOS (346.33 ng-L-1) had the highest concentration detected. PFHxS showed higher concentrations in the winter with mean concentrations of 56.24 ng-L-1 in May and 81.18 ng-L-1 in June. The trends showed high concentrations of the PFASs in February, followed by March, and decreased from March to June at all sampling points. Sampling Point C showed the highest concentrations detected, followed by Point A and Point B. The same trend was observed in summer and winter. PFPeA showed the lowest concentrations detected at all the sampling points across all the months, except in June for Sampling Point B.
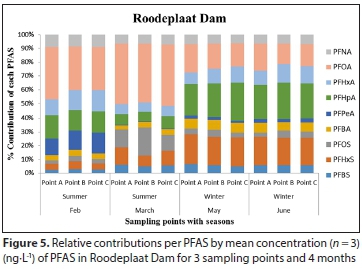
In the Roodeplaat Dam, the mean concentrations of PFASs detected were in the range of 2.31-262.29 ng L-1 (Table A4, Appendix). The results showed that PFOA was the compound detected at the highest concentrations in February and March for Sampling Points A (163.58 and 187.44 ng-L-1), B (174.80 ng-L-1 and 262.30 ng-L-1) and C (151.13 and 235.71 ng-L-1). PFOA contributed 31.11-43.91% to the total PFASs detected (Fig. 5; Table A5, Appendix). In May and June, PFHpA exhibited higher concentrations at all sampling points (25.83-72.21 ng-L-1), also contributing the most to the total PFASs detected (Fig. 5). The overall trend showed high PFAS concentrations in February and March at Points A, B, C and lower concentrations in May and June. However, in February, PFHxS was lower at Point A, while PFHpA and PFPeA were lower in March than in May and June. PFHxS was also lower in February and PFPeA lower in March at Point C. Sampling Point B in the Roodeplaat Dam had the highest levels of PFASs in all sampled months, followed by Point C and Point A in all sampled months. There were no significant differences (p < 0.05) recorded between the dams, sampling points or seasons for PFAS concentrations.
DISCUSSION
PFAS have been reported to be toxic and can cause adverse health effects in humans (Lau et al., 2007; IARC, 2017). Investigating the occurrence of these compounds is of importance as they have been detected in human serum (Hansen et al., 2001) and water resources (Martin et al., 2003). Drinking water has been reported as one of the major routes of exposure to humans (Stubleski et al., 2017; Ingelido et al., 2018; Daly et al., 2018). Since water treatment processes have been reported to be inefficient in removing PFASs from environmental waters (Saito et al., 2004; Skutlarek et al., 2006; Loos et al., 2007; Jin et al., 2009), it is important to investigate their occurrence in water resources to limit human exposure.
In the present study, it was observed that only PFASs with C < 9 were detected. This is in line with studies from other countries (Doug et al., 2015; Sharma et al., 2016; Lu et al., 2015; Groffen et al., 2018; Dalahmeh et al., 2018). The detection of shorter chain PFASs in surface water could be due to the potential of more hydrophobic long-chain PFASs to accumulate in sediment and aquatic biota (Zhou et al., 2016). Ahrens et al. (2009) found that longer chain PFASs bind more strongly to particles. Zhao et al. (2017) also reported that longer chain PFASs have a higher affinity for organic matter and particles, and can thereby be transported by suspended matter from the water surface to sediment.
There were no significant differences between the total average PFAS concentrations recorded in the two dams (p = 1.000, Table 1), with the Hartbeespoort Dam showing a higher average total PFAS concentration (4 867.43 ng-L-1) than the Roodeplaat Dam (4 386.19 ng L-1). From the results, Sampling Point A in the Hartbeespoort Dam showed the second highest PFAS concentrations after Point C. One-way ANOVA showed (p = 1, Table 1) that there were no significant differences from the other 6 sites sampled. Runoff from the farming and mining activities surrounding the dam may be the reason for the observed concentrations at this point. Mining and farming activities have been reported to be associated with PFAS pollution in other studies (Essamung et al., 2017; Sammut et al., 2017; Nascimento et al., 2018). Sampling Point B had the lowest concentrations of PFASs detected; the point is in the middle of the dam, therefore, the lower concentrations may have been due to dilution from movement of water from inflows sites to the middle of the dam. Sampling Point C showed the highest concentrations of PFASs detected compared to Points A and B. The high concentrations exhibited at Point C could have been due to the inflow from the Crocodile River into the dam and the dumping of waste on the banks of the dam. Over the years, thousands of informal dwellings have been erected near the river, giving rise to an extremely dense human population, with few communal water points, and chemical toilets on the peripheries of the settlement (Spotlight: Africa, 1999-2001). Therefore, levels of pollution from the river are usually high, which is evident in the high PFAS concentrations at Sampling Point C.
In Hartbeespoort Dam, PFOAs exhibited the highest concentrations in February at all the sampling points, with concentrations ranging from 202.89 to 275.92 ng-L-1 compared to < 84.99 ng-L-1 for other PFASs, though the difference was not statistically significant (p > 0.05, Table 1). PFOSs, with concentrations ranging from 200.19 to 346.33 ng-L-1 had the highest concentrations in March at all the points compared to < 296.48 ng-L-1 for other PFASs, though statistically not significant (p > 0.05, Table 1). The high PFOA and PFOS concentrations detected in Hartbeespoort Dam could be due to the industrial and domestic activities around the dam's catchment (Table A4, Appendix).
Since PFOS and PFOA have been phased out in some regions, low concentrations of these compounds would be expected. However, PFOS and PFOA were mostly phased out in the US, whereas production has increased in Asian countries, which has potentially offset the global reduction anticipated with the US phase-out (OECD, 2015). PFASs are not produced in South Africa; therefore, the presence of these chemicals in the environment is probably from imported PFAS-containing products. The degradation of PFAS precursors could also be a potential source of the detected concentrations of PFOS and PFOA. Kim et al. (2011); Yu et al. (2013); Wang et al. (2013); Lam et al. (2014) and Doung et al. (2015) reported high concentrations of PFOA and PFOS at sites located in industrial and highly populated areas. The present results showed that the concentrations of PFOA and PFOS from Hartbeespoort Dam were similar to the concentrations detected in Hanjiang River, Western Cape rivers (South Africa), and Pra and Kakum Rivers (Ghana) (Wang et al., 2013; Mudumbi et al., 2014; Essamung et al., 2017). However, the levels of PFOA and PFOS detected in Hartbeespoort Dam are higher than those reported by Yu et al. (2013) in a study conducted in Huai River, Korean rivers and lakes by Lam et al. (2014), Vietnam River by Doung et al. (2015), surface water in Kampala, Uganda, by Dalahmeh et al. (2018) and the Vaal River in South Africa by Groffen et al. (2018).
The differences between the sampling points in the Roodeplaat Dam were also not significant (p = 1.00, Table 1). In Roodeplaat Dam, Sampling Point A had the lowest concentrations of PFASs detected across the months. Since Point A is located near the dam wall, a dilution of the pollution levels entering the dam from the different rivers and sewage works may have occurred by the time the water moves towards the wall. Sampling Point B showed high PFAS concentrations (Fig. 5). The high concentrations could have originated from the two rivers (Hartbeesspruit and Pienaars), the catchments of which are located in highly populated and industrialized areas, resulting in more pollutants, including PFASs, flowing into the dam at this inflow point. Sampling Point C showed the second highest concentrations, after B, in all the months. This site is located in the inflow from the Edendalespruit, which mainly drains the agricultural area on the east side of the Roodeplaat dam catchment (Bosman and Kempster, 1985). As mentioned previously, some studies have noted the contribution of agricultural activities to the detection of PFASs (Sammut et al., 2017; Nascimento et al., 2018). This suggests that at Point B in the Roodeplaat Dam, PFAS concentrations may have been due to the agricultural activities around the Edendalespruit.
In the Roodeplaat Dam, PFOA was the dominant compound in February and March in all the sampling points with a high concentration range (151.13-262.30 ng-L-1) compared to concentrations of < 126.50 ng-L-1 for other PFASs, though the differences were statistically not significant (p > 0.05, Table 1). This could be due to the industrial, domestic and agricultural activities around the Roodeplaat Dam catchment. Mudumbi et al. (2014); Lu et al. (2015); Shao et al., (2016); Essumang et al. (2017); Chen et al. (2017) and Dalahmeh et al., (2018) also reported higher PFOA levels compared to ther PFASs compounds detected. The PFOA concentrations detected in the Roodeplaat Dam were higher than the ones reported in Shanghai (Lu et al., 2015); similar to those reported in South Africa, Ghana, and Uganda (Mudumbi et al., 2014; Essumang et al., 2017; Dalahmeh et al., 2018), but lower than those reported in Daling River, Bohai Sea (Shao et al., 2016; Chen et al., 2017). PFHpA showed slightly higher concentration levels compared to other compounds in the months of May and June 2016. The PFHpA concentrations may have been from the degradation of fluorotelomer alcohols (FTOHs), as mentioned by So et al. (2007) and Möller et al. (2010). Other studies have detected higher concentrations of shorter chain length compounds compared to the longer chain lengths (Yu et al., 2011; Lu et al., 2015; Sharma et al., 2016; Groffen et al., 2018). Studies by Sammut et al. (2017) and Groffen et al. (2018), conducted in the Maltese Islands and Vaal River, respectively, have reported lower concentrations of PFHpA than those detected in the Roodeplaat Dam.
Overall, PFOA was the compound detected at the highest levels, followed by PFOS in both dams. The frequent detection of PFOA in both dams and the highest concentration for PFOA detected being at Sampling Points B in both dams suggests that the dams may have a similar pollution source for this compound. Furthermore, PFOA and PFOS concentrations decreased in winter causing other short-chain PFASs such as PFHxS to be high. This suggests that temperature differences between summer and winter months may have caused the observed trend. Similarly, Mudumbi et al. (2014) detected higher PFOA and PFOS concentrations in rainy than dry seasons. Loewen et al. (2005) and Scott et al. (2006) detected high PFOA concentrations in rainwater samples from Canada and USA. Loewen et al. (2005) also hypothesized that fluorotelomer carboxylic acids (FTCAs) may dominate during high summer precipitation cycles.
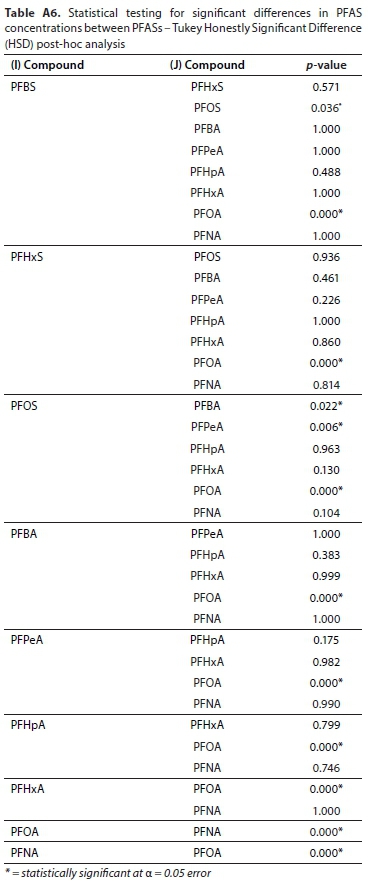
There were no significant differences (p = 1.00, Table 1) in seasonal PFAS concentrations for the summer and winter seasons sampled in both the Roodeplaat and Hartbeespoort Dams. However, there were statistically significant differences in concentrations of specific PFASs detected in both the Roodeplaat and Hartbeespoort Dam (p = 0.00, Table 1). The Tukey HSD (Table A6, Appendix) shows the 14 pairs of PFASs which have statistically significant differences in compound concentrations. Generally, higher PFAS concentrations were observed in summer than in winter. Although PFASs were expected to be lower in summer due to dilution with rainfall, this was not the case in the present study. Zhao et al. (2015) also detected higher PFAS concentrations in German rivers (Elbe and lower Weser) during summer than winter. This observation was due to prevailing precipitation and runoff in summer. Additionally, Pignotti et al. (2017) detected minor PFAS concentrations during winter. The observation in the present study can be described as follows: the high rainfall in summer months may enhance the leaching of PFASs from wastes dumped near riverbanks into the rivers that drain into the dams studied. On the other hand, the lower PFAS concentrations observed in winter may be due to low pollutant load from the rivers draining into the dams and sparse rainfall in winter months. Yu et al. (2009) reported that the presence of PFASs in rainwater affects their concentration in surface waters. In addition, runoff could also be a potential source of PFAS in rainy weather as rainfall may pick up atmospheric PFASs and transfer them from one point to another. This process can lead to non-point source pollution (NPS) by PFASs.
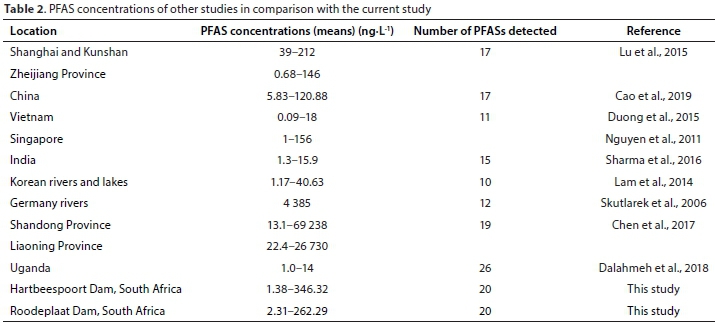
Table 2 shows a comparison of the concentrations of PFASs observed in the present study to other studies conducted in different parts of the world. The concentrations detected in this study are higher than the levels reported in Uganda, Singapore and Vietnam, but lower than the levels reported in Germany, Japan and China.
The recommended lifetime health advisory issued by the USEPA for drinking water in 2009 was 400 ng-L-1 PFOA and 200 ng-L-1 PFOS, but this was revised in 2016 as 70 ng-L-1 for PFOA and PFOS individually or combined (Cordner et al., 2019). Seven other states in the USA have developed their own water guideline levels for PFOA and/or PFOS, ranging from 13-1 000 ng-L-1 (Cordner et al., 2019). Currently, there are no limits set for these compounds in South Africa. However, in comparison with the USEPA limits, the PFOA and PFOS concentrations detected in the present study are higher than the recommended levels. Since drinking water treated from the dams was not part of the present study, the level of human exposure to PFASs through drinking water is still unknown. However, the concentrations detected in the present study are cause for concern as water treatment processes have been shown to be inefficient in removing PFASs from environmental waters. Therefore, there is a high probability that the treated water from the dams may contain PFASs. This is of concern as the communities consuming water from these dams may have been exposed, with concomitant adverse health effects. In addition, PFASs are bio-accumulative, thus there is a tendency for levels in exposed individuals to increase over time.
CONCLUSION
The present study confirmed the presence of PFASs compounds in Hartbeespoort and Roodeplaat Dams, South Africa. The total PFASs detected in the dams ranged from 1.38-346.32 ng-L-1 and 2.31-262.29 ng-L-1, respectively. Out of the 20 PFASs investigated, 9 PFASs were detected in both dams. PFOA, PFOS, PFHxS and PFHpA were the most predominant compounds. High PFAS concentrations were detected in water samples that passed through highly populated, industrial and agricultural areas and the inflows with the highest contribution to the dams showed the highest levels of PFASs as well. The PFASs concentration levels were higher in summer months and decreased in winter months. This indicated that rainfall and change in temperature between the seasons might have influenced the levels of PFASs detected. The concentrations of PFASs detected in the present study are higher than the levels reported in developing countries such as Uganda, Singapore and Vietnam, but lower than the levels reported in developed countries such as Germany, Japan and China. The PFOA and PFOS concentrations are also higher than the lifetime health advisory issued by the USEPA, raising the concern that communities consuming water from the dams are exposed to the compounds, which may result in adverse health effects. Since PFASs are not produced in South Africa, the possible main source ofthese compounds is most likely from use of PFASs-containing products. Since PFASs are persistent compounds, the concentrations obtained in the present study are of concern. Therefore, efforts should be geared towards (i) creating awareness on the possible consequences from exposure to PFAS-containing products and (ii) restricting the use of PFAS-containing products.
ACKNOWLEDGEMENTS
The authors would like to thank the Department of Water and Sanitation (RQIS) for allowing us use some of their resources, during sampling, storage and some laboratory work. In addition, the authors are grateful for the assistance given by Dr C Rimayi and Ms F Ngwandula from the Department of Water and Sanitation (RQIS) and their samplers for assisting with sampling. We are thankful to Mrs I Sibiya for her assistance during laboratory work.
REFERENCES
3M COMPANY (2005) A 28-day oral (gavage) toxicity study of T-7485 in Sprague-Dawley rats. Study no. 132-007, 3M Corporate Toxicology, St Paul, MN. P-00-1085. [ Links ]
ABBOTT J (2002) A method-based planning framework for informal settlement upgrading. Habitat Int. 26 (3) 317-333. https://doi.org/10.1016/S0197-3975(01)00050-9 [ Links ]
AHRENS L, GASHAW H, SJÖHOLM M, GEBREHIWOT SG, GETAHUN A, DERBE E, BISHOP K and ÃKERBLOM S (2016) Poly- and perfluoroalkylated substances (PFASs) in water, sediment and fish muscle tissue from Lake Tana, Ethiopia and implications for human exposure. Chemosphere. 165 352-357. https://doi.org/10.1016/j.chemosphere.2016.09.007 [ Links ]
BANZHAF S, FILIPOVIC M, LEWIS J, SPARRENBOM CJ and BARTHEL R (2017) A review of contamination of surface, ground, and drinking water in Sweden by perfluoroalkyl and polyfluoroalkyl substances (PFASs). Ambio. 46 335-346. https://doi.org/10.1007/s13280-016-0848-8 [ Links ]
BOOI X (2013) Perfluorinated compounds and trihalomethanes in drinking water sources of the Western Cape, South Africa. MSc thesis, Cape Peninsula University of Technology. [ Links ]
BOSMAN HH and KEMPSTER PL (1985) Precipitation chemistry in the Roodeplaat Dam catchment. Water SA. 11 (3) 157-164. [ Links ]
CAI MH, YANG HZ, XIE ZY, ZHAO Z, WANG F, LU ZB, STURM R and EBINGHAUS R (2012) Per- and polyfluoroalkyl substances in snow, lake, surface runoff water and coastal seawater in Fildes Peninsula, King George Island, Antarctica. J. Hazardous Mater. 209-210 335-342. https://doi.org/10.1016/j.jhazmat.2012.01.030 [ Links ]
CAMPBELL LA (1996) A study of storm water runoff from Alexandra Township in the Jukskei River. MSc dissertation, University of the Witwatersrand. [ Links ]
CAMPO J, PÉREZ F, MASIÁ A, PICÓ YM and FARRÉ BARCELÓ D (2015) Perfluoroalkyl substance contamination of the Llobregat River ecosystem (Mediterranean area, NE Spain). Sci. Total Environ. 503-504 48-57. https://doi.org/10.1016/j.scitotenv.2014.05.094 [ Links ]
CAO X, WANG C, LU Y, ZHANG M, KHAN K, SONG S, WANG P and WANG C (2019) Occurrence, sources and health risk of polyfluoroalkyl substances (PFASs) in soil, water and sediment from a drinking water source area. Ecotoxicol. Environ. Saf. 174 208-217. https://doi.org/10.1016/j.ecoenv.2019.02.058 [ Links ]
CHEN T, ZHANG L, YUE JQ, LV ZQ, XIA W, WAN YJ, LI YY and XU SQ (2012b) Prenatal PFOS exposure induces oxidative stress and apoptosis in the lung of rat off-spring. Reprod. Toxicol. 33 538-545. https://doi.org/10.1016/j.reprotox.2011.03.003 [ Links ]
CHEN H, WANG X, ZHANG C, SUN R, HAN J, HAN G, YANG W and HE X (2017) Occurrence and inputs of perfluoroalkyl substances (PFASs) from rivers and drain outlets to the Bohai Sea, China. Environ. Pollut. 221 234-243. https://doi.org/10.1016/j.envpol.2016.11.070 [ Links ]
CORDNER A, DE LA ROSA VY, SCHAIDER LA, RUDEL RA, RICHTER L and BROWN P (2019) Guideline levels for PFOA and PFOS in drinking water: the role of scientific uncertainty, risk assessment decisions, and social factors. J. Exposure Sci. Environ. Epidemiol. 29 157-171. https://doi.org/10.1038/s41370-018-0099-9 [ Links ]
DALAHMEH S, TIRGANI S, KOMAKECH AJ, NIWAGABA CB and AHRENS L (2018) Per- and polyfluoroalkyl substances (PFASs) in water, soil and plants in wetlands and agricultural areas in Kampala, Uganda. Sci. Total Environ. 631-632 660-667. https://doi.org/10.1016/j.scitotenv.2018.03.024 [ Links ]
DALY ER, CHANA BP, TALBOT EA, NASSIF, J, BEAN C, CAVALLOA SJ, METCALF E, SIMONEC K and WOOLF AD (2018) Per- and polyfluoroalkyl substance (PFAS) exposure assessment in a community exposed to contaminated drinking water, New Hampshire 2015. Int. J. Hyg. Environ. Health. 221 569-577. https://doi.org/10.1016/j.ijheh.2018.02.007 [ Links ]
DWAF (Department of Water Affairs and Forestry, South Africa) (2006). Status Quo Report, Hartbeespoort Strategic Environmental Assessment. Prepared by Tswelopele Environmental (Pty) Ltd. DWAF, Pretoria. [ Links ]
DWAF (Department of Water Affairs and Forestry, South Africa) (2008) Resource Management Plan (RMP) for Roodeplaat Dam, Project 2006304, Prepared by Vela VKE Consulting Engineers. DWAF, Pretoria. [ Links ]
DWS (Department of Water and Sanitation, South Africa) (2016a) National Eutrophication Monitoring Programme. Resource Quality Services, Department of Water and Sanitation. URL: http://intranet.dwa.gov.za/ (Accessed 12 May 2019). [ Links ]
DWS (Department of Water and Sanitation, South Africa) (2016b) Resource Management Plan-Hartbeespoort Dam, National Water Resource Infrastructure (NWRI). DWS, Pretoria. [ Links ]
DUONG HT, KADOKAMI K, SHIRASAKA H, HIDAKA R, CHAU HTC, KONG L, NGUYEN TQ and NGUYEN TT (2015) Occurrence of perfluoroalkyl acids in environmental waters in Vietnam. Chemosphere. 122 115-124. https://doi.org/10.1016/jxhemosphere.2014.11.023 [ Links ]
ESSUMANG DK, ESHUN A, HOGARH JN, BENTUM JK, ADJEI JK, NEGISHI J, NAKAMICHI S, HABIBULLAH-AL-MAMUN M and MASUNAGA S (2017) Perfluoroalkyl acids (PFAAs) in the Pra and Kakum River basins and associated tap water in Ghana. Sci. Total Environ. 579 729-735. https://doi.org/10.1016/j.scitotenv.2016.11.035 [ Links ]
GIESY J and KANNAN K (2001) Global distribution of perfluoroctane sulfonate in wildlife. Environ. Sci. Technol. 35 1339-1342. https://doi.org/10.1021/es001834k [ Links ]
GROFFEN T, WEPENER V, MALHERBE W and BERVOETS L (2018) Distribution of perfluorinated compounds (PFASs) in the aquatic environment of the industrially polluted Vaal River, South Africa. Sci. Total Environ. 627 1334-1344. https://doi.org/10.1016/j.scitotenv.2018.02.023 [ Links ]
HANSEN KJ, CLEMEN LA, ELLEFSON ME and JOHNSON HO (2001) Compound-specific, quantitative characterization of organic fluorochemicals in biological matrices. Environ. Sci. Technol. 35 766-770. https://doi.org/10.1021/es001489z [ Links ]
IARC (International Agency for Research on Cancer) (2017) Agents classified by the IARC Monographs, Volumes 1-117. International Agency for Research on Cancer, Lyon. URL: http://monographs.iarc.fr/ENG/Classification/List_of_Classifications.pdf (Accessed 28 February 2017). [ Links ]
INGELIDO AM., ABBALLE A, GEMMA S, DELLATTE E, IACOVELLA N, DE ANGELIS G, ZAMPAGLIONI F, MARRA V, MINIERO R, VALENTINI S, RUSSO F, VAZZOLER M, TESTAI E and DE FELIP E (2018) Biomonitoring of perfluorinated compounds in adults exposed to contaminated drinking water in the Veneto Region, Italy. Environ. Int. 110 149-159. https://doi.org/10.1016/j.envint.2017.10.026 [ Links ]
JIN YH, LIU W, SATO I, NAKAYAMA SF, SASAKI K, SAITO N and TSUDA S (2009) PFOS and PFOA in environmental and tap water in China. Chemosphere. 77 605-611. https://doi.org/10.1016/jxhemosphere.2009.08.058 [ Links ]
KIM SK, KHO YL, SHOEIB M, KIM KS, KIM KR, PARK JE and SHIN YS (2011) Occurrence of perfluorooctanoate and perfluorooctanesulfonate in the Korean water system: implication to water intake exposure. Environ. Pollut. 159 1167-1173. https://doi.org/10.1016/j.envpol.2011.02.004 [ Links ]
LABADIE P and CHEVREUIL M (2011) Partitioning behaviour of perfluorinated alkyl contaminants between water, sediment and fish in the Orge River (nearby Paris, France). Environ. Pollut. 159 1452-1453. https://doi.org/10.1016/j.envpol.2011.01.021 [ Links ]
LAM NH, CHO CR, LEE JS, SOH HY, LEE BC, LEE JA, TATAROZAKO N, SASAKI K, SAITOE N, IWABUCHI K, KANNAN K and CHO HS (2014) Perfluorinated alkyl substances in water, sediment, plankton and fish from Korean rivers and lakes: a nationwide survey. Sci. Total Environ. 491-492 154-162. https://doi.org/10.1016/j.scitotenv.2014.01.045 [ Links ]
LAU C, ANITOLE K, HODES C, LAI D, PFAHLES-HUTCHENS A and SEED J (2007) Perfluoroalkyl acids: A review of monitoring and toxicological findings. Toxicol. Sci. 99 366-394. https://doi.org/10.1093/toxsci/kfm128 [ Links ]
LAU C, THIBODEAUX JR, HANSON RG, ROGERS JM, GREY BE, STANTON ME, BUTENHOFF JL and STEVENSON LA (2003) Exposure to perfluorooctane sulfonate during pregnancy in rat and mouse. II. Postnatal evaluation. Toxicol. Sci. 74 382-392. https://doi.org/10.1093/toxsci/kfg122 [ Links ]
LIEDER PH, CHANG S, EHRESMAN DJ, ROY RR, OTTERDIJK F and BUTENHOFF JL (2007) Twenty-eight-day oral toxicity study of perfluorobutyrate in rats. Toxicologist. 96 193. [ Links ]
LEIN NP, FUJII S, TANAKA S, NOZOE M and TANAKA H (2008) Contamination of perfluorooctane sulfonate (PFOS) and perfluorooctanoate (PFOA) in surface water of the Yodo River basin (Japan). Desalination. 226 338-347. https://doi.org/10.1016/j.desal.2007.01.247 [ Links ]
LEHMLER HJ (2005) Synthesis of environmentally relevant fluorinated surfactants - A review. Chemosphere. 58 1471-1496. https://doi.org/10.1016/j.chemosphere.2004.11.078 [ Links ]
LHWA (2005) Notice of contamination. Little Hocking's current activities. URL: http://www.littlehockingwater.org/ (Accessed 23 March 2019). [ Links ]
LOEWEN M, HALLDORSON T, WAND F and TOMY G (2005) Fluorotelomer carboxylic acids and PFOS in rainwater from an urban center in Canada. Environ. Sci. Technol. 39 2944-2951. https://doi.org/10.1021/es048635b [ Links ]
LOOS R, WOLLGAST J, HUBER T and HANKE G (2007) Polar herbicides, pharmaceutical products, perfluorooctanesulfonate (PFOS), perfluorooctanoate (PFOA), and nonylphenol and its carboxylates and ethoxylates in surface and tap waters around Lake Maggiore in Northern Italy. Anal. Bioanal. Chem. 387 1469-1478. https://doi.org/10.1007/s00216-006-1036-7 [ Links ]
LU Z, SONG L, ZHAO Z, MA Y, WANG J, YANG H, MA H, CAI M, CODLING G, EBINGHAUS R, XIE Z and GIESY JP (2015) Occurrence and trends in concentrations of perfluoroalkyl substances (PFASs) in surface waters of eastern China. Chemosphere. 119 820-827. https://doi.org/10.1016/j.chemosphere.2014.08.045 [ Links ]
MARTIN JW, MABURY SA, SOLOMON KR and MUIR DCG (2003) Bioconcentration and tissue distribution of perfluorinated acids in rainbow trout (Oncorhynchus mykiss). Environ. Toxicol. Chem. 22 196-204. https://doi.org/10.1002/etc.5620220126 [ Links ]
MÖLLER A, AHRENS L, STURM R, WESTERVELD J, VAN DER WIELEN F, EBINGHAUS R and DE VOOGT P (2010) Distribution and sources of polyfluoroalkyl substances (PFAS) in the River Rhine watershed. Environ. Sci. Pollut. Res. 158 3243-3250. https://doi.org/10.1016/j.envpol.2010.07.019 [ Links ]
MUDUMBI JBN, NTWAMPE SKO, MUGANZA FM and OKONKWO JO (2014) Perfluorooctanoate and perfluorooctane sulfonate in South African river water. Water Sci. Technol. 69 (1) 185-194. https://doi.org/10.2166/wst.2013.566 [ Links ]
NAILE JE, KHIM JS, WANG T, CHEN C, LUO W, KWON BO, PARK J, KOH CH, JONES P, LU Y and GIESY JP (2010) Perfluorinated compounds in water, sediment, soil and biota from estuarine and coastal areas of Korea. Environ. Pollut. 158 1237-1244. https://doi.org/10.1016/j.envpol.2010.01.023 [ Links ]
NASCIMENTO RA, NUNO DBO, BIZKARGUENAGA E, SCHULTES L, ZABALETA I, BENSKIN JP, SPANÓ S and LEONEL J (2018) Sulfluramid use in Brazilian agriculture: A source of per- and polyfluoroalkyl substances (PFASs) to the environment. Environ. Pollut. 242 1436-1443. https://doi.org/10.1016/j.envpol.2018.07.122 [ Links ]
NGUYEN VT, REINHARD M and KARINA GYH (2011) Occurrence and source characterization of perfluorochemicals in an urban watershed. Chemosphere. 82 1277-1285. https://doi.org/10.1016/j.chemosphere.2010.12.030 [ Links ]
PIETERSE AJH and RÖHRBECK MA (1990) Dominant phytoplankters and environmental variables in the Roodeplaat Dam, Pretoria, South Africa. Water SA. 16 (4) 211-218. [ Links ]
PREVEDOUROS K, COUSINS IT, BUCK RC and KORZENIOWSKI SH (2006) Sources, fate and transport of perfluorocarboxylates. Environ. Sci. Technol. 40 32-44. https://doi.org/10.1021/es0512475 [ Links ]
QAZI MR, NELSON BD, DEPIERRE JW and ABEDI-VALUGERDI M (2012) High-dose dietary exposure of mice to perfluorooctanoate or perfluorooctane sulfonate exerts toxic effects on myeloid and B-lymphoid cells in the bone marrow and these effects are partially dependent on reduced food consumption. Food Chem. Toxicol. 50 (9) 2955-2963. https://doi.org/10.1016/j.fct.2012.06.023 [ Links ]
SAITO N, HARADA K, INOUE, K, SASAKI, K, YOSHINAGA T and KOIZUMI A (2004) Perfluorooctanoate and perfluorooctane sulfonate concentrations in surface water in Japan. J. Occup. Health. 46 49-59. https://doi.org/10.1539/joh.46.49 [ Links ]
SAMMUT G, SINAGRA E, HELMUS R and DE VOOGT P (2017) Perfluoroalkyl substances in the Maltese environment - (I) surface water and rain water. Sci. Total Environ. 589 182-190. https://doi.org/10.1016/j.scitotenv.2017.02.128 [ Links ]
SCOTT BF, SPENCER C, MABURY SA and MUIR DCG (2006) Poly and perfluorinated carboxylates in North American precipitation. Environ. Sci. Technol. 40 (23) 7167-7174. https://doi.org/10.1021/es061403n [ Links ]
STEENLAND K, TINKER S, SHANKAR A and DUCATMAN A (2010) Association of perfluorooctanoic acid (PFOA) and perfluorooctane sulfonate (PFOS) with uric acid among adults with elevated community exposure to PFOA. Environ. Health Perspect. 118 229-233. https://doi.org/10.1289/ehp.0900940 [ Links ]
SINCLAIR E and KANNAN K (2006) Mass loading and fate of perfluoroalkyl surfactants in wastewater treatment plants. Environ. Sci. Technol. 40 (5) 1408-1414. https://doi.org/10.1021/es051798v [ Links ]
SPOTLIGHT: AFRICA (1999-2001) Upgrading urban communities- A resource framework. URL: http://web.mit.edu/urbanupgrading/upgrading/case-examples/overview-africa/alexandra-township.html (Accessed 25 November 2019). [ Links ]
STUBLESKI J, SALIHOVIC S, LIND PM., LIND L, DUNDER L, MCCLEAF P, EUREN K, AHRENS L, SVARTENGREN M, VAN BAVEL B and KÄRRMANA A (2017) The effect of drinking water contaminated with perfluoroalkyl substances on a 10-year longitudinal trend of plasma levels in an elderly Uppsala cohort. Environ. Res. 159 95-102. https://doi.org/10.1016/j.envres.2017.07.050 [ Links ]
SHAO M, DING G, ZHANG J, WEI L, XUE H, ZHANG N, LI Y, CHEN G and SUN Y (2016) Occurrence and distribution of perfluoroalkyl substances (PFASs) in surface water and bottom water of the Shuangtaizi Estuary, China. Environ. Pollut. 216 675-681. https://doi.org/10.1016/j.envpol.2016.06.031 [ Links ]
SHARMA BM, BHARAT GK, TAYAL S, LARSSEN T, BECANOV J, KARASKOV P, WHITEHEAD PG, FUTTER MN, BUTTERFIELD D and NIZZETTO L (2016) Perfluoroalkyl substances (PFAS) in river and ground/drinking water of the Ganges River basin: Emissions and implications for human exposure. Environ. Pollut. 208 704-713. https://doi.org/10.1016/j.envpol.2015.10.050 [ Links ]
SKUTLAREK D, EXNER M and FARBER H (2006) Perfluorinated surfactants in surface and drinking waters. Environ. Sci. Pollut. Res. 13 (5) 299-307. https://doi.org/10.1065/espr2006.07.326 [ Links ]
SO MK, MIYAKE Y, YEUNG WY, HO YM, TANIYASU S, ROSTKOWSKI P, YAMASHITA N, ZHOU BS, SHI XJ, WANG JX, GIESY JP, YU H and LAM PKS (2007) Perfluorinated compounds in the Pearl River and Yangtze River of China. Chemosphere. 68 2085-2095. https://doi.org/10.1016/jxhemosphere.2007.02.008 [ Links ]
TANIYASU S, KANNAN K, WU Q, KWOK KY, YEUNG LWY, LAM PKS, CHITTIME B, KIDA T, TAKASUGA T, TSUCHIYA Y and YAMASHITA N (2013) Inter-laboratory trials for analysis of perfluorooctanesulfonate and perfluorooctanoatein water samples: performance and recommendations. Anal. Chim. Acta. 770 111-120. https://doi.org/10.1016/j.aca.2013.01.056 [ Links ]
OECD (2015) Working towards a global emission inventory of PFASs: Focus on PFCAs - status quo and the way forward. OECD, Paris. [ Links ]
USEPA (United States Environmental Protection Agency) (2001) Analysis of PFOS, FOSA, and PFOA from various food matrices using HPLC electrospray/mass spectrometry. 3M Study Conducted by Centre Analytical Laboratories. United States Environmental Protection Agency, Washington DC. [ Links ]
USEPA (United States Environmental Protection Agency) (2016a) Drinking water health advisory for perfluorooctanoic acid (PFOA). United States Environmental Protection Agency, Washington DC. https://www.epa.gov/sites/production/files/2016-05/documents/pfoa_health_advisory_final-plain.pdf (Accessed 3 March 2017). [ Links ]
USEPA (United States Environmental Protection Agency) (2016b) Drinking water health advisory for perfluorooctane sulfonate (PFOS). United States Environmental Protection Agency. https://www.epa.gov/sites/production/files/2016-05/documents/pfos_health_advisory_final-plain.pdf (Accessed 3 March 2017). [ Links ]
VIERKER L, STAUDE C, BIEGEL-ENGLER A, DROST W and SCHULTE C (2012) Perfluorooctanoic (PFOA) - main concerns and regulatory developments in Europe from an environmental point of view. Environ. Sci. Eur. 24 16. https://doi.org/10.1186/2190-4715-24-16 [ Links ]
WANG B, CAO M, ZHU H, CHEN J, WANG L, LIU G, GU X and LU X (2013) Distribution of perfluorinated compounds in surface water from Hanjiang River in Wuhan, China. Chemosphere. 93 468-473. https://doi.org/10.1016/jxhemosphere.2013.06.014 [ Links ]
WHITE SS, CALAFAT AM, KUKLENYIK Z, VILLANUEVA L, ZEHR RD, HELFANT L, STRYNAR MJ, LINDSTROM AB, THIBODEAUX JR and WOOD C (2007) Gestational PFOA exposure of mice is associated with altered mammary gland development in dams and female offspring. Toxicol. Sci. 96 133-144. https://doi.org/10.1093/toxsci/kfl177 [ Links ]
XIA W, WAN Y, LI YY, ZENG H, LV Z, LI G, WEI Z and XU SQ (2011) PFOS prenatal exposure induce mitochondrial injury and gene expression change in hearts of weaned Sprague Dawley rats. Toxicology. 282 (1-2) 23-29. https://doi.org/10.1016/j.tox.2011.01.011 [ Links ]
YANG L, ZHU L and LIU Z (2011) Occurrence and partition of perfluorinated compounds in water and sediment from Liao River and Taihu Lake, China. Chemosphere. 83 806-814. https://doi.org/10.1016/j.chemosphere.2011.02.075 [ Links ]
YU N, SHI W, ZHANG B, SU G, FENG J, ZHANG X, WEI S and YU H (2013) Occurrence of perfluoroalkyl acids including perfluorooctane sulfonate isomers in Huai River Basin and Taihu Lake in Jiangsu Province, China. Environ. Sci. Technol. 47 710-717. https://doi.org/10.1021/es3037803 [ Links ]
ZHAO S and ZHU L (2017) Uptake and metabolism of10:2 fluorotelomer alcohol in soil earthworm (Eisenia fetida) and soil-wheat (Triticum aestivum L.) systems. Environ. Pollut. 220 124-131. https://doi.org/10.1016/j.envpol.2016.09.030 [ Links ]
 Correspondence:
OJ Okonkwo
Email: OkonkwoOJ@tut.ac.za
Received: 21 January 2020
Accepted: 14 January 2021
APPENDIX

