


Services on Demand
Article
 English (pdf)
 Article in xml format
 Article references
Indicators

Related links
-
 Cited by Google
 -
 Similars in Google
Share

 Permalink
Water SA
On-line version ISSN 1816-7950
Print version ISSN 0378-4738
Water SA vol.47 n.1 Pretoria Jan. 2021
http://dx.doi.org/10.17159/wsa/2021.v47.i1.9442
RESEARCH PAPER
Economic valuation of the averted degradation of the Vyeboom Wetland in the Theewaterskloof Dam catchment, South Africa
Daniel MaraisI; Theo FischerII; Donovan KotzeIII; Bennie HaasbroekII; Malin GovenderII; James PuginII; Annabel HornIV
IPrevision, Postnet 225, Private Bag X17, Weltevreden Park 1715, Johannesburg, South Africa
IIEScience Associates (Pty) Ltd, PO Box2950, Saxonwold2132, Johannesburg, South Africa
IIICentre for Water Resources Research, University of KwaZulu-Natal, Durban, South Africa
IVDepartment of Environmental Affairs and Development Planning, Western Cape Government, Cape Town, South Africa
ABSTRACT
Wetlands within the catchments of water supply dams have potential to make important contributions to water-related ecosystem services, particularly water quality enhancement. Wetlands are facing growing threats and continuing degradation. There have been limited attempts at evaluating the contribution of South African wetlands, and their rehabilitation, for water quality enhancement and other water-related ecosystem services. A comprehensive and integrated wetland services economic assessment determined the value of the Vyeboom Wetland in the catchment of the Theewaterskloof Dam. The water of this dam is a significant contributor to the City of Cape Town's water supply. The economic valuation model integrates hydrological, catchment status and economic models, with a long-term (80-year monthly) wetland water balance from a calibrated hydrological model as a driver for the nutrient removal aspect. The economic valuation builds on a water quality enhancement model, based on the minimisation of indirect use replacement cost principle, supplemented by a sediment retention and carbon storage assessment. The capability of the economic valuation model is illustrated by assessing the rehabilitation of a 25-ha area in the Vyeboom Wetland, which is currently intact, but is under threat of being severely degraded by the advancing erosion headcut. It was assumed that the current state of the Vyeboom Wetland is almost pristine (only 1 ha degraded), but that a further 24 ha would degrade over a period of 50 years, following spatial changes over time. By balancing the total investment in offsetting the potential loss in benefits, it is evident that an amount of 2.5 million ZAR could be afforded for rehabilitation. If, instead of a logistic degradation profile, the wetland is assumed to already be in a state of accelerated deterioration, the rehabilitation project budget for Vyeboom Wetland will increase once the other intrinsic benefits described are considered in the analysis.
Keywords: ecosystem services, wetland rehabilitation, water quality, valuation, Breede Catchment
INTRODUCTION
Wetland ecosystems are vital ecological infrastructures that provide valuable services to people and are also important biodiversity assets. Wetlands that fall within the catchments of water supply dams specifically have the potential to make important contributions in terms of water-related ecosystem services, particularly water quality enhancement. While resilient in many ways, wetlands are vulnerable to a range of direct, indirect and cumulative impacts (Kotze et al., 2012) and in South Africa wetlands are recognized as one of the most threatened ecosystem types (Nel et al., 2011).
Thus, there is a growing need for the rehabilitation of wetlands which have been degraded, but perhaps even more importantly, for arresting the degradation of wetlands which are currently in the process of degrading. However, there have been limited attempts at valuing the contribution of South African wetlands and their rehabilitation in terms of water quality enhancement and other water-related ecosystem services. The valuing of wetland rehabilitation, specifically designed to arrest the process of degradation, presents challenges, and, to the authors' knowledge, no such valuing of water quality enhancement services has been undertaken in South Africa, although it has been done to a limited extent internationally.
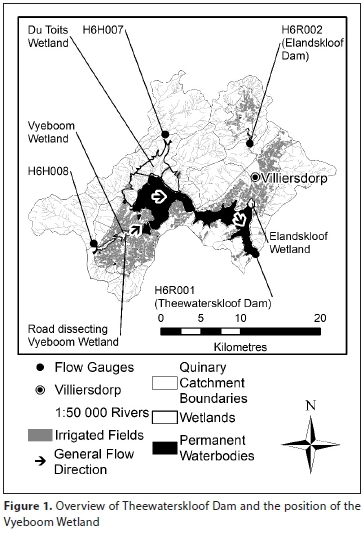
Some of the wetlands in the Upper Breede River Catchment that feed into the Theewaterskloof Dam (Fig. 1) are under threat, predominantly from agriculture, invasive alien plants, erosion and pollutants from agriculture and urban settlements. The Vyeboom Wetland in the Theewaterskloof Catchment was identified as a priority for rehabilitation due to active erosional degradation, which it currently experiences, and the potential for considerable further degradation in the absence of any interventions to arrest this degradation.
The Theewaterskloof Dam is an important source of water for the Western Cape, particularly Cape Town, and as such it is important to establish the value of the wetlands through which water drains into this dam. An economic valuation was done on three individual wetlands in the dam's catchment area, one of which (Vyeboom Wetland) will be highlighted here to illustrate the valuation process.
Study site description
The Vyeboom Wetland is situated in the Theewaterskloof Dam catchment. The Theewaterskloof Dam is one of the main bulk water supply dams for the City of Cape Town and is situated near the town of Villiersdorp. Figure 1 provides an overview of the Theewaterskloof Dam catchment and the position of the Vyeboom and other wetlands surrounding the dam.
The study area consists of three quaternary catchment areas that feed into the Theewaterskloof Dam, namely H60A, B and C. The Theewaterskloof Dam catchment consists of an enclosed valley with mountainous borders which surround approximately 80% of the catchment area.
Steep hills surround flat valley areas, on which extensive irrigated agriculture, farm dams, and the larger reservoirs can be found. Altitudes vary from 1 500 m amsl in the west to 320 m amsl at the Theewaterskloof Dam wall in the south east. The mean annual precipitation (MAP) for the quinary catchments within the three quaternary catchments varies from 540 to above 2 300 mm-yr-1 in the mountainous regions (Bailey and Pitman, 2015). The significant differences in rainfall throughout the dam catchment influence the net irrigation and wetland water requirements in different parts of the catchment.
Approximately 80% of the total surface runoff generated in the Theewaterskloof Dam catchment first flows through the Vyeboom and the other large valley-bottom Palmiet wetlands before reaching the dam. The Theewaterskloof Dam supplies approximately 36% of the Western Cape Water Supply System (WCWSS) historical firm yield (DWA, 2012), and this study shows that the wetlands in the three quaternary catchments filter approximately 28% of the entire WCWSS yield.
The current conditions of the three major wetlands, namely, Du Toits, Vyeboom and Elandskloof, have been assessed in this study to range from nearly natural, to intermediate, to badly degraded, respectively. The Vyeboom Wetland has been reduced in size by approximately 25% due to encroaching orchards. It also has water quality pressures due to agricultural return flows that influence the lateral inflows into the wetland.
The Riviersonderend River provides the water flow which feeds into the Vyeboom Wetland and it has the highest unit runoff of all the areas that feed the Theewaterskloof Dam catchment. The Riviersonderend channel's catchment originates from an area adjacent to the Berg River Dam's catchment, which has some of the highest per-unit-area runoff in South Africa. The water flow rate into the Vyeboom Wetland is high, considering the estimated volume of the wetland. This means that it is often inundated during wet winter months, while the water recedes to the main channels in drier summer months.
Wetland classification and performance
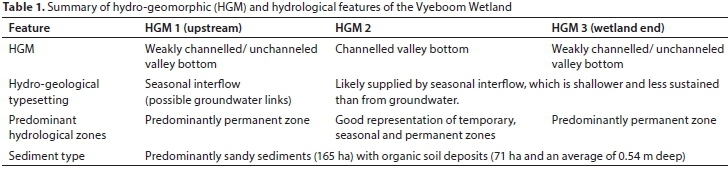
The Vyeboom Wetland is a valley bottom Palmiet wetland comprising three hydro-geomorphic units (Table 1) within a Table Mountain Group sandstone setting.
Several of the plant species in the Vyeboom Wetland are alien species, and approximately 20% aerial cover of the wetland is of the alien tree Acacia mearnsii. However, characteristic native species such as Prionum serratum (Palmiet), Pennisetum macrourum, Platycaulos major and Leucadendron salicifolium still dominate most of the wetland.
In terms of the type and level of anthropogenic factors influencing the Vyeboom Wetland, the impact can be expressed as intermediate in terms of severity. Flooding of the wetland by the Theewaterskloof Dam is confined to the lowermost toe of HGM 3 but appears to be the principal factor precipitating from several very active erosion headcuts in this section of the wetland. These erosion headcuts have advanced 390 m in 14 years based on a comparison of the 2004 and 2018 Google Earth images. Without any intervention, it is likely to erode to at least the mid-portion of the wetland. A single moderately active erosion headcut is also observed in HGM1 due to the destabilizing effects of the abundant wattle trees growing in the predominant water flow area here.
The Vyeboom Wetland is also impacted by irrigation activities upstream and alongside the wetland. This is especially true for irrigation return flows that have increased water quality issues, especially in the dry seasons. Extensive orchards in the slopes immediately adjacent to the wetland are likely to have contributed to increased nutrients and biocides, and approximately one-third of the wetland has already been converted to orchards.
In terms of rehabilitation of the existing wetland areas, a few key rehabilitation objectives were identified for Vyeboom Wetland based on the impacts and threats it is facing.
These objectives included:
• Remove invasive alien trees
• Promote robust herbaceous vegetation in the channel bed and banks
• Reduce channel incision and promote the accumulation of sediment in the channel
• Halt the advance of headcut erosion threatening to alter diffuse flow portions ofthe wetland into strongly channelled portions
There will be great functional attribute enhancements with the rehabilitation of the Vyeboom Wetland, compared with the wetland in the absence of rehabilitation.
The most important contribution of rehabilitation to avert degradation at Vyeboom Wetland is in diffuse flow occupying 20% more of the overall wetland area of the total Vyeboom Wetland and strongly channelled areas being correspondingly less prominent with rehabilitation than without. By contributing to water flows which are much more spread out in the wetland, rehabilitation, therefore, contributes greatly to increasing the contact between the water column and wetland sediments and vegetation of the Vyeboom Wetland, thereby significantly increasing the capacity of the wetland to assimilate nutrients and pollutants. The overall size of the natural/semi-natural area of Vyeboom Wetland is 235 ha, of which a total area of 47 ha is under threat of erosion. Of the 47-ha area, 22 ha is located in HGM 1 and 25 ha in HGM 3. In terms of modelling the effect of the rehabilitation on the assimilation of nutrients/pollutants, the focus was on the 25-ha area as it is under much higher threat of degradation than the 22-ha area, based especially on the erosion headcut threatening HGM 3 being much more active than that threatening HGM 1 (Appendix 1). Currently the 25-ha area is dominated by diffuse low flows, extensive permanent soil saturation and high levels of soil organic matter present in a rehabilitation scenario. If degradation occurs this will be replaced with 25 ha of concentrated flow and predominantly temporary soil saturation, resulting in much lower levels of contact between streamflow and wetland sediment and vegetation.
A total of 25 ha of the Vyeboom Wetland which supports organic soil is under high threat from the actively advancing headcuts and associated erosion gullies. In the absence of any rehabilitation interventions, it is likely that these erosion gullies will advance through these areas and have a strong draining effect on the organic soil material which they contain. For the purposes of the model it was assumed that, in the absence of rehabilitation, 63% (which is a number halfway between minimum and maximum estimates of soil organic carbon) of this carbon store will severely desiccate, decompose and be released into the atmosphere. The range of potential carbon loss reflects the uncertainty associated with influencing factors, e.g., the possible occurrence of ground fires, as elaborated upon in Appendix 2, and for the purposes of the assessment a value in the middle of the likely range was taken.
The lower gullies of the Vyeboom Wetland currently feed directly into the Theewaterskloof Dam, and therefore all the sediment eroded from these gullies is deposited in the dam. Although the eroding channel below the road crossing, which is between the upper 22 ha and lower 25 ha of the 47 ha, is currently not connected by a clearly defined channel to the outflow, at the current rate of advance of the main lower gully, this is likely to take place, resulting in sediment eroding from this channel being readily transported into the Theewaterskloof Dam. In contrast, transported sediment eroded from the upper erosion gully then flows through a weakly channelled portion of the wetland (not threatened by gully erosion), before entering a well-defined channel, carrying it directly into the Theewaterskloof.
For the purposes of the economic assessment, it is assumed that half of the sediment lost from the upper gully would be deposited in this weakly channelled area rather than being carried down into the Theewaterskloof Dam. This assumption is based on the likely trapping of sediment anticipated in the weakly channelled area, where stormflows are spread diffusely across densely vegetated areas, but all of the sediment is unlikely to be trapped due to the existence of some preferential flow areas amongst the vegetation rather than flow being entirely diffuse.
Long-term water balance
The main contribution of the hydrology of the system to the economic valuation is in the determination of the fluctuation of water quantity exposed to vegetation as it circulates through the wetland. This exposure ofwater to the wetland vegetation facilitates nutrient uptake, sediment trapping and other beneficial functions of the wetland. Due to the high seasonality and variation of flows through the main channel and from lateral inflows to the wetland, a long-term water balance was simulated under 'historical' and 'present-day' development scenarios for the Vyeboom and other wetlands in the catchment area. A long-term simulation has the advantage that it provides a distribution of possible historic water level fluctuations and water circulation volumes through the wetlands. The distribution of water volume provides a more representative picture of potential nutrient uptake.
A wetland water balance includes elements such as the total main channel and lateral inflows, total outflows, rainfall, evapotranspiration, internal water circulation (from the main channel to the wetland area and vice versa), and surface-groundwater interactions. To determine the water balance, a hydrological rainfall-runoff model is used, which estimates surface and groundwater flows from historical rainfall patterns in a river catchment area. With the rainfall-runoff model, relatively short periods of measured streamflow data at flow gauging stations and large reservoirs can be extended using long-term point rainfall data in the catchment. Using the rainfall-runoff model also allows for estimating long-term flows at a multitude of points, such as wetland inflows.
Economic valuation
A rehabilitation plan for the Vyeboom Wetland, with costing for all of the interventions, was proposed by Snaddon et al. (2018). This acted as a guide for setting up a very specific ensemble of interventions that would address a specific 25-ha area in the Vyeboom Wetland, located between the active erosion headcut and road crossing, that is expected to degrade significantly over the next 50 years. The proposed rehabilitation project was estimated by Working for Wetlands to cost about 4.4 million ZAR. This specific scenario was used to compare the results obtained from the economic valuation method of this study which is propounded in this paper.
METHODOLOGY
Overview
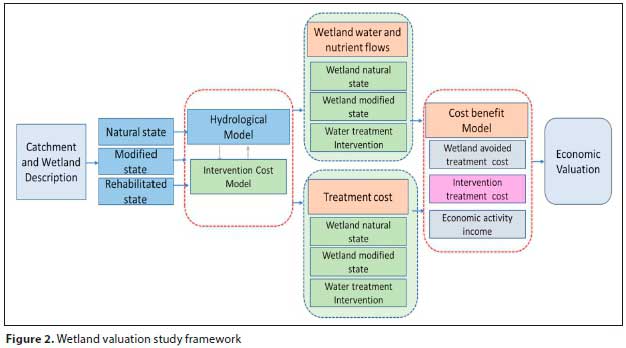
The essence of the wetland valuation process is captured in the framework depicted in Fig. 2.
In order to establish the necessary perspective for the valuation of a wetland a brief introduction of the catchment feeding into the wetland is provided, highlighting the relation to the wetland and the surrounding geomorphic structures.
This is followed by a detailed description of the wetland functioning and performance in terms of the current status and expected future degradation or rehabilitation scenarios.
Using the wetland description and catchment data, the hydrological functioning of the wetland is described in terms of the long-term internal water balances of the wetland as simulated by a calibrated rainfall-runoff model. The economic valuation can then be determined from wetland scenario descriptions, water balances and basic assumptions on nutrient uptake rates.
The wetland state description addresses the current hydro-geomorphic features, plant species, anthropogenic impacts and ecosystem services of the wetland. This enables the formulation of potential outcomes relating to proposed rehabilitation options.
Hydrological model
A detailed calibrated hydrological rainfall-runoff model is used to simulate the long-term water balance of different components of the wetland. All upstream water- and land-use data are included in the rainfall-runoff model to assure adequate calibration of the model against measured stream flows.
The WRSM2000/Pitman monthly rainfall-runoff model was used for this simulation using the Sami-runoff method and the comprehensive wetland sub-module option for the three major wetlands in the Theewaterskloof catchment (Bailey, 2015).
The quaternary catchments were sub-divided into quinary catchments as indicated in Fig. 1. The mean annual precipitation (MAP) for each of the quinary catchments was generated from a national MAP raster dataset (Dent et al., 1987) and catchment boundaries were determined using 1:50 000 contour maps overlaid on Google Earth satellite images.
With this finer spatial resolution, it was possible to better estimate the different wetland inflow streams including the main channel inflows, the lateral inflows and the amount of irrigation return flows from the orchards upstream from the wetland.
The rainfall-runoff model configuration also includes the following elements and datasets:
• Dams: Elandskloof and Theewaterskloof Dams' detailed survey data (DWS, 2019a) and smaller dam supply areas and capacities derived from farm dams in the catchment registered on DWS's Dam Safety Office (DWS, 2019b)
• Canals and pipelines: The Vyeboom Irrigation Boards' irrigation pipeline and the Elandskloof Irrigation Boards' irrigation canal systems' historical flow data (DWS, 2019a)
• Invasive alien plant infestation areas (Görgens, 2016)
• Irrigation water requirements and return flow volumes: crop areas and irrigation method (Western Cape Department of Agriculture, 2018) as well as crop monthly water requirements and irrigation application efficiency (Van Heerden and Walker, 2016)
The 'Comprehensive' Wetland sub-module of the WRSM2000/ Pitman Model is used to simulate the wetland water balances of the Vyeboom and other wetlands in the TheewaterskloofDam catchment. This wetland sub-module defines a channel that meanders through a wetland (either off-channel or in-channel), feeding it with water only when the river channel capacity is exceeded, and spilling back into the channel at different storage states. The flow of water between channel and wetland can be in the form of overbank spillage or via channels, or a combination of both (Bailey, 2015).
Figure 3 shows a diagram illustrating the flow balance through the wetland module in the WRSM2000/Pitman Model. The simulated upstream main channel inflow to the wetland (Qus) represents the inflow from the total upstream catchment area which is continuously connected to the wetland storage area or only under certain flow conditions. Qds represents the downstream outflow of the main channel. The latter conditions usually occur when there is a well-defined main channel such as in the case of strong perennial rivers, where an off-channel storage wetland often only fills under higher flow conditions, such as is the case for the Vyeboom Wetland where the Upper Riviersonderend feeds into the wetland as a main channel from the mountainous catchment areas.
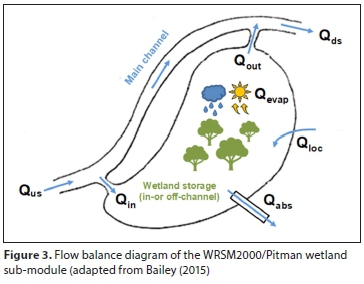
Other, more localised simulated runoff (usually lateral inflow) is also catered for in the module (Qloc). The localised runoff has direct access to the wetland storage area and is not limited by flow conditions in the main channel. A real wetland has many links, where water can flow from the main channel to the wetland storage area and back into the channel, depending on water levels.
The model configuration for the Vyeboom Wetland ensures that all runoff areas and irrigation return flow that directly surrounds the wetland storage area is modelled through Qloc. Another function also exists for wetland abstractions done directly from the wetland storage area (Qabs). However, this is not applicable to the Vyeboom Wetland.
The flow from the main channel to the wetland storage area (Qin) and from the storage area to the main channel (Qout) are regulated by several module parameters.
The monthly wetland water storage balance is calculated using Qin, the nominal monthly storage status of the wetland, the net monthly evaporation (Qevap - the difference between the months evaporation and rainfall) and Qout (Bailey, 2015). The sub-module also requires some physical parameters such as the wetland storage capacity, surface area and some calibration parameters that regulate the rate of inflow and outflow from the wetland storage area.
The physical wetland characteristics are determined by digitisation of wetland components in Google Earth (such as the main channel and lateral inflow catchment sizes) supplemented by data obtained from the wetland state description. Some of the wetland description data that aid the configuration of the hydrological model include:
• Wetland soil properties to estimate groundwater connectivity
• Plant species contained in the wetland and their estimated annual water requirements
• Expected changes in wetland area sizes due to rehabilitation
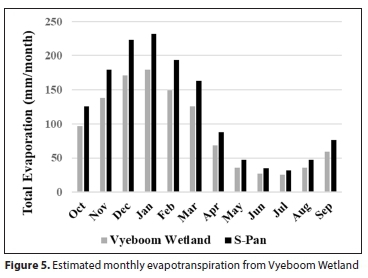
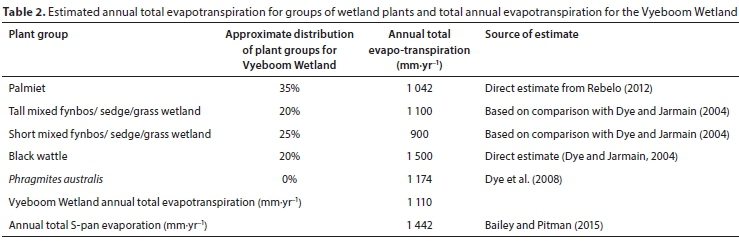
The total evapotranspiration for the Vyeboom Wetland is estimated by the distribution of species in the wetland based on the field visit and from estimated water use for each of the species from various sources. The annual total evapotranspiration is then disaggregated into monthly values based on the S-Pan monthly evaporation pattern (Bailey and Pitman, 2015).
The calibration of the rainfall-runoff model for the Theewaterskloof Dam Catchment involves:
• Calibrating the simulated flows against the measured streamflow records for H6H007, H6H008, and H6R002 upstream of all the wetland areas (see Fig. 1)
• Selecting initial wetland calibration parameters
• Transferring runoff parameters from upstream calibrations to remaining catchments flowing directly into Theewaterskloof Dam and adjusting to obtain a reasonable fit against dam inflow calculation
• Optimising wetland parameters using the Evolutionary Optimisation tool in Excel
Economic model
The economic valuation model acts as the culmination of the assessment of wetland conditions in terms of hydrology, geomorphology, and vegetation. The goal is to understand the wetland, not only in terms of the qualitative intrinsic value but also in quantified monetary terms as part of the role of water management within the broader hydrological systems when considering flows of the systems and the rainfall of the region.
The economic valuation is informed by:
• The scenario-based descriptions of the key function and performance differences of wetlands
• The rainfall-runoff hydrological model that simulates the long-term internal water balances to describe the interaction between water and the wetland vegetation
• A simple water quality model which is based on the difference in nitrogen and phosphorus assimilation capacity of intact and degraded wetlands
• Sediment retention and carbon storage adjustments that are associated with changes in wetland condition in the various defined scenarios
To derive the economic value of the wetland an indirect use value method is used, with reference to the 'minimisation of replacement costs' approach (Grossman, 2012). The nutrient abatement model is the key driver for the evaluation, although the ability of wetlands to retain sediment and store carbon is also incorporated in the assessment of the total economic value of the ecosystem.
The monetary value difference between the current state view and that expected if degradation would continue provides useful justification for budgets associated with rehabilitation interventions.
The net outcome is reported in terms of the net present value of differences between benefits and costs.
RESULTS
The hydrological model
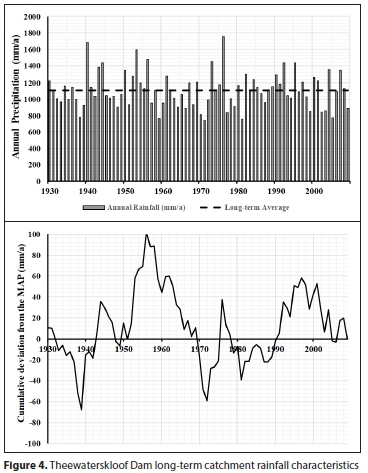
Long-term catchment-based rainfall time-series were generated for the Theewaterskloof Dam from patched monthly point rainfall station data within and from surrounding catchment areas. The point rainfall data were obtained from WR2012 study (Bailey and Pitman, 2015). Figure 4 shows the long-term annual catchment rainfall and the cumulative deviation from the long-term mean annual rainfall for the Theewaterskloof Dam catchment. Table 2 provides the estimated annual evapotranspiration for each group of plants. Figure 5 provides the approximate monthly distribution for the wetland compared to the S-pan evaporation for quaternary catchment H60A, predominantly on the western side of the Theewaterskloof Dam. The final present-day development level long-term average annual flow water balance for the Vyeboom Wetland is provided in Table 3.
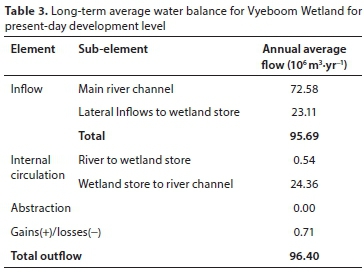
The Vyeboom wetland long-term water balance is illustrated in Fig. 6, showing only the last 5 years of the Present-Day development scenario. The capacity of the wetland is far exceeded by the total wetland inflow for most months. As can be seen from Table 3, the lateral inflows dominate the inflow to the wetland store since these flow directly into the wetland storage, which causes most of the main channel inflow bypassing or flooding of the wetland storage.
The economic model
The intrinsic value of the wetland for biodiversity conservation can be observed from the fact that most of the Vyeboom Wetland has been classified as aquatic Critical Biodiversity Areas (CBAs) in the Western Cape Spatial Biodiversity Plan (Pool-Stanvliet et al., 2017). The vegetation type covering the Vyeboom Wetland is Elgin Shale Fynbos, which has been identified as critically endangered owing to the irreversible loss of natural habitat (Pool-Stanvliet et al., 2017).
The sub-catchment in which the Vyeboom Wetland lies has been identified as a Freshwater Ecosystem Protected Area (FEPA) catchment, and it not only supports a good condition river but also the endangered giant redfin, Pseudobarbus skeltoni, which is endemic to the Breede River (Snaddon et al., 2018). It is possible that this is one of the three last remaining populations of this newly described species (Chakona and Swartz, 2013; Snaddon et al., 2018).
Smallmouth bass (Micropterus dolomieu), an alien fish species with a potentially devastating impact on indigenous fish populations, occurs in Theewaterskloof Dam. However, it appears to be absent upstream of the Vyeboom Wetland where the giant redfin are located, and it seems that the weakly channelled sections of the Vyeboom, where water flows are spread amongst dense Palmiet beds, are serving as an important barrier to the upstream movement of smallmouth bass in the dam (Snaddon, 2019).
The active headcut erosion in the Vyeboom Wetland is causing the ingress into the weakly channelled Palmiet beds of a channel, which is causing flows to be much more concentrated and therefore less obstructed by the wetland vegetation. In the absence of rehabilitation, this ingress poses a considerable threat, not only to vegetation habitat in the wetland (through its desiccation), but could indirectly threaten the giant redfin by allowing the smallmouth bass greater access to the Upper Riviersonderend Stream.
Therefore, it can be appreciated that, in halting the headcut erosion, the rehabilitation will make a key contribution to sustaining the intrinsic biodiversity value of the wetland and its broader sub-catchment. Similarly, control of invasive alien plants, which pose a considerable long-term threat to the Vyeboom Wetland, will make a key contribution to sustaining the intrinsic biodiversity value of the wetlands and its broader sub-catchments.
The capability of the nutrient reduction model can be illustrated by evaluating the specifically identified 25-ha scenario that was introduced above for the rehabilitation of the Vyeboom Wetland. The said 25 ha area is currently intact but is under severe and imminent threat of being severely degraded by the advancing erosion headcut. By determining the differences in marginal value (shadow prices) of the wetland in intact and degraded states, one can estimate the benefit value of the rehabilitation initiative.
The scenario affecting the specific 25 ha area is constructed around the observation that, although the initial state of the Vyeboom Wetland is almost pristine (only 1 ha degraded), it is expected that an adjacent 24 ha would degrade over a period of 50 years, following a typical logistic evolution pattern. Furthermore, it is assumed that the wetland nutrient reduction performance and flow rates would remain on an average level for the future. By balancing the total investment to offset the potential loss in benefits, if the 25 ha should become degraded, it is evident that an amount of 2.5 million ZAR (in 2019 ZAR value) can be afforded to be spent on the proposed rehabilitation project which would prevent the 25-ha area from degrading completely.
The indicated 2.5 million ZAR rehabilitation project budget ceiling is based on assumed average water flow and nutrient removal capabilities of the Vyeboom Wetland. Similar analyses for the minimum and maximum conditions of water flow and nutrient removal capability can be constructed to determine a range of budget values, which is indicative of the confidence level of the estimated average value. In this particular scenario, it was found that the estimated value could vary between 2.7 million and 2.4 million ZAR, depending on the assumptions for minimum and maximum conditions for water flow and nutrient removal.
This results in a coefficient of variation of less than 10%, which means that the estimated average allowable expenditure of 2.5 million ZAR can be accepted as a valid estimate.
In terms of benefits lost due to the degradation of the wetland, it would appear that the water quality impact (nutrient reduction) dominates the valuation as it accounts for more than 95% of the total benefit lost if the wetland is allowed to degrade.
Besides estimating the potential maximum expenditure that could be allowed on rehabilitation projects, the model indicates that the marginal economic value of the Vyeboom Wetland would fall from ~896 000 ZAR-ha-1-yr-1 (in 2019 ZAR value) to ~860 000 ZAR-ha-1-yr-1 if the 25-ha area would be allowed to degrade over the expected 50-year period.
DISCUSSION
The hydrological input to the economic evaluation is a long-term monthly simulation of outflows from the wetland storage (where plants have had access to the water) plus the associated monthly nett evapotranspiration losses (evapotranspiration minus the rainfall).
The efficiency of the nutrient removal is associated with the area of plants that has direct access to the water. This efficiency fluctuates from month to month depending on the wetland storage level and therefore the area of plants that have direct access to the water. It is key to understand the capacity and area of the wetland plants to not over-estimate the wetland's nutrient removal capabilities. For example, if the total flow that enters the main channel plus the lateral inflows had been used for the valuation, there would have been an overestimation of 270% of the actual inflow to the wetland that would be available for nutrient removal.
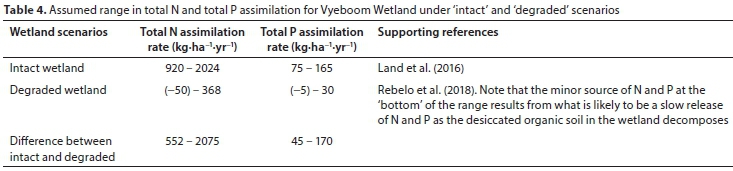
In order to determine the contribution of the Vyeboom Wetland rehabilitation to nutrient removal, inferred removal of total N (nitrogen) and total P (phosphorus) under different scenarios was based primarily on the comprehensive and systematic survey of rigorous site-based studies examining the effectiveness of created or restored freshwater wetlands for N and P removal by Land et al. (2016), as well as referring to the results of Turpie et al. (2010) and Rebelo et al. (2018) as shown in Table 4. Land et al. (2016) report that, on average, created or restored wetlands removed 1 840 kg-ha-1-yr-1 of total N (fairly close to the results of Turpie et al. (2010)) and 150 kg-ha-1-yr-1 of total P. It was decided to apply these average values to an intact condition of the wetland, given moderate to high levels of hydraulic contact (interaction) with flows through the wetland. This would apply to the currently intact portions of the Vyeboom Wetland, included in the 25-ha area that is currently intact, but which is under imminent threat of being severely degraded by the advancing erosion headcut.
Conservatively, it can be assumed that for the Vyeboom Wetland the assimilation of N and P is unlikely to be much above the average reported by Land et al. (2016). However, due to the following reasons, it is also assumed to be not far below the average reported by Land et al. (2016): (i) the wetland is not subject to a winter dormant period, a key factor reported by Land et al. (2016) to limit the effectiveness of wetlands in assimilating nutrients under cold climates; (ii) moderate hydraulic contact of the wetland given its weakly channelled character when not degraded; and (iii) good vegetation growth through most of the intact wetland.
For the 25 ha of affected wetland in the above case study this yields the required removal of 13 800 to 51 875 kg N and 1 000 to 4 000 kg P per year.
The indirect use value method, with special reference to the 'minimisation of replacement costs' approach, has been used to value the wetland. This is based on the costing of a hypothetical wastewater treatment works (WWTW) process of removing similar amounts of the N and P nutrients. The hypothetical alternative always subscribes to the conditions that:
• The alternative process considered must be able to deliver similar services as the natural wetland
• The considered process should not result in a shift in demand by society if such alternatives were to be implemented
• The optimal alternative choice should be the least-cost option
The nutrient reduction model generates indirect replacement values based on estimated capital expenditure (capex) and operating expenses (opex) of reference size WWTW designs. The capex and opex references are taken from Cullis et al. (2018) and Snaddon et al. (2018). The WWTW capex requirement is assumed to be 7 million ZAR-ML-1-day-1 throughput, and the associated opex is assumed to be about 13% of the capex requirement.
The operating cost ofthe hypothetical WWTW also includes a cost for the collection of wetland water inflows and the distribution of treated water to the originally located outflows. This would be required if the water feed to the Theewaterskloof Dam needs to be diverted to WWTW facilities that are not located on-site.
The nutrient reduction model is configured to generate monetary values per wetland, subject to conditions of state (intact or degraded), as well as minimum, average or maximum flow rates and nutrient reduction rates.
The sediment retention and carbon storage follow the configurations specified by Snaddon et al. (2018), with specific estimates of sediment volumes and organic matter volumes for the Vyeboom Wetland. The value of sediment retention is based on a replacement cost principle of building a dam to retain the Vyeboom volume of water (at 4.34 ZAR-m3). The carbon storage capability is estimated from data for area, depth and carbon content of organic soils, to be applied to an estimated 7.38 ZAR per ton of carbon stored in order to generate its economic contribution. The full details of the calculations for sediment trapping and carbon storage are given in Appendix 2.
The culmination point of the economic valuation is configured in a summarising cost-benefit analysis model. The final inferences are derived from the net present values for potential benefits lost and the costs of rehabilitation initiative budgets. The nutrient reduction, sediment retention, and carbon storage models provide the potential benefits that would potentially be lost if the wetlands were to be allowed to degrade. The contribution of nutrient reduction was found to dominate the total benefit estimates (>95%), while the combined effect of sediment retention and carbon storage contributed less than 5%. Although it is important from a wetland operations point of view, sediment retention and carbon storage do not contribute significantly to the economic benefits estimation.
The benefit estimations can be affected by the current state of degradation of the wetland, as well as views on the expected changes to erosion control services and carbon storage values that are associated with potential rehabilitation initiatives.
It is recognised that benefits lost due to degradation would be very unlikely to manifest their full potential in the initial period. The cost-benefit analysis, therefore, allows for the impact to progressively increase over time in the form of a logistic curve.
While this specific case of the Vyeboom Wetland assumes a logistic deterioration profile over a 50-year period, other profiles could also be considered. If, instead of a logistic profile, the wetland is assumed to be already in a state of accelerated deterioration, the 2.5 million ZAR rehabilitation project budget will increase once the other intrinsic benefits described are considered in the analysis. The outcome ofthe economic valuation is highly sensitive to the assumed degradation profile and area of wetland.
CONCLUSIONS
The economic valuation of a wetland, such as Vyeboom, can be constructed by assembling a set of models that describe the functional values of the wetland in terms of water quality enhancement (nutrient removal), retention of sediment and storage of carbon.
In the particular instance of the Vyeboom Wetland, which feeds into the Theewaterskloof Dam, it was found that the nutrient removal contribution far outweighs the contributions of other factors. The nutrient removal model is informed primarily by a simple water quality model which is based on the difference in nitrogen and phosphorus assimilation capacity of intact and degraded wetlands. It is also informed by the hydrological assessment of the long-term water balance of the Vyeboom Wetland, isolating the water balance elements that represent the flow that has direct contact with wetland vegetation and therefore wetland nutrient removal functionality.
The economic assessment assumes a long-term period (typically 50+ years) over which the somewhat degraded wetland would degrade even further. The monetary value difference between the current state and that expected if degradation would continue provides useful justification for budgets associated with rehabilitation interventions.
The economic value of the Vyeboom Wetland is thus primarily based on the indirect use value method, with a special focus on the 'minimisation of replacement costs'.
Besides the capability to determine marginal economic values for the wetland under various conditions, the economic model developed in this study can also provide a good indication of the maximum allowable expenditure that can be afforded on rehabilitation projects to curb or prevent various wetland degradation processes. In this specific case study, which was selected for this exposition, it was found that the economic valuation model provides useful estimates. Although the 4.4 million ZAR estimated for the rehabilitation is well in exceedance of the 2.5 million ZAR which can be afforded (assuming a logistic degradation profile), it is important to emphasize that that the 2.5 million ZAR estimate excludes the intrinsic benefits described earlier and includes only the four most obvious and readily quantifiable regulating services.
Several potentially important ecosystem services have not been included in the economic valuation, and therefore the value that was determined would likely be very conservative. Some potentially important ecosystem services that have not been included, and which may potentially add greatly to the 2.5 million ZAR, are:
• The assimilation of pesticides arising from the relatively high level of pesticide application over extensive areas of the Vyeboom catchment
• The assimilation of pathogens, notably Escherichia coli, with direct implications in terms of the export of fruit
• Local storage of water (available for direct use by adjacent farmers)
ACKNOWLEDGEMENTS
Funding for this study was provided by the Department of Environmental Affairs and Development Planning (DEA&DP). Pollution monitoring data were provided by the Breede-Gouritz Catchment Management Agency.
REFERENCES
BAILEY AK and PITMAN WV (2015) Water Resources of South Africa, 2012 (WR2012). WRC Report No. TT 683/16. Water Research Commission, Pretoria. [ Links ]
BAILEY AK (2015) WRSM2000/Pitman Water Resources Simulation Model for Windows - Theory July 2015. WRC Report No. TT 689/16. Water Research Commission, Pretoria. [ Links ]
CHAKONA A and SWARTZ ER (2013) A new redfin species, Pseudobarbus skeltoni (Cyprinidae, Teleostei) from the Cape Floristic Region, South Africa. Zootaxa. 3686 565-577. https://doi.org/10.11646/zootaxa.3686.5.5 [ Links ]
CULLIS JDS, ROSSOUW N, DU TOIT G, PETRIE D, WOLFAARDT G, DE CLERCQ W and HORN A (2018) Economic risks due to declining water quality in the Breede River Catchment. Water SA. 44 (3) 464-474. https://doi.org/10.4314/wsa.v44i3.14 [ Links ]
DENT MC, LYNCH SD and SCHULTZ RE (1987) Mapping mean annual and other rainfall statistics over Southern Africa. University of Natal, Durban. [ Links ]
DWA (Department of Water Affairs, South Africa) (2012) Pre-feasibility and feasibility studies for augmentation of the Western Cape Water Supply System by means of further surface water developments. Department of Water Affairs, Pretoria. [ Links ]
DWAF (Department of Water Affairs and Forestry, South Africa) (2010) The nature, distribution and value of aquatic ecosystem services of the Olifants, Inkomati and Usutu to Mhlatuze Water Management Areas. Report by Anchor Environmental Consultants for Department of Water Affairs and Forestry, Pretoria. 362 pp. [ Links ]
DWS (Department of Water and Sanitation, South Africa) (2019a) Hydrological Services - Surface Water. URL: http://www.dwa.gov.za/Hydrology/Default.aspx (Accessed 3 March 2019). [ Links ]
DWS (Department of Water and Sanitation, South Africa) (2019b) Dam Safety Office - List of registered dams. URL: http://www.dwa.gov.za/DSO/Documents/List%20of%20Registered%20Dams%20May%202018.xls (Accessed 3 March 2019). [ Links ]
DYE P and JARMAIN C (2004) Water use by black wattle (Acacia mearnsii): implications for the link between removal of invading trees and catchment streamflow response. S. Afr. J. Sci. 40 40-44. [ Links ]
DYE P J, JARMAIN C, LE MAITRE D, EVERSON CS, GUSH M and CLULOW A (2008) Modelling vegetation water use for general application in different categories of vegetation. WRC Report No. 1319/1/08. Water Research Commission, Pretoria. [ Links ]
ELLERY WN, GRENFELL SE, GRENFELL MC, POWELL R, KOTZE DC, MARREN PM, and KNIGHT J (2016) Wetlands in southern Africa. In: Knight J and SW Grab SW (eds) Quaternary Environmental Change in Southern Africa. Cambridge University Press, Cambridge. 188-202. https://doi.org/10.1017/CBO9781107295483.012 [ Links ]
GÖRGENS A (2016) The impacts of different degrees of alien plant invasion on yields from the Western Cape Water Supply System: Final report. Aurecon South Africa (Pty) Ltd, Century City. [ Links ]
GROSSMAN M (2012) Economic value of the nutrient retention function of restored floodplain wetlands in the Elbe River basin. Ecol. Econ. 83 108-117. https://doi.org/10.1016/j.ecolecon.2012.03.008 [ Links ]
GRUNDLING PL, GRUNDLING AT, PRETORIUS L, MULDERS J and MITCHELL S (2017) South African peatlands: ecohydrological characteristics and socio-economic value. WRC Report No. 2346/1/17. Water Research Commission, Pretoria. ISBN 978-1-4312-0892-0. [ Links ]
GRUNDLING P-L (2019) Personal communication, 5 March 2019. Dr Piet-Louis Grundling, Department of Environmental Affairs, Pretoria. [ Links ]
KOTZE DC, ELLERY WN, MACFARLANE DM and JEWITT GPW (2012) A rapid assessment method for coupling anthropogenic stressors and wetland ecological condition. Ecol. Indic. 13 284-293. https://doi.org/10.1016/j.ecolind.2011.06.023 [ Links ]
KOTZE DC (2015) A survey oforganic soils in the upper Riviersonderend catchment. Unpublished report submitted to WWF, Cape Town. [ Links ]
LAND M, GRANÉLI W, GRIMVALL A, HOFFMANN CC, MITSCH WJ, TONDERSKI KS and VERHOEVEN JTA (2016) How effective are created or restored freshwater wetlands for nitrogen and phosphorus removal: A systematic review. Environ. Evidence. 5 (9) 1-26. https://doi.org/10.1186/s13750-016-0060-0 [ Links ]
MACFARLANE D, OLLIS D, KOTZE D, GRENFELL M, MALAN H, EDWARDS R, ELLERY W, WALTERS D, NGOBELA T and EWART-SMITH J (2020) WET-Health Version 2.0: A technique for rapidly assessing wetland health. WRC Report TT 820/20. Water Research Commission, Pretoria. [ Links ]
NEL JL, MURRAY KM, MAHERRY A, PETERSEN CP, ROUX DJ, DRIVER A, HILL L, VAN DEVENTER H, FUNKE N, SWARTZ E R, SMITH-ADAO L B, MBONA N, DOWNSBOROUGH L and NIENABER S (2011) Technical Report for the National Freshwater Ecosystem Priority Areas project. WRC Report No. 1801/2/11. Water Research Commission, Pretoria. [ Links ]
NORDHAUS WD (2017) Revisiting the social cost of carbon. Proc. Natl Acad. Sci. U S A. 144 (7) 1518-1523. https://doi.org/10.1073/pnas.1609244114 [ Links ]
O'GEEN AT, BUDD R, GAN J, MAYNARD JJ, PARIKH SJ and DAHLGREN RA (2010) Mitigating nonpoint source pollution in agriculture with constructed and restored wetlands. Adv. Agron. 108 1-76. https://doi.org/10.1016/S0065-2113(10)08001-6 [ Links ]
POOL-STANVLIET R, DUFFELL-CANHAM A, PENCE EG and SMART R (2017) The Western Cape Biodiversity Spatial Plan Handbook. CapeNature, Stellenbosch. [ Links ]
PRETORIUS L (2019) Personal communication, 5 March 2019. Dr L Pretorius, School of Life Sciences, University of KwaZulu-Natal, Durban. [ Links ]
REBELO AJ (2012) An ecological and hydrological evaluation of the effects of restoration on ecosystem services in the Kromme River system, South Africa. Masters thesis, University of Stellenbosch, Stellenbosch. [ Links ]
REBELO AJ, EMSENS W-J, MEIRE P and ESLER KJ (2018) Quantification of water purification in South African palmiet wetlands. Water Sci. Technol. 78 1199-1207. https://doi.org/10.2166/wst.2018.389 [ Links ]
SNADDON K, DIETRICH J, FORSYTHE K and TURPIE J (2018) Prioritisation of wetlands for water security in priority dam catchments in the Western Cape supply system. Unpublished report submitted to The Nature Conservancy. Freshwater Research Centre, Cape Town. [ Links ]
SNADDON K (2019) Personal communication, January 2019. Dr Kate Snaddon, Freshwater Research Centre, Cape Town. [ Links ]
TURPIE J, DAY E, ROSS-GILLESPIE V and LOUW A (2010) Estimation of the water quality amelioration function and value of wetlands: a case study of the Western Cape, South Africa. In: Turpie J and Malan H (eds) Wetland valuation. Vol II: Wetland valuation case studies. WRC Report No. TT 441/09. Water Research Commission, Pretoria. [ Links ]
TURPIE JK, FORSYTHE KJ, KNOWLES A, BLIGNAUT J, LETLEY G (2017) Mapping and valuation of South Africa's ecosystem services: A local perspective. Ecosyst. Serv. 27 (B) 179-192. https://doi.org/10.1016/j.ecoser.2017.07.008 [ Links ]
VAN HEERDEN PS and WALKER S (2016) Upgrading of SAPWAT3 as a management tool to estimate the irrigation water use of crops. WRC Report No. TT 662/16. Water Research Commission, Pretoria. [ Links ]
WESTERN CAPE DEPARTMENT OF AGRICULTURE (2018) Crop Census 2017/2018 (Winter). Western Cape Government. Cape Town. [ Links ]
 Correspondence:
Daniel Marais
Email: prevision@mweb.co.za
Received: 13 January 2020
Accepted: 23 November 2020
APPENDIX 1
Supplementary material on the assessed high level of threat of erosional incision into HGM 3 of Vyeboom wetland
Twenty-five hectares of HGM 3 of the Vyeboom Wetland, a short distance upstream of the inflow into Theewaterskloof Dam, is under a very high threat of erosional incision (Fig. A1). This high level of threat was assessed based on the following considerations: (i) the historical rate of advance of the headcuts now threatening the area; (ii) the inherent vulnerability of the area under threat; and (iii) anthropogenic factors promoting erosion.
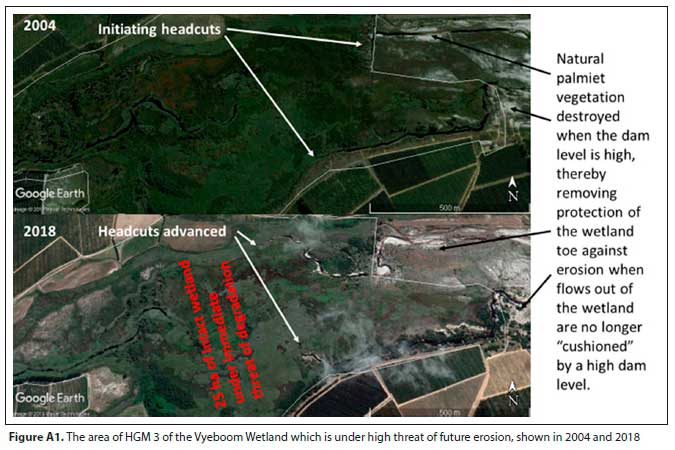
In terms of historical erosion, Vyeboom Wetland's HGM 3, located immediately upstream of Theewaterskloof Dam, is currently very actively eroding, and the main erosion headcut has advanced 390 m in 14 years based on comparison of the 2004 and 2018 Google Earth images (Fig. A1). This contrasts with the erosion headcut threatening HGM 1, where over the same period (2004 to 2018) no advance was detected.
Given the size of Vyeboom Wetland (235 ha) and its longitudinal slope (0.7%), its natural vulnerability to erosion is assessed as moderately high (8/10) based on the prescription of Ellery et al. (2016) and Macfarlane et al. (2020) for assessing vulnerability using wetland size (a simple surrogate for mean annual runoff) and wetland longitudinal slope. Furthermore, no impediments to erosion (e.g., a geological obstruction) occur within HGM 3 which might halt the future advance of headcut erosion.
In terms of anthropogenic disturbance, the fluctuating level of the Theewaterskloof Dam appears to be a potentially important factor contributing to headward erosion of an extensive area of weakly channelled wetland lying immediately upstream of the dam and extending below the full supply level of the dam (Fig. A1). This begins during a period when the dam is full or near-full and the lowermost portion of the wetland becomes flooded, which in turn drowns the vegetation covering this area. When the level of the dam drops, which is often rapid, the downstream portion of the wetland is left without vegetation and exposed to erosion. Furthermore, the base level of the wetland, previously provided by the highwater level of the dam, is now often several metres below the wetland, and therefore has no controlling influence over water flowing out of the wetland, further amplifying the vulnerability of the wetland to erosion.
APPENDIX 2
Supplementary material on the valuation applied to carbon storage and sediment trapping
Contribution of wetland rehabilitation to carbon storage in the Vyeboom Wetland
Organic soils cover an estimated 71 ha of the Vyeboom Wetland, with an average depth of 0.54 m, giving a total volume of organic soil of 383 153 m3 (Kotze 2015). The average organic matter content of the soil in Vyeboom Wetland was estimated as 26% (Kotze 2015). This translates to 15.1% C based on the Van Bemmelen factor as recommended by Grundling et al. (2017):
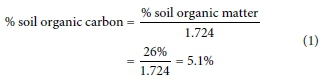
This further represents 30.2 kgC-m-3m3 of soil, based on the bulk density trend related to increasing percentage soil organic matter content reported by Grundling et al. (2017), which for the Vyeboom organic soil was taken as 0.2 g-cm-3. Given the total volume of organic soil of 383 153 m3, as estimated by Kotze (2015), the total stock of carbon in this material is 11 571 t C (tonnes of carbon).
Approximately 25 ha, constituting 35% (i.e. 4 050 t C) of the organic soil area in Vyeboom is under immediate threat from the currently active erosion headcuts in the wetland. The potential depletion of soil carbon stocks in the wetland by this threat was estimated in consultation with P-L Grundling (Grundling, 2019) and L Pretorius L (2019). A conservative estimate is that, in the absence of rehabilitation interventions to halt this erosion, the impact of the erosion gully will only be on the organic soil in close proximity to the gully, thereby only subjecting 30% of the carbon store to severe desiccation, decomposition and release into the atmosphere. However, the influence is considered likely to be more than 30%, given that the drying out of the organic soil greatly increases the risks of ground fires and the release of additional carbon into the atmosphere through combustion; therefore a potentially much higher proportion of the overall carbon stock could be released into the atmosphere, and therefore 85% is taken as the upper end of the possible range. Thus, for the purposes of the economic assessment, the rehabilitation will contribute to preventing the loss to the atmosphere of 1 2153 443 t C. Following Snaddon et al. (2018), this range was then converted into 'equivalent total CO2', using the global social cost of carbon (Nordhaus, 2017, converted to 2019 ZAR) and South Africa's share of this cost based on proportional GDP contribution and vulnerability index as described by Turpie et al. (2017).
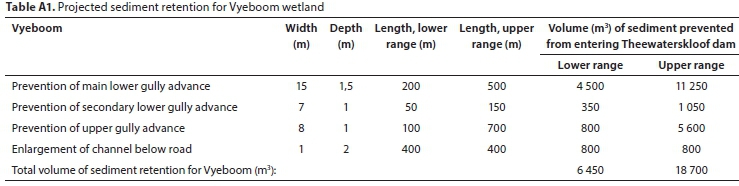
Contribution of wetland rehabilitation to sediment trapping in the three wetlands
When valuing the contribution of wetland rehabilitation to the sediment trapping service of a wetland (Table A1) the distinction was draw between:
• The sediment already trapped in the wetland which will be directly released if erosion is not halted through rehabilitation interventions
• Increased capacity (through the rehabilitation interventions) of the wetland to trap further sediment likely to be yielded from the catchment.
For already trapped sediment the projected volume likely to be lost was estimated based on the dimensions of the erosion gullies (and projected distances of gully advance).
For the increased capacity of wetlands, a similar holding capacity estimate to that used by Snaddon et al. (2018) based on the area of wetland multiplied by depth was used. However, a more refined means could be used for identifying the effectiveness of this holding area which can be attributed specifically to rehabilitation. Here reference is made to the hydrological model, identifying the proportion of the wetland where channel dimensions are smaller (and therefore bank overspill occurs more readily) in the 'with rehabilitation' scenario compared to the 'without rehabilitation' scenario.

