


Services on Demand
Article
 English (pdf)
 Article in xml format
 Article references
Indicators

Related links
-
 Cited by Google
 -
 Similars in Google
Share

 Permalink
Water SA
On-line version ISSN 1816-7950
Print version ISSN 0378-4738
Water SA vol.47 n.1 Pretoria Jan. 2021
http://dx.doi.org/10.17159/wsa/2021.v47.i1.9440
RESEARCH PAPER
Intermittent water supply: a South African perspective
Carlo Loubser; Bubala Mwiinga Chimbanga; Heinz Jacobs
Department of Civil Engineering, Stellenbosch University, Private Bag X1, Matieland, 7602, South Africa
ABSTRACT
The prevalence of intermittent water supply in South Africa was investigated in this research study. Data on intermittent water supply in South Africa was collated by considering the following four sources: a targeted water services provider survey; published databases and related reports; open-access publications, such as online media articles; and field visits by the project team to selected areas. The data were spatially and temporally analysed to determine the prevalence of intermittent water supply. The population affected by intermittent water supply increased by ~26% between 2008 and 2017, which exceeds the population increase of ~12% over the same period. Moreover, 22 million people in South Africa were affected by intermittent water supply in 2017. Results from this study confirm an increased prevalence of intermittent water supply over time and show that 65 of the 231 municipalities in South Africa supplied water intermittently, 32 had continuous water supply and 134 had no data. Fundamentally, the outcomes highlight the widespread occurrence of intermittent water supply in South Africa, which is in line with the poor state of water services delivery in South Africa, as portrayed in the 2018 National Water and Sanitation Master Plan by the national Department of Water and Sanitation.
Keywords: water services provider, municipal water provision, level of service, drinking water, service provision, IWS
INTRODUCTION
The responsibility of water supply and distribution mostly lies with government bodies such as water boards, water utilities or municipalities. The general term 'water services provider' (WSP) is used collectively for these bodies in this paper. In most cases addressed in this text, the municipality is the water services provider. Therefore, the results are presented in terms of municipal jurisdiction, by using recognised municipal boundaries. The water service provider has the overarching responsibility of ensuring adequate water supply. The norm in most developed countries is continuous water supply (CWS), which is water supply for 24 h per day, every day of the year.
Although there have been significant international efforts towards improved water supply in most developing countries, centralised water distribution continues to suffer inadequacies, the most significant being intermittent water supply (IWS) (Klingel, 2012). IWS refers to a type of water supply through which consumers connected to a water distribution system (WDS) receive water for less than 24 hours in a day (Agathokleous and Christodoulou, 2016). IWS has been purposefully implemented in developing countries in an attempt to find a balance between water scarcity and water demand. Although conserving water resources via IWS may be the intention, it is often not the final outcome, since demand often increases with insecurity (Galaitsi et al., 2015). Despite the efforts to transition from IWS to CWS systems, IWS may eventually become a common phenomenon, because of underinvestment in water supply infrastructure (Kumpel and Nelson, 2016). IWS is exceptionally problematic in periods such as during the Covid-19 world health crisis of 2020, where emphasis is placed on personal hygiene -especially regular and proper hand washing - in order to prevent or minimise the impact of epidemics. Under these conditions, IWS would negatively impact community health.
IWS can be accepted as permanent in some regions (Simukonda et al., 2018). Consequently, advancements in the science of water supply and distribution, as well as water supply technologies, become critical. Technologies can be controlled or modified, whereas the availability of water as a resource and the rate of increase in the demand for potable water cannot (Mokssit et al., 2018).
Although many people worldwide have gained access to potable water over the past few years, approximately 663 million people still lack access to clean potable water (Mokssit et al., 2018). An analysis was performed by Bivins et al. (2017) using IBNet and JMP data, and it was estimated that 925 million people worldwide are affected by IWS (IWS was defined as a water utility reporting less than an average of 23 h of water supply per day). Kumpel and Nelson (2016) used data abstracted from the International Benchmarking Network (IBNet), to indicate that about 18.8 million people in Sub-Saharan Africa experience IWS, and also compiled a map of the world depicting the average hours of supply. In relation to Southern Africa, the following is relevant:
• No data on supply hours was available for Angola, Botswana and Zimbabwe
• For both Zambia and Mozambique, a supply duration between 15 and 20 h was reported
• The supply duration for South Africa and Namibia was reported to be 24 h
BACKGROUND
Loubser et al. (2020) presented a concept to quantify IWS by means of a dimensionless index number. The proposed IWS index is useful to compare the severity of IWS in specific water distribution systems, but requires certain input parameters that may not be available at a national scale. In order to broadly evaluate the prevalence of IWS (without quantifying the severity) in a large geographic area such as South Africa, a different approach is needed, as presented in this paper.
South Africa has a vast array of water services providers comprising the national Department of Water and Sanitation (DWS), water boards, district municipalities, local municipalities and private water services providers (Berg and Corton, 2007). In South Africa, the responsibility of water supply and distribution lies predominantly with the local municipalities, each with its own specific area of jurisdiction (Hoffman and Nkadimeng, 2016). When compared to other countries in the Southern African region, South Africa has fairly well-developed water supply infrastructure that meets the demand for many of the key sectors, including industry, commercial irrigation, and coal-fired electricity generation, as well as most of the domestic consumers in urban areas (Sharma and Vairavamoorthy, 2009). The ease of access to potable water in certain major cities is comparable to that found in developed countries (Edokpayi et al., 2018). Many of the metros and large municipalities in South Africa have WDS that are relatively effective by global standards (McKenzie, 2016). In these metros and large municipalities, water is generally supplied for 24 h at pressures equal to those of the First World, and it is generally considered safe to drink tap water (McKenzie, 2016). Even when the City of Cape Town in South Africa experienced the very severe drought in 2017, and extreme water demand management was implemented through several measures, including drastic pressure reduction, supply failures due to low pressures were extremely uncommon (Loubser and De Bruyn, 2019).
In the year 2000, about 17.5 million people in South Africa (about 38% of the total population) lacked access to basic water supply (Sharma and Vairavamoorthy, 2009). It was also reported that this number could be reduced to less than 7 million if the existing infrastructure were to be managed effectively (Sharma and Vairavamoorthy, 2009). In 2017, more than 5 million South Africans still did not have access to a reliable drinking water supply (Smith, 2018). According to Soyapi (2017), water supply and distribution challenges include poverty, underdevelopment, governmental inefficiency, inadequate service delivery to the poor, severe environmental conditions and water scarcity.
Many rural communities in South Africa face challenges in accessing safe drinking water, particularly during periods of drought (McKenzie, 2016). Water supply schemes in rural areas become vulnerable during drought periods because their ability to supply water greatly depends on groundwater or run-of-river flow. Such water supply schemes do not have the same assurance of supply as the integrated water supply systems that supply urban areas (McKenzie, 2016). In addition, the supply of potable water in many rural municipalities remains a challenge due to financial constraints and the limited capacity of water supply infrastructure (Hoffman and Nkadimeng, 2016). When compared to the national water service delivery guidelines, rural municipalities generally fall short, therefore increasing the gap between urban and rural areas in service delivery relating to water supply (Hoffman and Nkadimeng, 2016).
Edokpayi et al. (2018) performed a study on 405 households in rural communities in Limpopo Province. The supply in some of the cities, towns and villages is intermittent, while other towns have no existing water supply systems (Edokpayi et al., 2018). Despite having piped water connections to homes in certain areas, the storage of water in home tanks is necessary because of intermittent supply (Edokpayi et al., 2018). In households that do not have access to the potable water piped into their homes, storage of water collected from various sources, including rivers, springs, community standpipes, and boreholes, is common practice. At the household level, IWS often leads to storage of water in home tanks, which in turn can lead to compromised water quality (Edokpayi et al., 2018).
Water shortages in most parts of South Africa are not necessarily caused by inadequate water resources, but are often due to failed water supply infrastructure (Commonwealth Governance, 2018). For example, Mopani District Municipality has not been able to sustainably provide water in most of its towns due to several challenges that have incapacitated the municipality. These challenges include inadequate water resources, ageing infrastructure, limited capacity in municipalities, the nonpayment of water services by the consumers and poor planning (Maake and Holtzhausen, 2015).
Hoffman and Nkadimeng (2016) investigated water supply in Motetema settlement, situated within the Elias Motsoaledi Local Municipality in Limpopo Province, and found that dilapidated and fragile infrastructure leads to 46% of the population experiencing less than 9 h of water supply per day. More than 75% of the respondents reported water supply of less than 15 h per day. In addition, municipal responses to breakages were reportedly very slow, and 54% of respondents claimed that it takes longer than 7 days for the water supply to be restored. Water quality was also reported to be poor, and 31% of respondents claimed that the smell, colour and taste were generally unacceptable. The poor quality was confirmed by health workers at the clinic who reported frequent outbreaks of diarrhoea, possibly due to unsafe drinking water (Hoffman and Nkadimeng, 2016).
TERMINOLOGY
IWS has been defined in literature as a management strategy where water supply in a system, or part thereof, is physically shut off to limit the consumption (Vairavamoorthy et al., 2008). For the pupose of this paper, this standard form of IWS will be further defined as 'formal' IWS.
The other alternative, termed 'informal' IWS, is typically associated with pipe breaks or network maintenance. Informal IWS could also manifest in the form of prolonged periods of no supply, and could be as a result of slow response to pipe breaks, water resources running out due to drought or over-exploitation, drastic system degradation, vandalism, electricity supply outages, or improper management and maintenance of water resources or the distribution system. Informal IWS often involves vague timelines as to when the water supply will be restored.
Moreover, Galaitsi et al. (2016) proposed that IWS can be classified into three different categories, namely predictable, irregular and unreliable intermittency. Loubser et al. (2020) briefly mentioned these categories when deriving the IWS index, but given the relevance of these categories for this research, the three categories will be elaborated on, and linked to specific observations during the study of IWS in the South African context.
• Predictable intermittency is supply characterised by water shut-offs that occur generally within a predictable schedule, and with relatively constant water pressure during each delivery. The schedule can be on time scales of days or longer. From research performed on IWS in the City of Mbombela in South Africa, it is clear that this form of intermittency corresponds with proper control of reservoir levels and water resources in general. The supply is driven by a time schedule, and is generally made possible by proper control of water resources and predictable water levels in reservoirs.
• Irregular intermittency is supply arriving at unknown intervals within short time periods of no more than a few days. Consumers can expect to receive a certain quantity of water within the unit time frame, although they cannot anticipate precisely when the water will arrive. From research performed on IWS in the City of Mbombela in South Africa, it is clear that this form of intermittency corresponds with a general lack of control of reservoir levels, water resources and resulting supply schedules. The supply is driven by water availability at sources or in reservoirs, rather than by a predetermined time schedule.
• Unreliable intermittency is supply characterised by uncertain delivery time and the risk of insufficient water quantity, often exacerbated by limited storage and long periods of non-delivery. Delivery is inconsistent and the consumer must make choices under uncertainty, requiring greater behavioural, emotional and physical defences to cope with shortages. Residents from Makhazi Village in Mooiplaas, near East London, reportedly in July 2017 had been without water for 4 months. According to residents, no explanation was offered from their ward councillor or from the Amathole District Municipality on possible reasons for the water supply failure. This type of intermittency is defined as unreliable, based on the long duration of non-delivery and the uncertainty experienced and communicated by consumers.
Aim
Given significant evidence of fairly widespread intermittency in terms of water supply, the aim of this study was to investigate the prevalence of IWS in South Africa between the years 2008 and 2017. Related parameters such as the number of consumers per water connection, causes of IWS and affected population were also evaluated.
METHODOLOGY
The methodology involved gathering and analysing data on IWS in South Africa, from three major sources, including:
• A targeted survey to water services providers
• A review of published databases and related sources
• A review of available online media articles
Due to a lack of case-by-case water supply-specific information from available sources, the prevalence of IWS was investigated at a broad level, without any insight into particular water distribution system topology or network hydraulics.
Data collection
As a first attempt to gather data on IWS, a questionnaire was compiled. The 6-page questionnaire was made up of 3 sections, which comprised a total of 21 questions that were either multiple-choice, statistical or descriptive in nature. The first section consisted of 6 questions, relating to general information about the respondent and the water utility. The second section contained 13 questions, 4 of which were multiple-choice, while the remainder requested statistical data (to be given as annual averages or totals). The last two questions, contained in the third section, required a descriptive response.
Distribution of the questionnaires commenced after ethical clearance approval by Stellenbosch University Ethical Committee. As part of this study, 252 water services providers in Southern Africa (including the countries South Africa, Eswatini, Lesotho, Namibia, Angola, Botswana, Zimbabwe, Mozambique and Zambia), were targeted with the survey. After 3 months and more than 800 emails sent to respondents by the research team, a total of 14 permission letters and 9 declines were received. In the follow-up of the 14 permission letters, only 2 completed questionnaires were received. This equates to an overall response rate of 0.8%, from a sample size of 252. Both the survey respondents indicated continuous water supply, and the research team had to find alternative sources for information on IWS. Both CWS responses were incorporated in the results.
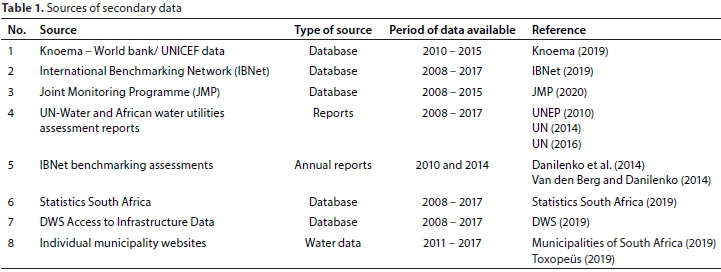
The second phase involved gathering of data on the performance of South African WSPs with regard to water supply and accessibility. Relevant data was obtained from specially selected published reports and open-access online databases, as presented in Table 1. The data were selected based on specific water supply parameters, including supply coverage, number of connections, interruption of supply and the population affected by IWS. General challenges experienced by municipalities, as reported for the period between 2008 and 2017, were also reviewed and analysed.
Given widely reported municipal services collapse on several levels via South African media, both online and in print, the need was identified to look beyond published research papers, and also beyond sources listed in Table 1. Information on IWS was subsequently obtained from various online news articles, social media platforms and open-access websites. Internet searches were conducted on the terms 'intermittent water supply, 'water challenges', 'water supply problems', 'supply interruptions', 'water shortage', 'dry taps', 'water crisis' and 'no water'. In addition, the research team performed Internet searches on municipalities with known water supply challenges and intermittent water supply. Moreover, the social media platform 'South African Water Warriors' was studied in depth, to uncover hints as to which areas warranted further investigation. Specific radio programmes, where consumers from all over South Africa could call in to report on water supply problems, were available online. The content of these programmes was analysed and used to provide leads for more specific online investigation. These information sources were accessed during 2019 and 2020, and only articles that were more recent than January 2015 were considered. In total, more than 45 news articles and online sources were used to gather this data, the majority of which dated to between 2018 and 2020. In some instances, more than one source indicated IWS being experienced in a municipality, while other sources listed several municipalities experiencing IWS in one news article.
Researchers involved in this study visited the towns of Beaufort West (Central Karoo District Municipality) and Makhanda/ Grahamstown (Makana Municipality) during 2019 and 2020, respectively, and confirmed IWS in both towns. A detailed investigation of water supply in two specific towns within the City of Mbombela Municipality, between 2017 and 2019, also confirmed IWS. Between January 2019 and March 2020, CWS was confirmed after visits to the Berg River-, Breede Valley-, Cederberg-, Knysna-, Mossel Bay-, Oudtshoorn- and Witzenberg Municipalities. These first-hand experiences were included in the results of this study.
Although the initial data collection included various countries in the Southern African region, the data from South Africa provided insight into temporal and spatial variation of certain key parameters. Therefore, this research focused exclusively on South Africa.
RESULTS
Prevalence of IWS in South Africa
In order to determine the prevalence of IWS in South Africa, analyses were first performed on data related to population affected by IWS. The various sources listed in Table 1 were used for this purpose.
Population affected by IWS
The South African population that was affected by IWS (both formal and informal) between 2009 and 2016, is illustrated in Fig. 1. This figure was generated using 3-year moving averages based on data obtained from Statistics South Africa. While the intermittency reported in Fig. 1 is not indicative of any specific form of IWS, the results suggest an upward trend, and point to a decline in water supply availability in most provinces of South Africa.

Figure 2 represents the relationship between the total population of South Africa and the population that was affected by IWS, between 2008 and 2017. This figure was generated using data obtained from Statistics South Africa. The population of South Africa increased by 12% in this period, while there was an increase of 26% in the population affected by IWS during the same period. In 2017, an estimated 22 million people were affected by IWS, which represented 39% of the population. The IWS reported probably contains data points including both formal and informal IWS.

A map of the population affected by some form of IWS (either formal or informal) was compiled for the year 2017. The data come from Statistics South Africa, and the results are presented in Fig. 3.

The map in Fig. 3 demonstrates that in 2017, KwaZulu-Natal Province had the highest population, of 4.6 million, affected by IWS. Gauteng Province returned a similar number, marginally below 4.6 million, followed by the Eastern Cape with 3.0 million and Mpumalanga Province with 2.8 million. Figure 4 presents the same data, but in this instance expressed as a percentage of the total population of the province. The highest percentages are experienced by Mpumalanga Province, followed by Limpopo and North West Provinces, the Eastern Cape Province and then the Free State and KwaZulu-Natal Provinces. For all six provinces listed here, more than 42% of the population is affected by IWS.

Figures 3 and 4 are well supported by Fig. 5, as published in the National Water and Sanitation Masterplan (DWS, 2018), in which the reliability of water supply and sanitation services in the various provinces is presented. This figure is based on data that are regularly collected by Statistics South Africa, through the national census and through the General Household Surveys programme.

Municipalities affected by IWS
The research team also considered open-access information, in addition to published research papers, and beyond those sources listed in Table 1. Information obtained from various online social platforms and open-access websites, as well as news articles,
revealed that more than a quarter of municipalities in South Africa are affected by some form of IWS. This figure is supported by the National Water and Sanitation Masterplan (DWS, 2018), in which it is stated that at least 33% of all South African municipalities are regarded as dysfunctional and more than 50% have no or very limited technical capacity. Based on the content of each media report, it was possible to distiguish between different forms of IWS. For the purposes of this section of the paper, the three types of intermittency defined by Galaitsi et al (2016) were used to classify the type of IWS predominant in each municipality.
In order to clarify how these IWS classifications were made, three examples are discussed here. In June 2018, it was reported by the Ngwathe Municipality that a valve was closed at night, shutting off water supply to the Vaal Parys area. This was an attempt to allow a newly constructed reservoir to fill up during the night. After the reservoir had filled up, mostly early in the morning, the valve was opened to restore water supply to the Vaal Parys area. This supply cycle was managed by officials of the Ngwathe Municipality on a daily basis, and therefore constitutes predictable IWS. It was reported in November 2018 that the town of Jacobsdal, located in the Letsemeng Municipality, is supplied with water twice per day, but that the supply schedules were completely unpredictable. By definition, this would be classified as irregular IWS. Residents of the town of Bethal and nearby Emzinoni township, located in the Govan Mbeki Municipality in Mpumalanga Province, on 15 January 2019 reported that they had been without water for the past 25 days. Given the long duration of non-delivery, this form of IWS was classified as unreliable intermittency.
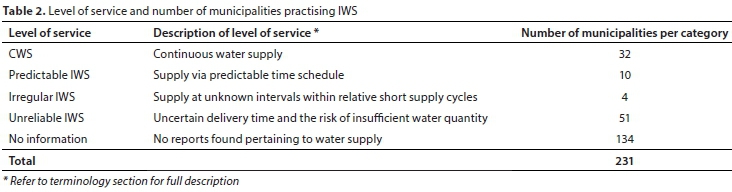
The results of this analysis are summarised in Table 2.
The results were also spatially analysed, as presented in Fig. 6. If IWS was reported in media within a municipal area between the years 2015 and 2020, the entire municipal area was categorised so that it best represents the relevant form of IWS. This could be misleading, because within a municipal boundary, only certain towns may be affected by IWS. For example, The Central Karoo District Municipality supplies water to several towns within the municipal area. It is known that the town of Beaufort West implemented predictable IWS in 2019. By virtue of this fact, the Central Karoo District municipal area is presented as if predictable IWS is implemented throughout. It was considered appropriate to map the prevalence of IWS in this way, because IWS often stems from challenges experienced at WSP level, for example physical water scarcity, economic water scarcity or resource constraints.
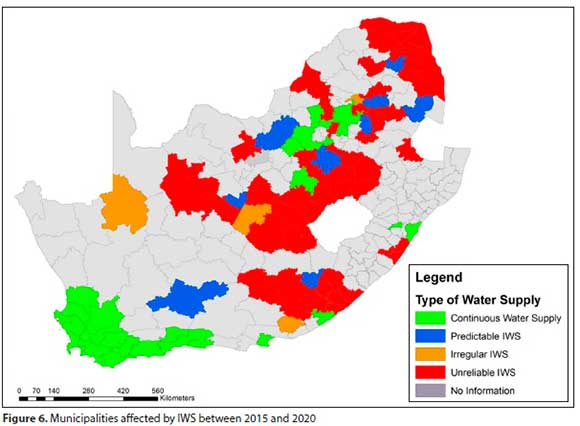
In addition, the map does not represent a snapshot in time, but rather represents an overview of the water supply status as experienced between 2015 and 2020. In some of the municipal areas that are highlighted as experiencing some form of IWS, it may even be that the water supply problems have been addressed, and that CWS has been restored. However, such instances were considered the exception rather than the rule.
Most of the affected municipalities are located in the Free State, Limpopo, Mpumalanga and Eastern Cape Provinces and, to a lesser extent, in the Northern Cape Province. The level of IWS is dominated by irregular and unreliable IWS. Only 10 of the affected municipalities have implemented predictable IWS. In 55 of the 65 municipal areas reporting IWS, consumers have no knowledge of when water will be supplied. Moreover, consumers in several of these 55 municipalities have no idea of whether adequate volumes of water will be supplied (for example to fill an on-site storage tank) when the water supply comes on, due to reported drastically varying supply durations. Irregular and unreliable IWS may suggest a loss of control by the WSP. In these instances, water supply schedules are typically driven by the availability of water at the source or in reservoirs, which is unknown, rather than by a predetermined time schedule.
Additional parameters investigated
With reference to the data sources listed in Table 1, information was available on the number of water connections per province, the corresponding provincial population numbers, as well as reported causes of IWS. Further analysis of these additional parameters provided insight into the level of service and the types of IWS prevalent in South Africa.
Number of consumers per connection
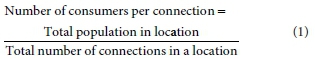
The number of consumers per connection is defined as the average number of people within a defined geographical location that access water from one piped water connection, and is calculated using Eq. 1. Figure 7 illustrates the number of consumers per connection, by province, based on the total population and number of connections for that province in a particular year. The data used in this analysis were only available from 2012 to 2017.
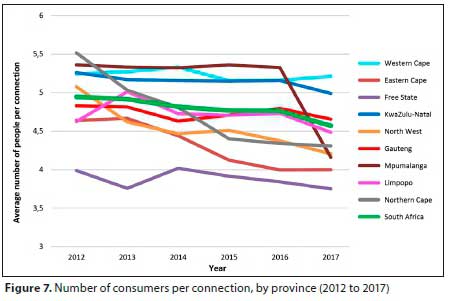
The results presented in Fig. 7 demonstrate that the number of consumers per connection ranged between 3.7 and 5.5 for each of the 6 years represented. Interestingly, the trend lines indicate a steady decline in the number of consumers per connection in most provinces, and for South Africa as a whole. During the same period, there was an increase in the population of every province in South Africa. Figure 7, therefore, indicates that an increased number of consumers gained access to piped water connections between 2012 and 2017.
Causes of IWS
Analyses of the reported causes of IWS, from the data sources listed in Table 1, clearly reflect both formal and informal IWS in South Africa. Therefore, it is apparent that some of the data sources accessed were compiled without the narrow definition of IWS as a formal management strategy. In Fig. 8, the causes of IWS are illustrated based on its frequency of occurrence over the 10 years under investigation.
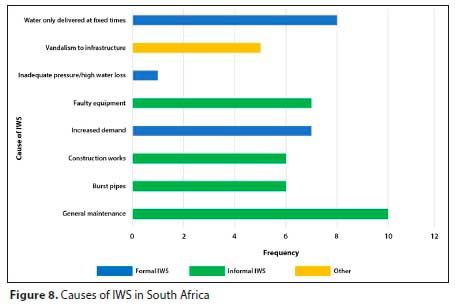
A critical review of the results presented in Fig. 8 reveals causes that point to both formal and informal IWS. The reason 'water only delivered at fixed times' is not a cause of IWS, but rather the definition of formal IWS. 'Vandalism to infrastructure' could lead to both formal and informal IWS. Where vandalism refers to malicious damage to water supply infrastructure, one can anticipate informal IWS (the water supply is interrupted without prior notification and restored once the infrastructure component is repaired). 'Vandalism to infrastructure' may also refer to illegal connections being constructed. Such illegal connections could either lead to formal IWS being implemented (water supply inadequate to fill downstream reservoirs, for example), or happen as a result of formal IWS (water not available constantly leading to consumers taking matters into their own hands). For the purpose of this research, therefore, vandalism was categorised as a reason for both formal and informal IWS (split 50-50). 'Inadequate pressure/high water loss' and 'increased demand' refers to parameters usually measured and controlled by the WSP. High water loss and increased demand would typically place pressure on available resources, which should lead to the implementation of formal IWS, rather than informal IWS. The reasons 'construction works', 'faulty equipment', 'burst pipes', and 'general maintenance' would typically lead to a temporary water supply interruption, defined as informal IWS.
DISCUSSION
Only two of the 252 WSPs in Southern Africa that were targeted with the initial survey responded to the questionnaire. Both respondents reported CWS, which was considered unsurprising. Since 1994, South African municipalities have been pressed by central government to eradicate poor water services and expand access to clean water to all citizens, especially in rural areas (Hoffman and Nkadimeng, 2016). The research team was hoping to obtain first-hand reports of IWS from some of the targeted municipalities, but the attempts were unsuccessful. Despite this poor survey response rate, the prevalence of IWS in South Africa was proven through gathering and analyses of data from selected published reports and open-access online databases, as well as news articles, social media platforms and open-access websites. Earlier studies used a similar methodology to investigate, for example, untreated greywater reuse practices during a water crisis (Nel and Jacobs, 2019) and to conduct a review of water temperature in drinking water systems across different countries (Agudelo-Vera et al., 2020).
IWS can potentially be caused by the demand exceeding the maximum hydraulic capacity ofthe pipe network (Ilaya-Ayza et al., 2016). In this study, it was observed that an apparent discrepancy exists between the increase in the population numbers with access to piped water connections (from Fig. 7), and the increasing population number affected by intermittent water supply (from Fig. 2). Although the WSPs constructed more water connections, the water resources, bulk water services and reticulation networks could not keep up with the increasing demand. Indications are also that general maintenance was often neglected (Hoffman and Nkadimeng, 2016). There appears to have been an over-emphasis on installing new water connections at the fringes of the WDS, to serve additional consumers, while neglecting maintenance, reinforcement of the upstream infrastructure and development of adequate new water resources.
The view of WSPs installing new connections without proper reinforcement of the upstream infrastructure, is supported by Maake and Holtzhausen (2015), who performed a study on water supply in the Mopani District Municipality. The infrastructure in most parts of the Mopani District Municipality was installed more than 30 years ago (Maake and Holtzhausen, 2015). At the time, the possibility of connecting rural settlements was not taken into consideration. By law, every citizen has a right to access clean water (Maake and Holtzhausen, 2015). As a result, infrastructure that was designed to serve a limited population has been stretched beyond its design capacity, in an attempt to meet the increase in water demand linked to the growing population, without the necessary upstream WDS reinforcements (Maake and Holtzhausen, 2015). The condition of the pipelines in the municipal area has deteriorated significantly, and so many illegal connections have been made that water storage in reservoirs for subsequent distribution is severely compromised (Maake and Holtzhausen, 2015).
Considering the different causes of IWS described earlier, the causes can be grouped to describe either formal or informal IWS. The combined frequency of the reasons related to formal IWS is 18.5, which represents 37%. The combined frequency of the reasons related to informal IWS is 31.5, which represents 63%. From these data it is evident that 37% of reported IWS was related to formal IWS, while 63% of reported IWS was related to informal IWS. It also suggests that in at least 37% of the cases reported, the WSP was faced with such extreme challenges, that it decided to implement IWS as a formal water supply strategy.
Amidst the Covid-19 crisis in South Africa in 2020, the national Department of Water and Sanitation (DWS) started distribution of water storage tanks and water tanker trucks as a short-term relief measure to those areas that did not have running water (3S Media, 2020). The purpose of the exercise was to improve access to clean water, leading to better personal hygiene and thus to minimise the spread of the disease. The programme involved distribution of more than 5 600 water storage tanks, and almost 250 water tankers (3S Media, 2020). Several municipalities that were earmarked to receive these storage tanks and water tankers were also identified in this study as having implemented IWS between 2015 and 2020. These include the Central Karoo District-, Johannesburg City-, Mogale City-, Amathole District-, Chris Hani District-, Phumelela Local-, Dihlabeng Local-, Maluti-A-Phofung Local-, Setsoto Local-, Mafube Local-, Nketoana Local-, Moqhaka Local-, Mangaung Local-, Metsimaholo Local-, Vhembe District-, Sekhukhune District-, Polokwane District-, Mopani District-, and the Thabazimbi Local Municipality.
Of the 19 municipalities listed above, five are district municipalities and comprise several underlying local municipalities. For example, the Chris Hani District Municipality comprises 6 local municipalities. The DWS commenced distribution of storage tanks and water tankers to several local municipalities across South Africa, of which 40 were identified during this study to have implemented IWS between 2015 and 2020. This emergency initiative by the DWS further underlines the poor access to water in some regions of South Africa.
CONCLUSION
Kumpel and Nelson (2016) used data from IBNet to compile a map of the world indicating the average hours of supply. This map indicated that South Africa practises CWS. However, results from this study are supported by earlier research (Maake and Holzhausen, 2015; and Hoffman and Nkadimeng, 2016) to confirm that South Africa is notably affected by IWS. Between 2009 and 2016, the number of peoples affected by some form of intermittent water supply increased in almost all provinces of South Africa. The estimated total population affected by intermittency in 2017 in South Africa was 22 million, which represented 39% of the total population. These figures may not represent formal IWS exclusively, but clearly suggest widespread IWS throughout South Africa.
Information obtained from open-access platforms, suggest that at least 65 of the 231 municipalities experienced some form of IWS between 2015 and 2020. The results show that 10 of these 65 municipalities practiced predictable IWS and 4 practised irregular IWS, with the majority (51 out of 65) suffering from unreliable IWS. No information was available for 134 municipalities. The municipalities for which no information was available could form the basis of future research, but it was considered unlikely that reliable information will be available on a national scale soon. More value could likely be gained by focusing on a particular problem area as a case study research site.
Fundamentally, the outcomes of this study highlight the widespread occurrence of intermittent water supply in South Africa, which is in line with the poor state of water services delivery in South Africa, as portrayed in the most recent National Water and Sanitation Master Plan (DWS, 2018).
ACKNOWLEDGEMENTS
The majority of the results presented in this paper emanated from a research project, which was partly funded by the South African National Research Foundation (NRF).
REFERENCES
AGTHOKLEOUS A and CHRISTODOULOU S (2016) The impact of intermittent water supply policies on urban water distribution networks. Procedia Eng. 162 204-211. https://doi.org/10.1016/j.proeng.2016.11.041 [ Links ]
AGUDELO-VERA C, AVVEDIMENTO S, BOXALL J, CREACO E, DE KATER H, DI NARDO A, DJUKIC A, DOUTERELO I, FISH KE, REY PLI and co-authors (2020) Drinking water temperature around the globe: understanding, policies, challenges and opportunities. Water. 12 (4) 1049. https://doi.org/10.3390/w12041049 [ Links ]
BERG S V and CORTON ML (2007) Water utility benchmarking for managerial and policy decisions: lessons from developing countries. IWA Pii08. (December 2007) 1-11. [ Links ]
BIVINS AW, SUMNER T, KUMPEL E, HOWARD G, CUMMING O, ROSS I, NELSON K, BROWN J (2017) Estimating infection risks and the global burden of diarrheal disease attributable to intermittent water supply using QMRA. Environ. Sci. Technol. 51 7542-7551. https://doi.org/10.1021/acs.est.7b01014 [ Links ]
COMMONWEALTH GOVERNANCE (2018) Utilities in South Africa. http://www.commonwealthgovernance.org/countries/africa/south_africa/utilities/ (Accessed 16 September 2019). [ Links ]
DANILENKO A, VAN DER BERG C, MACHEVE B and MOFFITT J (2014) The IBNET Water Supply and Sanitation Blue Book. https://openknowledge.worldbank.org/bitstream/handle/10986/19811/9781464802768.pdf?sequence=5. (Accessed 15 September 2019). [ Links ]
DWS (Department of Water and Sanitation, South Africa) (2019) Access to infrastructure data. URL: http://ws.dwa.gov.za/wsks/DefaultList.aspx?SubjectAreaID=2&DataTopicDetailID=39&DisplayTypeId=1&PerspectiveID=1&LvlID=10&DataTopicID=35 (Accessed 29 August 2019). [ Links ]
DWS (Department of Water and Sanitation, South Africa) (2018) National Water and Sanitation Masterplan. Department of Water and Sanitation, Pretoria. [ Links ]
EDOKPAYI JN, ROGAWSKI ET, KAHLER DM, HILL CL, REYNOLDS C, NYATHI E, SMITH JA, ODIYO JO, SAMIE A, BESSONG P and co-authors (2018) Challenges to sustainable safe drinking water: A case study of water quality and use across seasons in rural communities in Limpopo Province, South Africa. Water. 10 (2) 159. https://doi.org/10.3390/w10020159 [ Links ]
GALAITSI SE, HUBER-LEE A, VOGEL RM and NAUMOVA EN (2015) Using water insecurity to predict domestic water demand in the Palestinian West Bank. Water Int. 40 (4) 614-634. https://doi.org/10.1080/02508060.2015.1067748 [ Links ]
GALAITSI SE, RUSSELL R, BISHARA A, DURANT JL, BOGLE J and HUBER-LEE A (2016) Intermittent domestic water supply: A critical review and analysis of causal-consequential pathways. Water. 8 (7) 274. https://doi.org/10.3390/w8070274 [ Links ]
HOFFMAN DJ and NKADIMENG LM (2016) Investigating water supply challenges in the Elias Motsoaledi municipality of Limpopo Province. UPSpace, University of Pretoria. http://hdl.handle.net/2263/61144.7pp. [ Links ]
ILAYA-AYZA AE, MARTINS C, CAMPBELL E and IZQUIERDO J (2018) Gradual transition from intermittent to continuous water supply based on multi-criteria optimization for network sector selection. J. Comput. Appl. Math. 330 1016-1029. https://doi.org/10.1016/j.cam.2017.04.025 [ Links ]
IBNet (International Benchmarking Network) (2019) The International Benchmarking Network for Water and Sanitation Utilities (IBNET). http://www.ib-net.org (Accessed 7 October 2019). [ Links ]
JMP (Joint Monitoring Programme) (2020) Data. https://washdata.org/data/household#!/ (Accessed 21 September 2020). [ Links ]
KLINGEL P (2012) Technical causes and impacts of intermittent water distribution. Water Sci. Technol. Water Suppl. 12 (4) 504-512. https://doi.org/10.2166/ws.2012.023 [ Links ]
KNOEMA (2019) World Data Atlas. https://knoema.com/atlas/topics/Water (Accessed 10 October 2019). [ Links ]
KUMPEL E and NELSON KL (2016) Intermittent water supply: prevalence, practice, and microbial water quality. Environ. Sci. Technol. 50 (2) 542-553. https://doi.org/10.1021/acs.est.5b03973 [ Links ]
LOUBSER C, BASSON SE and JACOBS HE (2020) A conceptual index for benchmarking intermittent water supply in a water distribution system zone. Water SA. 46 (1) 12-21. https://doi.org/10.17159/wsa/2020.v46.i1.7873 [ Links ]
LOUBSER C and DE BRUYN J (2019) How the City of Cape Town avoided implementing intermittent water supply during the recent very severe three-year drought, Paper presented at the 1st International Conference on Intermittent Water Supply, 6-10 April 2019, Kampala, Uganda. [ Links ]
MAAKE MT and HOLTZHAUSEN N (2015) Factors affecting the provision of sustainable water services in the Mopani District Municipality, Limpopo Province. Admin. Public. 23 (4) 248-271. [ Links ]
MCKENZIE RS (2016) The Dangers Of Intermittent Supply As A Measure To Save Water In South Africa, Paper presented at the 80th Conference of The Institute of Municipal Engineering of Southern Africa (IMESA), 26-28 October 2016, East London, South Africa. [ Links ]
MOKSSIT A, DE GOUVELLO B, CHAZERAIN A, FIGUÈRES F and TASSIN B (2018) Building a methodology for assessing service quality under intermittent domestic water supply. Water. 10 (9) 1164. https://doi.org/10.3390/w10091164 [ Links ]
MUNICIPALITIES OF SOUTH AFRICA (2019) URL: https://municipalities.co.za/ (Accessed 19 August 2019). [ Links ]
NEL N and JACOBS HE (2019) Investigation into untreated greywater reuse practices by suburban households under the threat of intermittent water supply. J. Water Sanit. Hyg. Dev. 9 (4) 627-634. https://doi.org/10.2166/washdev.2019.055 [ Links ]
SHARMA SK and VAIRAVAMOORTHY K (2009) Urban water demand management: Prospects and challenges for the developing countries. Water Environ. J. 23 (3) 210-218. https://doi.org/10.1111/j.1747-6593.2008.00134.x [ Links ]
SIMUKONDA K, FARMANI R and BUTLER D (2018) Causes of intermittent water supply in Lusaka City, Zambia. Water Pract. Technol. 13 (2) 335-345. https://doi.org/10.2166/wpt.2018.046 [ Links ]
3S MEDIA (2020) Water tanks in transit to municipalities across SA. Infrastructure News, 6 April 2020. URL: https://infrastructurenews.co.za/2020/04/06/water-tanks-in-transit-to-municipalities-across-sa/ (Accessed 8 April 2020). [ Links ]
SMITH G-L (2018) Over 5 million South Africans don't have access to reliable drinking water (n.d) https://ewn.co.za/2018/01/26/over-5-million-south-africans-don-t-have-access-to-reliable-drinking-water (Accessed 12 October 2019). [ Links ]
SOYAPI CB (2017) Water security and the right to water in Southern Africa: an overview. Potchefstroom Electron. Law J. 20 1-26. https://doi.org/10.17159/1727-3781/2016/v19i0a1650 [ Links ]
STATISTICS SOUTH AFRICA (2019) SuperWEB2(tm) - Table View. http://superweb.statssa.gov.za/webapi/jsf/tableView/tableView.xhtml (Accessed 9 September 2019). [ Links ]
TOXOPEÜS M (2019) Understanding water issues and challenges II: Municipalities and the delivery of water services. Helen Suzman Foundation Briefs, Feb 06, 2019. https://hsf.org.za/publications/hsf-briefs/understanding-water-issues-and-challenges-ii-municipalities-and-the-delivery-of-water-services (Accessed 15 August 2019). [ Links ]
UNEP (2010) "Africa Water Atlas". Division of Early Warning and Assessment (DEWA). United Nations Environment Programme (UNEP), Nairobi. [ Links ]
UN (United Nations) (2014) Water scarcity. http://www.un.org/waterforlifedecade/scarcity.shtml (Accessed 12 September 2019). [ Links ]
UN (United Nations) (2016) The World's Cities in 2016 - Data Booklet (ST/ESA/ SER.A/392). United Nations, Department of Economic and Social Affairs, Population Division. [ Links ]
VAIRAVAMOORTHY K, GORANTIWAR SD and PATHIRANA A (2008) Managing urban water supplies in developing countries -climate change and water scarcity scenarios. Phys. Chem. Earth. 33 (5) 330-339. https://doi.org/10.1016/j.pce.2008.02.008 [ Links ]
VAN DEN BERG C and DANILENKO A (2014) The IBNET Water Supply and Sanitation Performance Blue Book: The International Benchmarking Network for Water and Sanitation Utilities Databook. World Bank, Washington, DC, USA. https://doi.org/10.1596/978-1-4648-0276-8 [ Links ]
 Correspondence:
Carlo Loubser
Email: carloloubser@sun.ac.za
Received: 12 April 2020
Accepted: 1 December 2020

