


Servicios Personalizados
Articulo
 Inglés (pdf)
 Articulo en XML
 Referencias del artículo
Indicadores

Links relacionados
-
 Citado por Google
 -
 Similares en Google
Compartir

 Permalink
Water SA
versión On-line ISSN 1816-7950
versión impresa ISSN 0378-4738
Water SA vol.46 no.4 Pretoria oct. 2020
http://dx.doi.org/10.17159/wsa/2020.v46.i4.9079
RESEARCH PAPER
Experimental study and numerical simulation of dam reservoir sediment release
Marzieh Fadaee; Mohammad Zounemat-Kermani
Department of Water Engineering, Shahid Bahonar University of Kerman, Kerman, Iran
ABSTRACT
In this research, experimental and numerical modelling of three-phase air, water, and sediment transport flow, due to the opening of a sluice gate was conducted in two scenarios, i.e., with and without a triangular obstacle. Numerical simulation was conducted using the Navier-Stokes equations with the aid of the volume of fluid method (VOF) to track the free surface of the fluid. For the experimental model, a glass-enclosed flume with 150 x 30 x 50 cm dimensions was used. The experiment was performed for an initial height of the water column at 20 cm and 10 cm sediment column. To evaluate the numerical model's performance, the simulation results were compared with the experimental observations using the average relative error %. The amount of relative error between experimental observations and numerical simulations, for the position and height of the wave flow for the three-phase air, water, and sediment flow, were obtained as 2.64% and 4.51% for the position and height of the water wave, and 2.23% and 2.82% for the position and height of the sediment transport, respectively, for the 'without obstacle' scenario, and 3.77% and 5.25% for the position and height of the water wave, and 2% and 7.23% for the position and height of the sediment transport, respectively, for the 'with obstacle' scenario. The findings of the study indicate the appropriate performance of the numerical model in the simulation of water and sediment wavefront advance, and also its weakness in the estimation of wave height.
Keywords: volume of fluid method, numerical model, experimental model, sluice gate, sediment transport
INTRODUCTION
A great number of dam structures have been built throughout the world. Dams play an essential role in agriculture and irrigation, water supply and storage, flood control, and hydroelectric power generation. Despite all these benefits, dams are among the factors that cause sudden flows of water and sediment (Issakhov et al., 2018). Two distinct phenomena which cause this sudden flow to happen are dam-break and opening the dam's sluice. Such rapid flows could release a tremendous amount of water and sediment from the dam reservoir over a short period, and cause irreversible consequences and also damage to the environment, such as a catastrophic flood downstream. Hence, the interactions between water and sediment transport have created an incentive for hydraulic engineers and researchers to study sudden waves on fixed-beds and mobile-beds, and wave impact problems, for several decades now (Marsooli and Wu, 2014). Sudden flow behaviour studies are conducted through experimental measurement and numerical simulation.
In recent years, through increases in computer processing potential and developments in technology, numerical simulations such as computational fluid dynamics (CFD) modelling based on the VOF method have been widely used to analyse unsteady free-surface flows like dam-break flows and sudden releases of water (Ozmen-Cagatay et al., 2014). The volume of fluid technique (VOF) was first introduced by Hirt and Nichols in 1981. This method has several benefits, in that it employs the minimum amount of information, treats intersecting free boundaries, and is able to easily extend to three-dimensional calculations; all of these aspects (Hirt and Nichols, 1981).
The first studies and analyses of sudden flows emerged during the 19th century, with Ritter's research. In 1892, Ritter presented a solution of the free-surface profile for a collapsing fluid column over a dry bed based on De Saint-Venant's shallow water condition. Bellos et al. (1992) experimentally investigated the movement of two-dimensional flood waves resulting from the immediate break of a dam on dry and wet fixed-bed conditions. Their investigation results and comparisons were satisfactory. Dam-break waves were investigated experimentally and analytically in the horizontal rectangular flume over an erodible bed by Lauber and Hager (1998). Capart and Young (1998) examined what happens when a sudden collapse of a dam occurs over a mobile granular bed. They observed a hydraulic jump that was formed near the centre of the dam-break wave.
The solution for suspended sediment transport under one-dimensional dam-break flow was presented by Pritchard and Hogg (2002). They calculated the suspended sediment concentration and investigated the end results using the depositional and erosional models. The sudden flow caused by the propagation of the dam-break wave over a mobile bed was investigated by Fraccarollo and Caper (2002). They proposed an approximate general explanation of the formative stages of erosional dam-break flows. Numerical modelling and laboratory experimental investigation of the scouring effects of flushing waves on sewer sediment deposits were conducted by Campisano et al. (2004). Comparison of the results of the numerical models and the laboratory experiments demonstrated a very good agreement with each other. A model for dam-break flow, morphological evolution, and sediment transport was presented by Cao et al. (2004). Their study appears to be one of the first studies of mobile-bed dam-break hydraulics, which was built upon the conservation laws of shallow water.
Spinewine and Zech (2007) reported a series of small-scale experimental data for the erosional behaviour of dam-break wave flow over loose granular sediment, realized in a flume equipped with a quick downward-moving gate. Soares-Frazão (2007) presented a dam-break wave experiment focused on the effect of the bed slope on dam-break wave flow over a triangular-shaped bottom sill. Experimental and numerical simulation of the dynamics of three-dimensional gravity flow was undertaken by La Rocca et al. (2008). They compared experimental and numerical results and found a logical agreement between these. Levy and Sayed (2010) used two approaches to the numerical simulation of the flow of dry granular materials around obstacles. They focused on the formation of shock waves in front of the obstacle.
A 2D morphodynamic model to simulate and predict dam-break wave propagation over mobile beds has been developed by Xia et al. (2010). In their study, the conventional 2D shallow water equations were improved; the impacts of bed evolution and sediment concentrations on flood wave propagation were examined. For modelling of dam-break flow over a mobile bed, a new mesh-free particle model was developed and presented by Shakibaeinia and Jin (2011). They applied their model to the mobile-bed dam-break issue and the obtained results were compared with experimental. Ozmen-Cagatay et al. (2014) examined the experimental and numerical simulations of a dam-break flood wave in a flume with an obstacle. The results of the numerical and experimental models indicated that numerical models represent the flow behaviour with reasonable accuracy.
Experimental analyses of a dam-break flow over a horizontal dry bed were conducted by Lobovský et al. (2014). Their results provided a vast dataset for validation of the numerical models and computational tools. The capacity of different models to determine the effects of a dam-break wave on an obstacle was studied and compared by Aureli et al. (2015). A new numerical method has been proposed by Fu and Jin (2016), who performed a comparison between experimental data and the results for bed profiles and water surface profiles. They showed that their new technique could predict sediment profile and free surface. Park et al. (2018) studied the multi-phase flow during the dam-break phenomenon. They compared the results of their model with previous studies. Di Cristo et al. (2018), by numerical and experimental models, studied the frontal effects of a sudden wave flow over a movable bed with a steep slope. The efficiency of the model was assessed by comparing the original laboratory experiment results with the numerical results.
The evolution of the free surface based on the VOF method was investigated by Khoshkonesh et al. (2019) for dam-break flows over both wet and dry beds for different conditions (e.g. different initial water level, reservoir length, and reservoir width), and ultimately compared the numerical results with the laboratory data. Issakhov and Imanberdiyeva (2019) investigated the numerical simulation of the water surface of the dam-break flow by the VOF technique for different obstacles, based on the Navier-Stokes equations. The efficiency of their model was evaluated by several laboratory tests for dam-breaks. The comparison indicated that their model results are close to the experimental data.
In another study, Issakhov and Zhandaulet (2020) proposed a new model based on the VOF approach and the Navier-Stokes equations for forecasting the dam-break flow effects over a mobile bed. They examined their model using a number of dam-break laboratory experiments. Munoz and Constantinescu (2020) simulated a 3D dam-break flow model based on the VOF method and compared it with experimental data. They found a good agreement between their model and the results of experiments carried out in the laboratory. Wang et al. (2020) investigated both physical and numerical models of dam-break flows over the initially wet bed in a smooth and horizontal flume for different upstream water depths. Their investigation indicated that their numerical simulations were in satisfactory agreement with the experimental results.
This study aims to discuss the experimental and numerical simulation of water and sediment flows due to the sudden release of water, which resembles the complete opening of a dam's reservoir sluice gate. For the experimental model, this work presents two scenarios for recent experiments on a sudden release of water in a rectangular flume, for validation of numerical methods. The first scenario involved a triangular-shaped obstacle located downstream, and the second scenario involved carrying out the same experiment without an obstacle. For the numerical simulation, the volume of fluid (VOF) method based on Reynolds-averaged Navier-Stokes equations was used to model this rapid unsteady flow over an obstacle, to track water surface changes and sediment surface changes. Non-cohesive sediment was used to compose bed reservoir sediments. Finally, the model results for water surface profiles and sediment surface profiles and the behaviour of the interface region of water and sediment are compared with experimental data for both scenarios. Because of the arduousness of gathering field data for such flows, this study's experimental data may be beneficial for other numerical researchers to validate their models in the future. The experimental setup, numerical methods, governing equations, and validations of the models are presented in the following sections.
MATERIALS AND METHODS
Experimental model
The dam-break scenario is a typical example of unsteady flow behaviour. To better understand this behaviour and also to validate the numerical results of the study, the laboratory model was constructed at the Hydraulics Laboratory of Water Engineering Department at the Shahid Bahonar University of Kerman in Iran. A rectangular flume, 150 cm long, 50 cm high, and 30 cm wide, with a smooth glass bottom and side walls, was constructed to conduct the experiments (Fig. 1). The distance of the sluice gate from the tank edge was fixed at 40 cm in the lab flume.
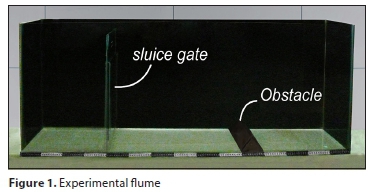
During the experiments, clean and fresh water was used at ambient temperature. The water was coloured by Methylene Blue in order to clarify the observation and measurement of flow direction in the flume. Before each experiment, the floor and walls were completely dried to allow the tests to be performed in a dry bed. The side view and top view of the schematic arrangement of the experimental model are illustrated in Fig. 2.
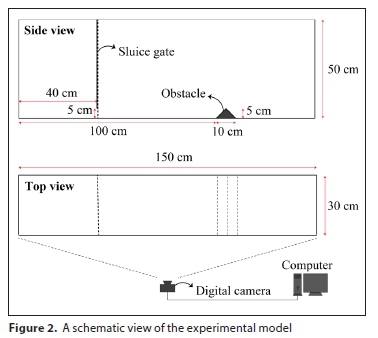
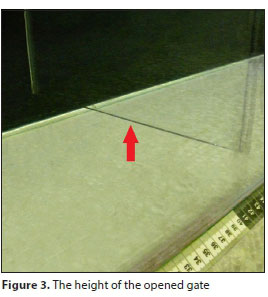
In this study, three-phase flow - air, water, and sediment - was investigated. To this aim, the bottom surface of the reservoir was covered by uniform sediment material. The height of the sediment column was 10 cm, and the height of the water column was tested at 20 cm (10 cm over the sediment). The height of the opened gate was 5 cm (Fig. 3). The experiments were conducted for two scenarios - 'with an obstacle' and 'without obstacle' - for the flow of water and sediment due to the sudden opening of the sluice gate.
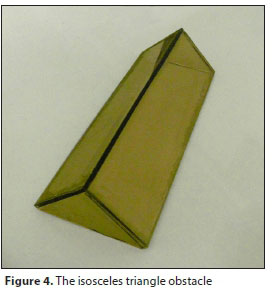
In these experiments, an isosceles triangle-shaped obstacle with a right angle and 5 cm height, located at a distance of 100 cm from the start of the laboratory flume, was used (Fig. 4).
To analyse the observations, the water surface and sediment profiles were recorded using a CMOS digital camera capable of continuous shooting with 60 frames per second. Afterwards, the data were transferred to a computer to process the images in order to observe the behaviour of the flow. Finally, the free-surface profile position of the three-phase flow of air, water, and sediment was determined.
To consider the gate removal as 'sudden removal', the removal time must be shorter than:
where h0is the initial depth and g is gravitational acceleration (Lauber and Hager, 1998). In these experiments, the gate removal time was determined from the camera records to be about 0.03 s; therefore, according to this equation (t < 0.2), it is considered as 'sudden removal'.
Sediment specifications
The sediment that was selected for this experimental study was washed with clear water, so there was no silt/clay in it. Sediment gradation was determined in the Soil Mechanics Laboratory by the results of a sieve analysis, which is one of the basic analyses for determining sediment size by the American Society for Testing and Materials (ASTM) standard (Das and Sobhan, 2013). Materials that were used as sediments for the experiments in this model were 'non-cohesive washed-sand' with a specific gravity of 2.65. Different samples were chosen from the washed-sand for sieve analysis to obtain the grain size distribution. For achieving this curve, 7 different sieve sizes were used (e.g. sieve NO. 4, 8, 16, 30, 50, 100, 200). The grain size distribution curve provided from the results of laboratory tests on the sediment is shown in Fig. 5.
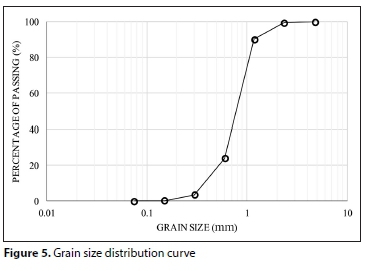
The coefficient of uniformity, Cu, and the coefficient of curvature, Cc, were obtained from the grain size distribution curve. According to the results of this curve, D10, D30, and D60 were 0.42, 0.65, and 0.89 mm, respectively. The coefficient of uniformity and the coefficient of curvature were calculated to be 1.55 and 1.13, respectively. The results showed that the sediments used in this study were poorly graded.
Governing equations
In this research, the VOF method was used to simulate the flow of water and sediment transport. The sediment phase was considered as a very viscous fluid phase. Generally, the flow of viscous fluid was solved using the Navier-Stokes equations. These fundamental equations encompass mass conservation and momentum. Integral equations for conservation of mass and momentum are expressed by the following formula (Kazemi-Lari et al., 2011):
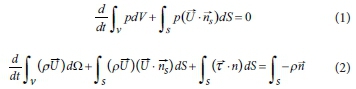
In these equati on s, p is the density of the fluid, t is time, T is tension vector, U is the vector of velocity, n is the normal vector, V is control volume, and S is the control surface.
The differential form of the above equations is as follows:
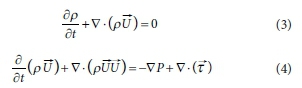
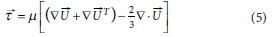
Shear stress (t) is given as (Kazemi-Lari et al., 2011):
Numerical model
In recent times, due to the high cost of experimental models, numerical models have become more crucial. Therefore, several numerical models have been developed and widely used in recent years to study the dam-break phenomenon. In this paper, the possibility of using computational fluid dynamics models using the VOF method, for multi-phase flow with free-surface due to the dam's sluice gate opening, is discussed.
The VOF method is used for simulation of two-phase or multi-phase flows in which different phases have recognizable boundaries. For instance, free-surface flow is a two-phase flow with air phases separated from the water phase by a free surface. Modelling using CFD usually encompasses four phases: geometry generation, meshing, governing equations, and solving these equations. Solving equations of fluid mechanics is one of the most prominent issues in engineering sciences. Generally, equations of fluid mechanics generate a set of dependent non-linear partial differential equations that should be solved in a non-smooth domain by different initial and boundary conditions. In most cases, analytic solutions of differential equations are limited. The use of numerical methods with the availability of improved computer processing potential is significant, and offers an efficient tool for the design of engineering equipment.
In the present study, a two-dimensional model of water-sediment flow was developed using the commercial flow simulation CFX software package. The basic equations of mass and momentum conservation were solved for each phase. In order to mimic the experimental model conditions, the equivalent conditions of this model were implemented in CFX software. In this software, to solve this multiphase flow, the homogeneous model was used. A fixed uniform mesh was chosen. To select a mesh size (Ax), primary studies were implemented with several mesh sizes to realize the impact of mesh sizes. Finally, the optimal mesh size value was determined to be 8 mm. This grid size was used as a fixed rectangular cell with Cartesian coordinates and uniform mesh size in both the x and y directions for the entire computational domain. In the computational procedure, the adaptive time steps were determined by the maximum value of the Courant number (Cr). According to this criterion, time steps (Aí) were selected between 0.5 s and 0.001 s (0.001 < At < 0.5) to preserve the numerical stability of the model in all stages of the process. The total run time of each model was about tt= 20 s, and it was started from zero time (t0 = 0).
In this numerical simulation, as mentioned before, the non-cohesive granular sediment was defined as a very high viscosity fluid. The physical parameters of water and sediment, such as density and dynamic viscosity, used in this numerical simulation were assumed as pw= 1 000 kg/m3 and μw= 0.001 Pa/s for the water phase, and ps= 1 750 kg/m3 and μs= 2 000 Pa/s for the sediment phase, respectively (Manenti et al. 2012). To implement the numerical model, a computer with 4 GB RAM and Intel i5 2.40 GHz processor was used.
In this research, the results of the experimental model and numerical simulation of flow due to sudden opening of a dam's sluice were compared. Both modelling results are discussed in the following section.
Initial and boundary conditions
For the initial and boundary conditions of the model, velocity and pressure were defined. The velocity at the initial moment was equal to zero, and the hydrostatic pressure distribution was due to the height of the static water behind the gate. The geometric boundary conditions of the bed and sidewalls were assigned as solid. The surface level, as the upper boundary, was considered a free-surface in direct contact with the atmospheric pressure.
The flume bed was horizontal and composed of non-cohesive uniform sediment. The physical conditions, such as the total water and sediment depth and length of the flume and also sediment specifications, were defined to be the same as the experimental model conditions. All simulations were started from a state of rest over the entire computational domain.
RESULTS AND DISCUSSION
In the present research, the experiments were conducted for two scenarios: In the first scenario, the experiment was carried out without an obstacle. In the second scenario, a triangular obstacle at a defined distance from the initial dam wall was used in the tests. At the early stages, after the gate removal, the water-sediment wave is propagated over the downstream bed. The most frontward point of the wave that goes in a downstream direction on the bed of the flume is considered as the 'wavefront' position. It should be noted that for distinguishing the wavefront position, the depth threshold was defined as 1 mm. The wavefront height was obtained as the maximum height of the water level (dam-break wave) at each time stage.
In this section, the results of each test, including free surface profiles, graphs, and relative error tables, are presented. In addition, the results of the laboratory experiments and numerical model are compared.
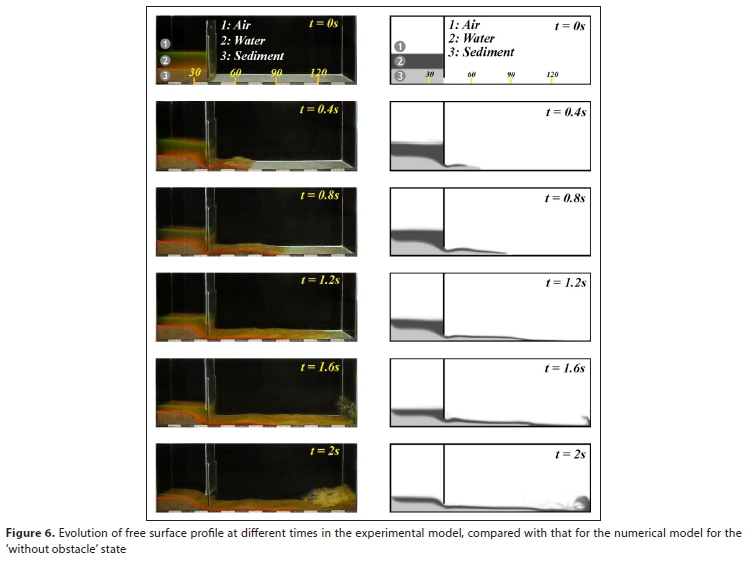
At first, to better understand the flow situation, the results of the experimental and numerical models are reported using photos for different time steps. The domain and the name of each phase is given in the first frame of each scenario (t = 0). The sketched lines on the photos for the experimental model were carefully drawn manually, with 0.1 mm accuracy, in the GNU Image Manipulation Program (GIMP) software, which is a high-quality platform image editor.
The trend of the free surface profile of water and sediment stream due to the sudden opening of the sluice gate, and the progression of the wavefront downstream at times 0, 0.4, 0.8, 1.2, 1.6, and 2 s, for both scenarios; without obstacle and with a triangular obstacle, is presented in Figs 6 and 7, respectively. It should be noted that in these experiments the height of the water column was 20 cm, and the height of the sediment column was 10 cm.
After the dam gate's sudden removal, the water flowed out along the dry horizontal bed in a downstream direction. In both numerical and experimental models, in the first state (without obstacle), at time t = 1.6 s, the front wave of water collided with the dam wall and propagated backwards. In the second state (with a triangular obstacle), at time t = 1.2 s, water, and at time t = 1.6 s, sediment, reached the obstacle. The water column passed over the obstacle; however, the sediment stayed behind it. In this state, at time t = 2 s, the front wave reflected against the dam wall and propagated in an upstream direction.
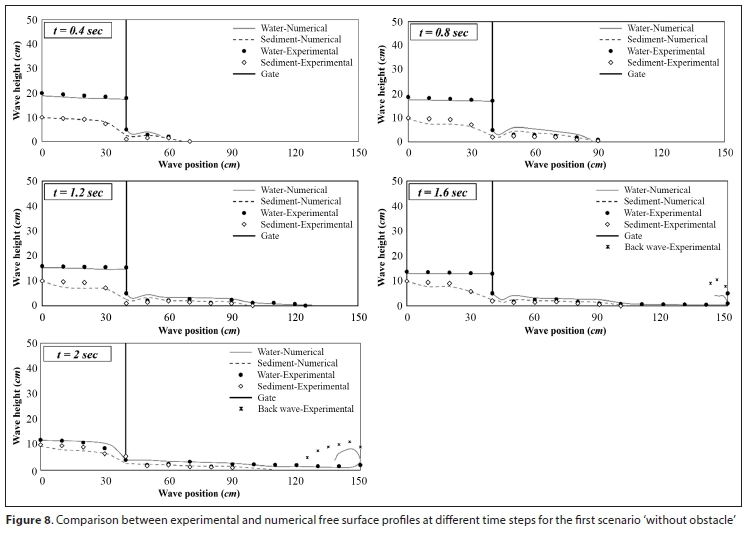
Measurements of the profiles of water surface and sediment were traced using Digimizer, an image analysis software package, which is simple to use for image analysis and allows precise manual measurements. The water surface and the water depth profile graphs at various times for both the numerical and experimental models are shown in Figs 8 and 9.
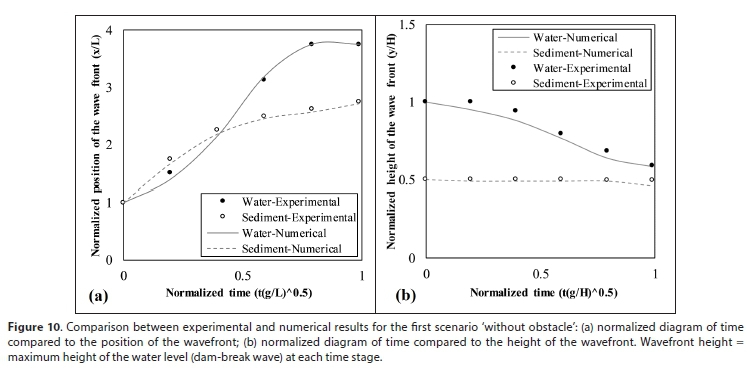
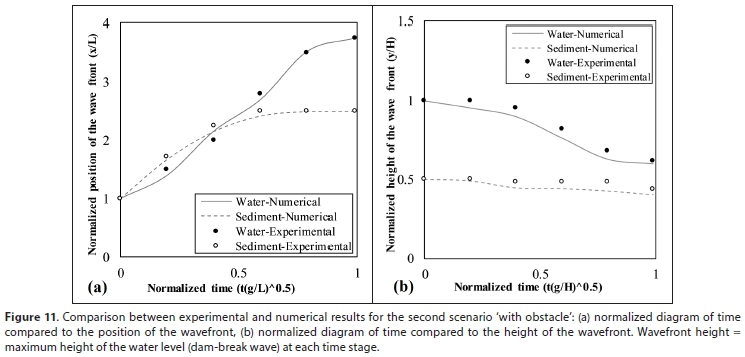
To more accurately compare the experimental data and the numerical results for the water-sediment flow, the position and height of the wavefront at different time steps, in dimensionless form, are demonstrated in Figs 10 and 11.
The dimensionless time is given by T =  for water depth and T =
  for wave distance, where t is time step, x is wave distance in time step, y is wave height in time step, H is the initial height (H = h0), L is the initial distance of the wave, and g is the acceleration due to gravity. Figures 10 and 11 show that the numerical model can reasonably predict the experimental observations, though it can predict the wave distance better than the wave height.
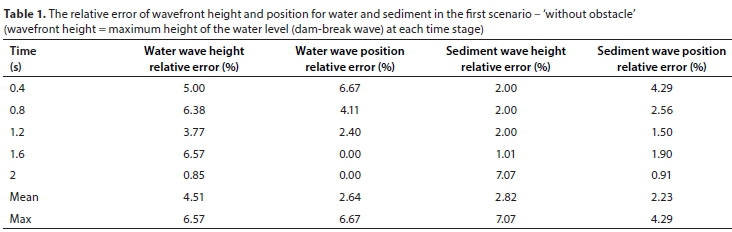
The average percentages of relative error for water and sediment height and position of wave flow, due to the sudden opening of the sluice gate in two scenarios, without obstacle and with a triangular obstacle, are presented in Tables 1 and 2 at time steps of 0.4, 0.8, 1.2, 1.6 and, 2 s. In general, the relative error of the wave position of water and sediment is acceptable (less than 3% for the water phase and less than 2.5% for the sediment phase). Hence, it can be concluded that the numerical model for this flow achieved an appropriate performance in the simulation of the position of the water and sediment wave. However, there is a slightly greater difference between the experimental and numerical results for the height of the water wave than the sediment wave (less than 5% for the water phase and less than 3% for the sediment phase.)
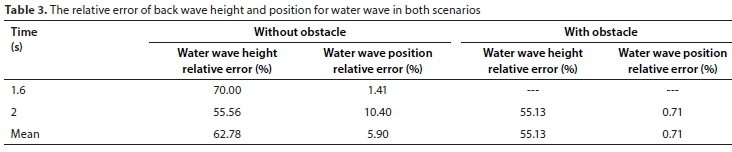
Regarding the effect of the obstacle on the transference of sediment downstream, in both scenarios (with and without obstacle), the percentage of the sediment transported from the obstacle location has been calculated. The results indicate that the triangular obstacle prevented the transfer of about 15% of the sediment downstream. In the case of the back-wave reflection due to the sudden opening of the dam's sluice gate, the average percentage relative error of the height and position of the water wave was also determined. It should be noted that the sediment flow had not reached the downstream wall during the test time; therefore, the back wave had not formed for the sediment wave. The results are presented in Table 3. The mean relative error percentages of position and height of the back wave of water are 5.90% and 62.78%, respectively, for the 'without obstacle' scenario. Moreover, for the 'with obstacle' scenario, the relative error of position and height of the back wave of water has been calculated as 0.71% and 55.13%, respectively. As can be seen in this simulation, the back wave relative error was higher than the front wave relative error, and the numerical model has a weaker performance compared to the experimental model.
CONCLUSIONS
In the present article, experimental and numerical results of water-sediment dam-break flow modelling which are characterized by the Navier-Stokes equation with free surface based on the VOF method, in two scenarios, i.e., without obstacle and with an obstacle, are presented. Both experiments were carried out with non-cohesive washed-sand as bed reservoir sediment. The experimental observations and numerical results obtained were compared and assessed using the mean relative error. In general, the results show that the water and sediment level height and wave position for the front wave of both scenarios are in good agreement with the experimental data obtained in the paper.
REFERENCES
AURELI F, DAZZI S, MARANZONI A, MIGNOSA P and VACONDIO R (2015) Experimental and numerical evaluation of the force due to the impact of a dam-break wave on a structure. Adv. Water Resour. 76 29-42. https://doi.org/10.1016/j.advwatres.2014.11.009 [ Links ]
BELLOS CV, SOULIS V and SAKKAS JG (1992) Experimental investigation of two-dimensional dam-break induced flows. J. Hydraul. Res. 30 (1) 47-63. https://doi.org/10.1080/00221689209498946 [ Links ]
CAPART H and YOUNG DL (1998) Formation of a jump by the dam-break wave over a granular bed. J. Fluid Mech. 372 165-187. https://doi.org/10.1017/S0022112098002250 [ Links ]
CAMPISANO A, CREACO E and MODICA C (2004) Experimental and numerical analysis of the scouring effects of flushing waves on sediment deposits. J. Hydrol. 299 (3-4) 324-334. https://doi.org/10.1016/S0022-1694(04)00371-3 [ Links ]
CAO Z, PENDER G, WALLIS S and CARLING P (2004) Computational dam-break hydraulics over erodible sediment bed. J. Hydraul. Eng. 130 (7) 689-703. https://doi.org/10.1061/(ASCE)0733-9429(2004)130:7(689) [ Links ]
DAS BM and SOBHAN K (2013) Principles of Geotechnical Engineering. Cengage Learning, Stamford, CT. [ Links ]
DI CRISTO C, EVANGELISTA S, GRECO M, IERVOLINO M, LEOPARDI A and VACCA A (2018) Dam-break waves over an erodible embankment: experiments and simulations. J. Hydraul. Res. 56 (2) 196-210. https://doi.org/10.1080/00221686.2017.1313322 [ Links ]
FENT I, ZECH Y and SOARES-FRAZÃO S (2019) Dam-break flow experiments over mobile bed: velocity profile. J. Hydraul. Res. 57 (1) 131-138. https://doi.org/10.1080/00221686.2018.1444677 [ Links ]
FRACCAROLLO L and CAPART H (2002) Riemann wave description of erosional dam-break flows. J. Fluid Mech. 461 183-228. https://doi.org/10.1017/S0022112002008455 [ Links ]
FU L and JIN YC (2016) Improved multiphase Lagrangian method for simulating sediment transport in dam-break flows. J. Hydraul. Eng. 142 (6) 04016005. https://doi.org/10.1061/(ASCE)HY.1943-7900.0001132 [ Links ]
HIRT CW and NICHOLS BD (1981) Volume of fluid (VOF) method for the dynamics of free boundaries. J. Comput. Phys. 39 (1) 201-225. https://doi.org/10.1016/0021-9991(81)90145-5 [ Links ]
ISSAKHOV A and IMANBERDIYEVA M (2019) Numerical simulation of the movement of water surface of dam break flow by VOF methods for various obstacles. Int. J. Heat Mass Transfer 136 1030-1051. https://doi.org/10.1016/j.ijheatmasstransfer.2019.03.034 [ Links ]
ISSAKHOV A and ZHANDAULET Y (2020) Numerical study of dam break waves on movable beds for complex terrain by volume of fluid method. Water Resour. Manage. 34 (2) 463-480. https://doi.org/10.1007/s11269-019-02426-1 [ Links ]
ISSAKHOV A, ZHANDAULET Y and NOGAEVA A (2018) Numerical simulation of dam break flow for various forms of the obstacle by VOF method. Int. J. Multiphase Flow 109 191-206. https://doi.org/10.1016/j.ijmultiphaseflow.2018.08.003 [ Links ]
KAZEMI-LARI MA, KHAJEHPOUR S, KIANI F and AKBARI M (2011) Complete Guide of Modeling and Analysis of Computational Fluid Dynamics by ANSYS-CFX (1st edn). Abed, Tehran (in Persian). [ Links ]
KHOSHKONESH A, NSOM B, GOHARI S and BANEJAD H (2019) A comprehensive study on dam-break flow over dry and wet beds. Ocean Eng. 188 106279. https://doi.org/10.1016/j.oceaneng.2019.106279 [ Links ]
LA ROCCA M, ADDUCE C, SCIORTINO G and PINZON AB (2008) Experimental and numerical simulation of three-dimensional gravity currents on smooth and rough bottom. Phys. Fluids 20 (10) 106603. https://doi.org/10.1063/L3002381 [ Links ]
LAUBER G and HAGER WH (1998) Experiments to dambreak wave: Horizontal channel. J. Hydraul. Res. 36 (3) 291-307. https://doi.org/10.1080/00221689809498620 [ Links ]
LEVY A and SAYED M (2008) Numerical simulations of the flow of dilute granular materials around obstacles. Powder Technol. 181 (2) 137-148. https://doi.org/10.1016/j.powtec.2006.12.005 [ Links ]
LOBOVSKÝ L, BOTIA-VERA E, CASTELLANA F, MAS-SOLER J and SOUTO-IGLESIAS A (2014) Experimental investigation of dynamic pressure loads during dam break. J. Fluids Struct. 48 407-434. https://doi.org/10.1016/j.jfluidstructs.2014.03.009 [ Links ]
MANENTI S, SIBILLA S, GALLATI M, AGATE G and GUANDALINI R (2012) SPH simulation of sediment flushing induced by a rapid water flow. J. Hydraul. Eng. 138 (3) 272-284. https://doi.org/10.1061/(ASCE)HY.1943-7900.0000516 [ Links ]
MARSOOLI R and WU W (2014) Three-dimensional numerical modeling of dam-break flows with sediment transport over movable beds. J. Hydraul. Eng. 141 (1) 04014066. https://doi.org/10.1061/(ASCE)HY.1943-7900.0000947 [ Links ]
MUNOZ DH and CONSTANTINESCU G (2020) 3-D Dam break flow simulations in simplified and complex domains. Adv. Water Resour. 103510. https://doi.org/10.1016/j.advwatres.2020.103510 [ Links ]
OZMEN-CAGATAY H, KOCAMAN S and GUZEL H (2014) Investigation of dam-break flood waves in a dry channel with a hump. J. Hydro-Environ. Res. 8 (3) 304-315. https://doi.org/10.1016/j.jher.2014.01.005 [ Links ]
PARK KM, YOON HS and KIM MI (2018) CFD-DEM based numerical simulation of liquid-gas-particle mixture flow in dam break. Commun. Nonlinear Sci. Numer. Simul. 59 105-121. https://doi.org/10.1016/j.cnsns.2017.11.010 [ Links ]
PRITCHARD D and HOGG AJ (2002) On sediment transport under dam-break flow. J. Fluid Mech. 473 265-274. https://doi.org/10.1017/S0022112002002550 [ Links ]
SHAKIBAEINIA A and JIN YC (2011) A mesh-free particle model for simulation of mobile-bed dam break. Adv. Water Resour. 34 (6) 794-807. https://doi.org/10.1016/j.advwatres.2011.04.011 [ Links ]
SOARES-FRAZÃO S (2007) Experiments of dam-break wave over a triangular bottom sill. J. Hydraul. Res. 45 (sup1) 19-26. https://doi.org/10.1080/00221686.2007.9521829 [ Links ]
SPINEWINE B and ZECH Y (2007) Small-scale laboratory dam-break waves on movable beds. J. Hydraul. Res. 45 (sup1) 73-86. https://doi.org/10.1080/00221686.2007.9521834 [ Links ]
WANG B, LIU W, WANG W, ZHANG J, CHEN Y, PENG Y, LIU X and YANG S (2020) Experimental and numerical investigations of similarity for dam-break flows on wet bed. J. Hydrol. 583 124598. https://doi.org/10.1016/j.jhydrol.2020.124598 [ Links ]
XIA J, LIN B, FALCONER RA and WANG G (2010) Modelling dam-break flows over mobile beds using a 2D coupled approach. Adv. Water Resour. 33 (2) 171-183. https://doi.org/10.1016/j.advwatres.2009.11.004 [ Links ]
 Correspondence:
Mohammad Zounemat-Kermani
Email: zounemat@uk.ac.ir
Received: 15 June 2019
Accepted: 14 August 2020

