


Services on Demand
Article
 English (pdf)
 Article in xml format
 Article references
Indicators

Related links
-
 Cited by Google
 -
 Similars in Google
Share

 Permalink
Water SA
On-line version ISSN 1816-7950
Print version ISSN 0378-4738
Water SA vol.46 n.4 Pretoria Oct. 2020
http://dx.doi.org/10.17159/wsa/2020.v46.i4.9078
RESEARCH PAPER
An empirical analysis of residential meter degradation in Gauteng Province, South Africa
Ryan FourieI; Annlizé L MarnewickI; Nazeer JosephII
IPostgraduate School of Engineering Management, University of Johannesburg, Johannesburg, South Africa
IIDepartment of Applied Information Systems, School of Consumer Intelligence and Information Systems, University of Johannesburg, Johannesburg, South Africa
ABSTRACT
Understanding the degradation rates of water meters assists utilities in making informed management decisions regarding meter replacement programmes and meter technology selection. This research evaluated the performance of 200 residential meters of two different technologies commonly used in Gauteng, South Africa, namely velocity meters and volumetric meters. This was done by conducting empirical meter testing in a verification laboratory and evaluating the degradation accuracy of each meter technology based on age and volume. Results indicate that velocity meters experience an accuracy degradation rate of approximately -1.13% per 1 000 kL of volume passed through the meter and an inferred initial error of -10.80%. Meter accuracy was not strongly related to age of the velocity meters tested. Volumetric meters did not exhibit a strong link with either age or accumulated volume, indicated by a loose grouping of results. These results indicate that accumulated volume of a velocity meter is a more reliable predictor of accuracy than age, and should be used when planning replacement strategies for velocity meters. Additionally, the lack of predictable degradation rates related to either age or accumulated volume for volumetric meters indicates that the accuracy of volumetric meters is primarily affected by other external factors, such as particulates or entrained air in the water network. These findings will assist utility managers in predicting the accuracy of their meter fleet and in making informed decisions regarding meter replacement.
Keywords: water meter degradation, residential meters, apparent losses, meter replacement, empirical analysis
INTRODUCTION
South Africa is a country with water challenges. The estimated per capita water resource available is 1 289 m3 per year, categorising South Africa as a water-stressed region (Du Plessis and Hoffman, 2015). The average rainfall of 450 mm/year is also below the global average of 780 mm/year (Water, 2011). From 2015-2017, the City of Cape Town experienced its worst drought of this century prompting the government to issue an alert for 'Day Zero' when water supply to homes was expected to be switched off (Sousa et al., 2018). This disaster was averted through interventions by the city, farmers and much-needed rainfall. However, the recurrences of extreme droughts such as this are increasing as global warming affects rainfall patterns (Sousa et al., 2018).
The International Water Association (IWA) Performance Indicator system has become a worldwide reference to evaluate the performance of a utility, since its first appearance in 2000 (Alegre et al., 2006). Apparent losses are defined by the IWA as water delivered to a consumer but not billed for, and form a key component of non-revenue water (NRW). Although apparent losses only comprise a small proportion of the volume of total water lost, they comprise a much larger proportion of the revenue loss of a utility, up to 69% oftotal NRW by value in some cases (Arregui et al., 2018a). This is because apparent losses are valued at the retail cost of water, which may be up to 40 times higher than the production cost used for real losses (Thornton et al., 2008; Ncube and Taigbenu, 2015).
Research has shown that the largest contribution towards apparent losses can be attributed to water meter inaccuracies (Ncube and Taigbenu, 2015; Moahloli et al., 2019). These can be due to faulty meters, meters that have been clogged or broken, or meters that have lost accuracy due to wear and tear over their lifespan (Mutikanga et al., 2011a).
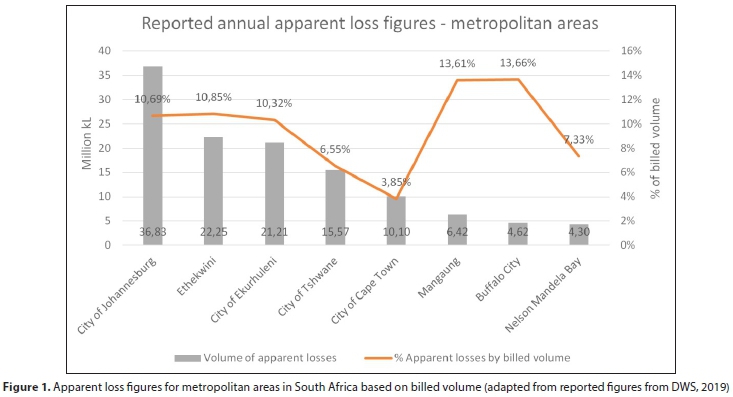
In South Africa, the figure for apparent losses is largely unknown. The estimated NRW figure in 2012 was 36.1% of total water supplied (McKenzie et al., 2012). This research also estimated apparent losses to be 25% of total water loss. An analysis of the reported figures for apparent losses from some of the major metropolitan areas in South Africa demonstrates this uncertainty and also highlights the importance of considering apparent losses in non-revenue water management. In five of the eight major metropolitan regions in South Africa, apparent losses are estimated to exceed 10% of billed volume. In Gauteng, the three major metropolitan regions of Johannesburg, Ekurhuleni and Tshwane estimate a total apparent loss of 73.61 million kL/a. These figures can be seen in Fig. 1 (DWS, 2019).
In most utilities, residential meters make up the largest proportion of consumer meters (Van Zyl, 2011; Mbabazi et al., 2015; Arregui et al., 2018a). These also constitute the largest revenue component of many utilities up to 80% in some cases (Yee, 1999; Mbabazi et al., 2015; Arregui et al., 2018a). A residential meter that is aged or faulty is a problem for a utility as it greatly reduces their revenue generation capacity.
Effective strategies for residential water meter replacement are one of the primary management problems facing water utilities in South Africa when it comes to reducing apparent losses. In South Africa, the average replacement age of a water meter is 20 years and policies for the monitoring and condition assessment of residential water meters are uncommon (Couvelis and Van Zyl, 2012b). This results in a network of meters with unknown accuracy levels being used to bill clients for services provided. It is generally accepted that meters experience a downward trend in accuracy over time (Yee, 1999; Stoker et al., 2012). This means that as the meter ages, the utility is not able to charge for the full volume of the water delivered to the consumer.
An additional consideration is that of meter technology. Comparisons of meter technologies have been performed elsewhere in Africa. Mbabazi et al. (2015) compared the performance of the meter technologies available in Uganda. They found that volumetric meters degrade more rapidly with age than velocity meters do. Mutikanga et al. (2011) also found that volumetric meters are less suitable for conditions in Uganda than velocity meters and recommend that any new meter replacements be velocity meters. In South Africa, however, there is limited data available that directly compares different metering technologies (Couvelis and Van Zyl, 2015; Ncube and Taigbenu, 2015).
A utility that understands the rate at which their residential meters lose accuracy would have a better understanding of the overall performance of their meter population. This would allow them to predict the losses related to meter inaccuracies and plan a replacement schedule for their meters to optimise economic value (Fantozzi, 2009). A comparison of meter technologies would also allow utilities to make informed meter selection decisions.
This research focused specifically on the two most commonly used 15 mm size residential meters in South Africa, namely velocity meters and volumetric meters. These two meter technologies constitute the bulk of residential water meters installed in South African and African water networks (Couvelis and Van Zyl, 2015; Ncube and Taigbenu, 2015). The aim of this research was to determine the effect that age and accumulated volume have on the residential water meters commonly used in South Africa. The intention was that utilities will be able to use this information to design their replacement strategies and select the correct meter type for their application.
Literature review
Residential-sized meters, particularly those with a 15 mm nominal diameter, usually constitute the vast majority of all meters installed in utility networks globally (Van Zyl, 2011; Mbabazi et al., 2015; Arregui et al., 2018a). Additionally, these meters constitute the largest revenue component of many utilities, up to 80% of total water billed in some cases (Yee, 1999; Mbabazi et al., 2015; Arregui et al., 2018a).
In South Africa, two residential meter technologies are dominant. These two technologies are the oscillating piston-type volumetric meter and the multijet-type velocity meter (Couvelis and Van Zyl, 2015; Ncube and Taigbenu, 2015). There is limited information in other African countries, with the exception of Uganda, where these two technologies are also common (Mutikanga et al., 2011b).
Research shows that these two metering technologies have differing performance characteristics over time and differ in external events susceptibility. Of these two meter technologies, the volumetric meter generally has better low-flow characteristics and a larger measuring range when new (Van Zyl, 2011). However, a volumetric meter also has a higher susceptibility to external factors such as particulates or air in the water network (Mutikanga et al., 2011b; Mbabazi et al., 2015). Volumetric meters have also been found to deteriorate faster than velocity meters in some cases (Mbabazi et al., 2015). This has led some researchers to conclude that these meters are unsuitable for intermittent systems and those with water quality issues (Mutikanga et al., 2011b; Couvelis and Van Zyl, 2015; Mbabazi et al., 2015).
Despite this evidence, the volumetric meter is still the most prevalent water meter technology in South Africa, constituting up to 90% of all meters in the network in some cases (Couvelis and Van Zyl, 2015). In Uganda, the volumetric meter technology comprises 76% of the meter fleet (Mutikanga et al., 2011b).
The purpose of a water meter is to measure and record the volume of water that passes through it. However, mechanical water meters are not accurate at all flow rates (Arregui et al., 2007). Certain flow rates are too low or high for a water meter to register accurately or at all (Mukheibir et al., 2012). In addition, different meter technologies, manufacturers and different meters of the same type may exhibit different accuracy characteristics (Arregui et al., 2011).
In South Africa, the standard that governs the sale of cold potable water meters below 100 mm in diameter is SANS 1529-1:2006 (SABS, 2006). This standard is based on the ISO 4064-1 standard commonly used internationally (ISO, 2014). The purpose of this standard is to provide a reference for meter manufacturers and producers. It highlights required accuracy tolerances that new and used water meters need to conform to for resale. It also explains testing procedures and sets limits for uncertainty and flow rates at which each meter needs to be tested.
In order to accommodate different accuracy characteristics of different meters, the SANS 1529-1 standard defines an accuracy envelope (Van Zyl, 2011). There is a lower zone where the relative error of the meter cannot exceed 5% and an upper zone where the relative error of the meter cannot exceed 2%. For used meters, the relative error is relaxed slightly to 3.5% for the upper zone and 8% for the lower zone (South African Bureau of Standards, 2006; Van Zyl, 2011). These zones of accuracy are bounded by key flow rates where each meter is tested.
The key flow rates can be explained as follows:
• Minimum flow rate (qmin): This is the lowest flow rate for which accuracy requirements are defined. At the minimum flow rate, each meter should have a relative error not exceeding 5% for new meters and 8% for used meters.
• Transitional flow rate (q): This is the point on the flow curve where the relative error transitions from the lower zone into the upper zone. At the transitional flow rate, the relative error should not exceed 2% for new meters and 3.5% for used meters.
• Permanent flow rate (qp): This is the flow rate at which the meter is capable of operating continuously and is often the flow rate that is used when selecting a water meter for an application (Van Zyl, 2011). At the permanent flow rate, the relative error should not exceed 2% for new meters and 3.5% for used meters.
• Maximum flow rate (qs): The maximum flow rate is the maximum flow rate that the meter can withstand for short periods without damage. This flow rate is equal to double the permanent flow rate. At the maximum flow rate, the maximum relative error should also not exceed 2% for new meters and 3.5% for used meters.
There are three primary causes for a meter to inaccurately register the water flowing through it. The first is low-flow consumption. This is a phenomenon that influences the consumer usage profile causing a larger proportion of water usage to occur at flow rates that are below the accuracy envelope of the meter. This results in the meter registering inaccurate or no consumption (Fantozzi, 2009; Ncube and Taigbenu, 2016). This is usually caused by incorrectly sized meters or low-flow leakage (Couvelis and Van Zyl, 2015; Ncube and Taigbenu, 2016).
The second cause is external factors that cause the meter to function outside its design parameters resulting in damage to the meter. Examples of external factors include particulates in the water, entrained air in the water network and flow rates that exceed the water meter's maximum capacity (Criminisi et al., 2009; Buck et al., 2012; Chadwick, 2018). External factors can cause a meter to become inaccurate or completely fail (Mutikanga et al., 2011b).
The third cause is meter degradation. Meter degradation refers to the gradual deterioration of accuracy of mechanical water meters over time (Davis, 2005). This is a common phenomenon of mechanical water meters and is a primary driver for meter replacement in some utilities (Fontanazza et al., 2012; Shields et al., 2012; Ncube and Taigbenu, 2018). Meter degradation is the primary focus of this research. Low-flow leakage and abnormal events, while significant, are a function of the field conditions of a water meter and are difficult to predict with any accuracy (Mutikanga et al., 2011b).
It is generally accepted that residential meters experience a downward trend in accuracy as they age (Couvelis and Van Zyl, 2015; Ncube and Taigbenu, 2015; Arregui et al., 2018a). This phenomenon has been attributed to wear and tear of the moving parts, the build-up of deposits such as limescale inside the meter body or algal growth (Seago et al., 2002; Arregui et al., 2005; Criminisi et al., 2009).
In general, two variables are used when calculating the rate of degradation of a water meter. These are the duration of time that the meter has been installed in years, also called 'meter age', and the total volume of water that the water meter has registered in its lifetime, also known as 'accumulated volume. These two variables are commonly found either on the meters themselves, in the case of accumulated volume, or in the meter replacement records of the utility in the case of meter age (Ncube and Taigbenu, 2019).
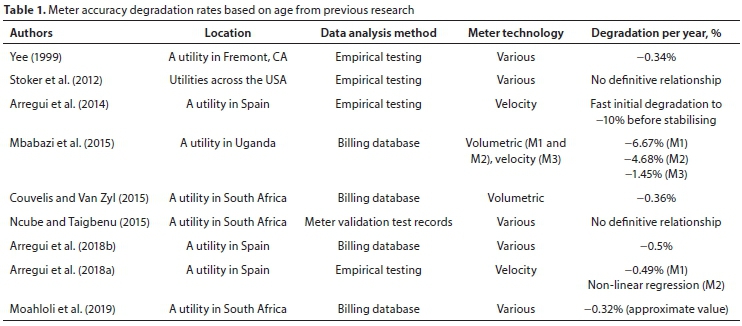
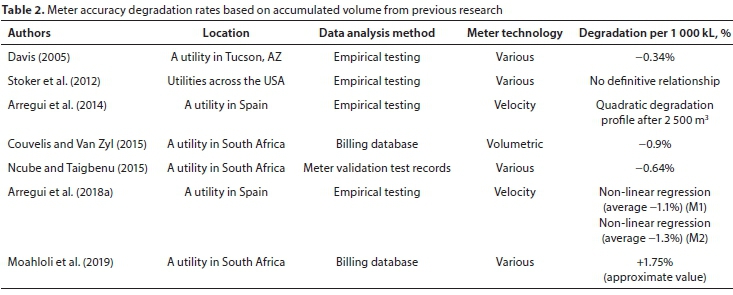
The degradation rates found for residential meters vary in literature, based on location where the meters were extracted, meter technology and manufacturer and the method of data analysis (Ncube and Taigbenu, 2019). The results obtained in past research are highlighted in Table 1 for age and Table 2 for accumulated volume.

As seen in Table 1, the degradation rates obtained for age range from -0.3% to -0.5% per annum (Couvelis and Van Zyl, 2015; Arregui et al., 2018a; Moahloli et al., 2019). The primary outlier of these results was recorded by Mbabazi et al. (2015) who found degradation rates between -1.45% and -6.67%. Stoker et al. (2012) and Ncube and Taigbenu (2015) found no definitive relationship between meter accuracy and age while Arregui et al. (2014; 2018a) established a non-linear relationship between meter accuracy and age.
The only technology comparison performed was done by Mbabazi et al. (2015). They found that the volumetric meters tested (M1 and M2) degraded at a higher rate per annum than the velocity meters tested (M3). The primary reason given for this was the poor water quality in the Ugandan water network which affected the volumetric meters more than the velocity meters.
The degradation rates for accumulated volume varied slightly more than those for age. As seen in Table 2, the degradation rates for accumulated volume ranged from 0.34% per annum to -1.3% per annum (Couvelis and Van Zyl, 2015; Ncube and Taigbenu, 2015; Arregui et al., 2018a). Again, Stoker et al. (2012) found no relationship between meter accuracy and accumulated volume. The lack of a definitive relationship could be due to the fact that the meters came from multiple sources across the United States and were of differing technologies. The water quality also differed. The results found by Moahloli et al. (2019) were in contrast to those of previous research as they discovered a positive rate of degradation with regard to accumulated volume.
Less research was available that evaluated the meter degradation based on accumulated volume than on meter age. This is despite the fact that Davis (2005) and Ncube and Taigbenu (2015) indicate that accumulated volume is a better predictor of meter accuracy than age.
METHODOLOGY
Past research in South Africa has made progress in the evaluation of the rate of degradation of residential meters. The most commonly used technique for determining meter degradation is comparing consumption figures for water meters before and after their replacement to estimate meter error. This method has been used by Couvelis and Van Zyl (2015) in Cape Town as well as Ncube and Taigbenu (2015) and Moahloli et al. (2019) in Gauteng. However, the uncertainty related to this method is higher than for empirical methods as it can provide an inaccurate figure for the apparent losses and cause a utility to generate a replacement strategy based on erroneous information (Ncube and Taigbenu, 2019).
The empirical method of data analysis, by testing used meters in a laboratory environment, has been proven to be the most accurate method of estimating the accuracy of a water meter (Moahloli et al., 2019; Ncube and Taigbenu, 2019). While this method is commonly employed internationally, limited meter degradation information has been generated using this method in South Africa. Degradation data generated using this method will assist water utilities in accurately predicting the accuracy of their water meters and replacing them at the point of maximum return on investment.
The generally accepted best practice for the generation of empirical accuracy data involves the generation of an accuracy curve by testing each water meter at different flow rates (Davis, 2005; Ncube and Taigbenu, 2015; Arregui et al., 2018a). This is then paired with a consumer usage profile between each of the flow rates tested which provides a single weighted error figure for each meter. A regression analysis is then performed for each meter type against the independent variables of age and accumulated volume to calculate a degradation rate. This process is known as the weighted error methodology (Davis, 2005; Ncube and Taigbenu, 2015; Arregui et al., 2018a).
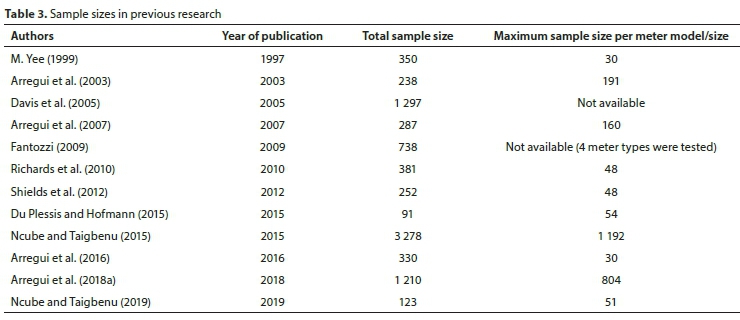
As seen in Table 3, the sample size for an empirical test varies in literature from 30 units up to 1 197 units of each meter type depending on the study. The median sample size is approximately 50 units. This research followed the weighted error methodology with a sample size of 100 units of two different metering technologies for a total sample of 200 units. The two meter technologies selected were the oscillating piston-type volumetric meter and the multijet-type velocity meter as these make up the vast majority of meters installed in the Gauteng region. These meters were sourced from the largest metropolitan municipality by area in the Gauteng region and were meters that had been removed from the ground by the utility as part of their meter replacement process. Meters removed during this process are expected to have a higher than average rejection rate as they are sourced at the end of the meters' expected lifecycle. However, it is expected that all meters as a part of this process were subject to the same bias, as they follow the same replacement programme. As such, the rejection rates will not be compared directly with other literature, but rather be compared only with each other, to negate any bias. The meters chosen comprised of two different accuracy classes with the velocity meter having a Class B rating and the volumetric meter being Class C. The meters were both from the same manufacturer. Some of the details of the meters are outlined in Table 4 below.

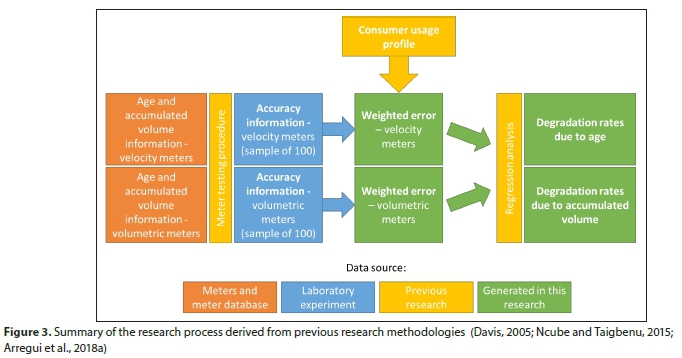
The testing was conducted in an accredited meter test laboratory and according to the meter testing procedures outlined in SANS 1529-1:2006. The consumer usage profile was generated from three previous research papers in South Africa. A summary of the research process followed is depicted in Fig. 3 (Davis, 2005; Ncube and Taigbenu, 2015; Arregui et al., 2018a).
In order to conduct regression analysis, information related to the age and accumulated volume of the meters was obtained either from the meter itself or from the meter testing database. The age information retrieved related to the installation and removal dates of the meter. This information was then used to calculate the age of each meter in years. In some cases, the installation and removal dates of a meter were not in the billing database of the utility due to information either being incorrect or omitted. This is a symptom seen previously in South Africa and was previously remedied by using the date of manufacture of the water meter (Ncube and Taigbenu, 2015). In this case, the manufacture date of the water meter and the date the meter was taken from the utility's premises were used where the installation and removal dates were not available.
For the purposes of this research, an error metric for a water meter that takes into account the entire accuracy curve of the meter needs to be defined. Past research has solved this problem by combining the accuracy characteristics for a flow rate range with the proportional consumption at a specific flow rate range. This metric is called weighted error (Yee, 1999; Arregui et al., 2018a; Ncube and Taigbenu, 2019).
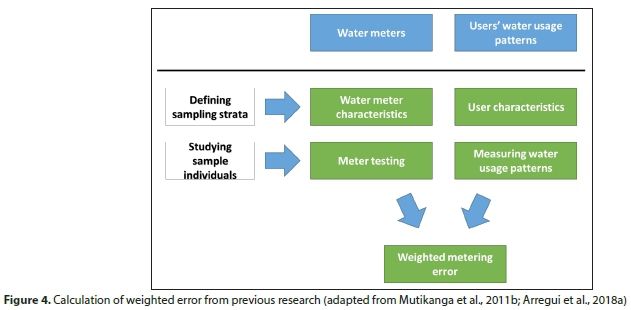
This weighted error is calculated based on the accuracy curve for each meter obtained during meter testing and the consumer usage profile for residential meters used in this research. This provides a single unique error value per meter that can be used in the regression analysis. This process is highlighted in Fig. 4 (Mutikanga et al., 2011b; Arregui et al., 2018a).
Meter accuracy information was generated from testing the meters at a number of key flow rates in an accredited meter testing laboratory. All tests were conducted in accordance with SANS 1529-1:2006. Although the water quality of the test was not measured during this research, the water in the test environment was filtered before it entered the water meters and was regularly checked for any particulates. The assumption was that this would have a negligible effect on the performance of the water meters.
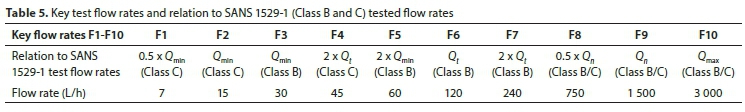
The number of flow rates used to establish an accuracy curve varies in research but recent literature generally agrees that using up to 10 flow rates and focusing on lower flow rates (below 120 L/h) is best for generating a detailed accuracy curve (Arregui et al., 2018b; Ncube and Taigbenu, 2019). Because the meters were initially tested according to SANS 1529-1 (Class B and C), the flow rates selected for testing were directly related to these values. The flow rates tested and their relation to the tested flow rates of SANS 1529-1 (Class B and C) are displayed in Table 5.
The equation used for the calculation of weighted error has been extracted from previous research (Ncube and Taigbenu, 2019). It is described by Eq. 1:
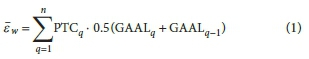
where
ew= weighted error of an individual meter
n = number of flow rates tested
PTCq = consumption percentage between each flow rate from 1 to n
GAAL? = accuracy of the meter at each flow rate from 1 to n
GAAL0 = meter accuracy at a flow rate of 0, which is assumed to be -100%
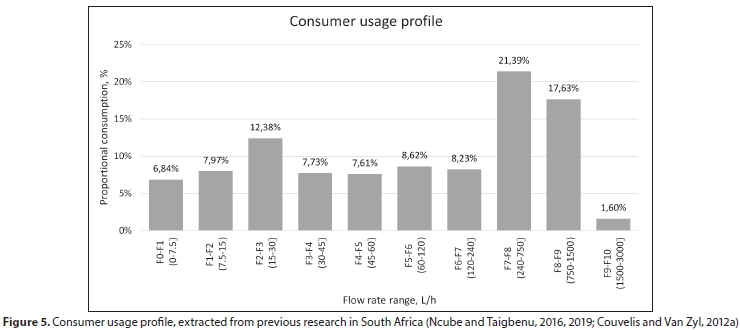
The consumer usage profile is an indication of the demand pattern of a consumer for a specific flow rate range within the meter's operating range (Richards et al., 2010). This usage profile is usually generated by recording the consumer meters in the field (Ncube and Taigbenu, 2016; Arregui et al., 2018a). The consumer usage profile used in this research was extracted from previous research. It was based on three studies, two from the Gauteng region (Ncube and Taigbenu, 2016, 2019) and one from the Western Cape (Couvelis and Van Zyl, 2012a). The Western Cape was included as it provided representative data that aligned with international research better than the Gauteng data (Arregui et al., 2016). Also, the two datasets for the Gauteng data were from the same researchers, thus it was likely that the data source was the same. Because the flow rates used in each study differ from those used in this research, the data was linearly interpolated to align with the flow rates used in this research. The consumer usage profile used in this research is displayed in Fig. 5.
The consumer usage profile used in this research indicates a high proportion of consumption at lower flows, which aligns with other results in Africa. A flow rate of less than 15 L/h accounted for 14.81% of total consumption and a flow rate of less than 30 L/h accounted for 27.19%. Research conducted in Uganda reported a similar proportional consumption of 14% below 15 L/h and 25% below 35 L/h (Mutikanga et al., 2011b). However, international research reports lower figures of between 4.7% and 10% below 12 L/h and between 7.3% and 14.9% below 36 L/h (Arregui et al., 2016; Arregui et al., 2018a). This contrast can be attributed to an increased incidence of on-site leakage experienced in South Africa (Couvelis and Van Zyl, 2012a; Ncube and Taigbenu, 2016).
Although the conditions of the laboratory are controlled, it is impossible to regulate or predict what effect the in-field conditions have had on the performance of the water meters removed. As such, a data-cleaning step was performed in this research to remove any meters that may skew the results. Past studies have also used this technique in which meters that fall outside a particular accuracy tolerance are rejected (Ncube and Taigbenu, 2015; Davis, 2005). One method when using the weighted error methodology is to define a maximum and minimum tolerance for the meter readings. However, these tolerances vary in literature and the sources of these errors are not defined.
Used meter tolerances in this paper were determined through the calculated error tolerance (South African Bureau of Standards, 2006). All tested meters were approved to a minimum of the Class B standard and the accuracy tolerances according to Class B were used. According to the standard, the maximum tolerance for a Class B used meter is ±3.5% for flow rates of 120 L/h or above and ±8% for flow rates from 30 L/h to 120 L/h. Flow rates below 30 L/h do not have any accuracy requirements and as such the maximum error below 30 L/h was assumed to be ±100%. When these were compared to the key flow rates and the consumption profile used in this research, the results in Table 6 were obtained. The data from Table 6 provided an acceptable tolerance of ±25% for this research.
Two meter degradation curves were generated for each meter type based on meter age and accumulated volume of the meter. When analysing the degradation rates of residential meters, the most commonly used and accepted analysis in research is linear regression analysis (Stoker et al., 2012; Mbabazi et al., 2015; Ncube and Taigbenu, 2015). The equations used in the calculation of the degradation rates were adapted from previous research (Arregui et al., 2018b). Equation 2 was used for calculating the degradation based on age:
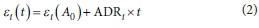
where
ei(t) = error at time t
ei(A0) = calculated initial weighted error at time 0
ADRi = degradation rate due to age of the meter
Equation 3 was used for calculating the accumulated volume:

where
ei ( V) = error of the meter at volume V
ei( V0) = calculated initial weighted error at zero volume
VDRi = rate of degradation due to volume of the meter
Also calculated for each regression analysis is the coefficient of determination, R2. The coefficient of determination indicates the proportion of the variance in the dependent variable (meter accuracy) that can be explained by the independent variable (age or accumulated volume). An R2value above 0.5 indicates that most of the variance in the accuracy can be explained by the independent variable being analysed. An R2value below 0.5 indicates that other factors have a greater effect on the accuracy than the independent variable being analysed (Ncube and Taigbenu, 2015).
RESULTS
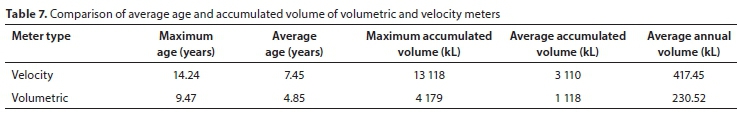
The two meter types tested differed in terms of their age and accumulated volume. Table 7 indicates the age and accumulated volume information for the meters tested.
The average age of the velocity meters tested was 53% higher than that of the volumetric meters. The maximum age of the velocity meter was 50% higher than the maximum age of the volumetric meters tested. The average accumulated volume of the velocity meters was 3 110 kL, more than 178% higher than the average accumulated volume of the volumetric meters (1 118 kL). For the purposes of this research, clock-overs were not taken into account. This is because, of all meters sourced, none had a consumption figure of more than 50% of the clock-over consumption. It can safely be assumed that it was unlikely that the tested meters experienced a clock-over event.
During the data-cleaning step, the number of meters of each meter technology that were rejected was recorded. For the velocity meters, 27 out of a total of 100 meters tested were rejected. For the volumetric meters, 45 out of a total of 100 meters tested were rejected. The results indicate a 66% higher comparative rejection rate for volumetric meters than for velocity meters. This relationship is in line with research conducted in Uganda, indicating up to 75% of all failures being experienced in volumetric meters (Mutikanga et al., 2011b).
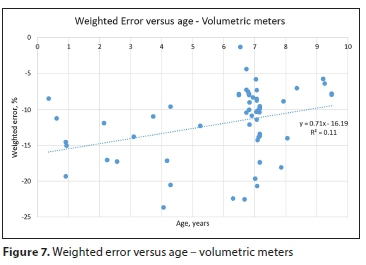
The accuracy of both the velocity and volumetric meters tested had a limited relationship to the age of the meter although the degradation rate for the velocity meters was within the boundaries of results obtained from previous research. The results obtained are shown in the regression analysis in Figs 6 and 7.
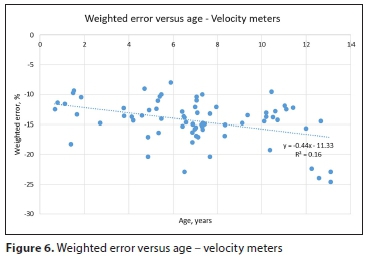
The results for velocity meters show a degradation rate based on age of -0.44% per annum. This result is similar to that of past empirical research, which generally falls between -0.3% and -0.5% per annum (Yee, 1999; Arregui et al., 2018a). The calculated initial weighted error ei (A0) of the curve was found to be -11.33%. The coefficient of determination (R2) returned for velocity meters was 0.16, indicating that only 16% of the variance in accuracy of a velocity meter can be explained by its age.
For the volumetric meters tested, the age-based degradation ADRi was calculated at +0.71% per annum, with a calculated starting error ei(A0) value of -16.19%. The results were not tightly grouped, with a coefficient of determination (R2) of 0.11, which indicates that only 11% of the variance in accuracy of a volumetric meter can be explained by age.
Of the two meters tested, only the relationship between the accuracy of a velocity meter and accumulated volume produced a conclusive result that fell within the boundaries from previous research. The results obtained are shown in the regression analysis in Figs 8 and 9.


The accumulated volume-based degradation rate VDR,- calculated for the velocity meters tested was -0.00113% per kL, or -1.13% per 1 000 kL. This result shows similarity with that of past research, which tended to fall between -0.3% and -1.3% per 1 000 kL for empirical testing (Davis, 2005; Ncube and Taigbenu, 2015; Arregui et al., 2018a). The calculated starting error ei (V0) identified was -10.80. The results obtained for accumulated volume for velocity meters yielded the tightest grouping with a R2 value of 0.54, the only strong relationship found.
The accumulated volume-based results shown in Fig. 9 obtained for volumetric meters indicate that almost none (3.3%) of the accuracy of a volumetric meter could be explained by its accumulated volume. The regression analysis returned a degradation rate VDRi of +0.00127% per kL or +1.27% per 1 000 kL, and an calculated initial weighted error ei ( V0) value of -13.47%. The large difference between the calculated initial weighted errors, ei (V0) and ei (A0), also highlights that the results obtained are not reliable.
DISCUSSION
A regression analysis was performed for age and accumulated volume once the weighted error of each meter was obtained. Four regression analyses were performed, two per meter type tested, based on the meter age and its accumulated volume. The regression analysis produced two variable outputs: the degradation rate based on age (VDR ) and accumulated volume (VDR ), as well as the initial weighted error of the meters based on age (ei (A0)) and accumulated volume (ei (V0)). The coefficient of determination (R2) for each regression analysis was also obtained. These results are listed in Table 8 and discussed below.
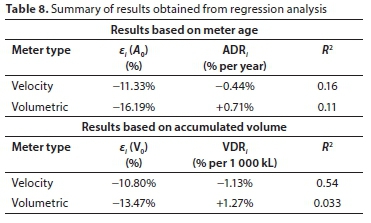
There is a weak relationship between meter age and the accuracy of either a velocity or volumetric residential meters. This is indicated by the R2 values of 0.16 and 0.11 that were obtained for velocity and volumetric meters, respectively. This is lower than the minimum R2 value of 0.5 required to denote a strong relationship. This result indicates that age should not be used as a factor for meter replacement as it only has a small influence on the accuracy of either velocity or volumetric meters installed.
A strong relationship between accumulated volume and meter accuracy for velocity meters was established. This was the only strong relationship established in this research. This relationship can be explained with the following equation:
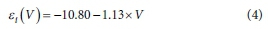
ei(V) = percentage weighted error of the meter at volume VV = accumulated volume that has passed through the meter, measured in 1 000 kL.
These values are similar to those obtained in previous empirical research on residential meters (Couvelis and Van Zyl, 2015; Ncube and Taigbenu, 2015; Arregui et al., 2018a).
The accuracy of the velocity meters tested returned a strong relationship with accumulated volume, with an R2value of 0.54, but did not have a strong relationship with age. This result confirms conclusions drawn from previous research on residential meters that accumulated volume is a more reliable accuracy indicator than age for velocity-type residential meters (Davis, 2005; Ncube and Taigbenu, 2015). This is a useful result for utilities, as if the meter installation date and removal date are lost, the accumulated volume of a meter can simply be retrieved from the register of the meter.
The volumetric meters tested returned poor relationships with both age and accumulated volume. This result indicates that outside influences may play a greater role in the accuracy variability of these meters. This confirms previous research indicating that volumetric meters are more susceptible to outside influences such as particulates or entrained air present in the water supply (Buck et al., 2012; Basu, 2019).
Further, a high comparative rejection rate was experienced for these meters (66% higher than the rejection rate for velocity meters in this study). This result is of significance, as this meter is still the predominant meter used in South Africa (Couvelis and Van Zyl, 2015; Ncube and Taigbenu, 2019).
CONCLUSIONS
Utilities in South Africa are currently facing the twin challenges of a water supply that is becoming increasingly unreliable as supply dwindles as well as high levels of NRW in their networks. This is exacerbated by lack of data available to make informed management decisions on the replacement of assets, particularly regarding water meters. This research, an experimental procedure involving laboratory testing of water meters, was identified as the best option for the generation of meter error data. In total, 100 water meters were tested of each of the two most commonly used technologies of residential water meters (volumetric and velocity meters) in South Africa. Using an empirical process of testing water meters and calculating a weighted error figure was identified as best practice for determining meter accuracy. After conducting empirical testing on 100 meters of two differing technologies, the following conclusions can be drawn:
• For multijet-type velocity meters, a relationship was identified between the accuracy of the meter and its accumulated volume.
• For oscillating piston-type volumetric meters, it was not possible to identify a strong relationship between the accuracy of the meter and its accumulated volume.
• It was not possible to find a definitive relationship between the accuracy of either meter technology and its age.
This result provides valuable information to utilities in Gauteng. Using this information, utilities will be able to design replacement strategies better, utilizing cumulative consumption instead of age as a replacement metric. This result should also assist utilities in selecting the correct meter type for their application.
Further research
This research intentionally had a narrow focus. The focus was on two commonly used technologies of water meters from a single manufacturer and sourced from a single utility. This was done to reduce the risk of uncertainty due to meter manufacturer or type as tolerances may be different per manufacturer. Water conditions are also unique per location and will affect the meter technologies and types differently.
In order to compare rejection rates with other literature, future studies should include meters removed at random from the field, not only meters at the end of their lifecycle. This will prevent any rejection rate bias. Future research on the topic could expand on this research by including different utilities and locations as well as different manufacturers and/or different technologies to increase the information pool that can be used by utilities for their meter selection and replacement strategies in future.
REFERENCES
ALEGRE H, MELO BAPTISTA J, CABRERA EJ, CUBILLO F, DUARTE P, HIRNER W, MERKEL W and PARENA R (2006) Performance Indicators for Water Supply Services (2nd edn.). IWA Publishing, London. 312 pp. [ Links ]
ARREGUI FJ, BALAGUER M, SORIANO J and GARCÍA-SERRA J (2016) Quantifying measuring errors of new residential water meters considering different customer consumption patterns. Urban Water J. 13 (5) 463-475. https://doi.org/10.1080/1573062X.2014.993999 [ Links ]
ARREGUI FJ, CABRERA E, COBACHO R and GARCÍA-SERRA J (2005) Key factors affecting water meter accuracy. URL: http://rash.apanela.com/tf/leakage/Key_Factors_Affecting_Water_Meter_Accuracy.pdf [ Links ]
ARREGUI FJ, COBACHO R, CABRERA E and ESPERT V (2011) Graphical method to calculate the optimum replacement period for water meters. J. Water Resour. Plan. Manage. 137 (1) 143-146. https://doi.org/10.1061/(ASCE)WR.1943-5452.0000100 [ Links ]
ARREGUI FJ, COBACHO R, SORIANO J and JIMENEZ-REDAL R (2018b) Calculation proposal for the economic level of apparent losses (ELAL) in a water supply system. Water. 10 (12) 1809. https://doi.org/10.3390/w10121809. [ Links ]
ARREGUI FJ, GAVARA FJ, SORIANO J and COBACHO R (2014) Analysis of domestic water meters field performance. In: Proceedings of the Water Loss 2014 Conference, 30 March - 2 April 2014, Vienna. [ Links ]
ARREGUI FJ, GAVARA FJ, SORIANO J and PASTOR-JABALOYES L (2018a) Performance analysis of ageing single-jet water meters for measuring residential water consumption. Water. 10 (5) 1-18. https://doi.org/10.3390/w10050612 [ Links ]
ARREGUI FJ, PARDO MA, PARRA JC and SORIANO J (2007) Quantification of meter errors of domestic users: a case study. In: Proceedings of the Water Loss 2007 Conference, 23-26 September 2007, Bucharest. 1-11. : https://www.mcast.edu.mt/rfm/source/Research/ApparentLosses/outreach/QUANTIFICATION-OF-METER-ERRORS-OF-DOMESTIC-USERS-A-CASE-STUDY.pdf [ Links ]
BASU S (2019) Chapter IV - Positive displacement (PD) type flow metering. In: Plant Flow Measurement and Control Handbook: Fluid, Solid, Slurry and Multiphase Flow. Elsevier, London. https://doi.org/10.1016/B978-0-12-812437-6.00001-9 [ Links ]
BUCK BS, JOHNSON MC and BARFUSS SL (2012) Effects of particulates on water meter accuracy through expected life. J. Am. Water Works Assoc. 104 (4) 65-66. [ Links ]
CHADWICK JR (2018) Accuracy of residential water meters in response to short, intermittent flows. MSc. Thesis, Utah State University. https://digitalcommons.usu.edu/etd/7034 [ Links ]
COUVELIS FA and VAN ZYL JE (2012a) Apparent water loss due to consumer meter inaccuracies in selected areas of South Africa. PhD thesis, University of Cape Town, Cape Town. [ Links ]
COUVELIS FA and VAN ZYL JE (2012b) Apparent water losses related to municipal metering in South Africa. WRC Report No. 1998/1/12. Water Research Commission, Pretoria. [ Links ]
COUVELIS FA and VAN ZYL JE (2015) Apparent losses due to domestic water meter under-registration in South Africa. Water SA. 41 (5) 698-704. https://doi.org/10.4314/wsa.v41i5.13 [ Links ]
CRIMINISI A, FONTANAZZA CM, FRENI G and LA LOGGIA G (2009) Evaluation of the apparent losses caused by water meter under-registration in intermittent water supply. Water Sci. Technol. 60 (9) 2373-2382. https://doi.org/10.2166/wst.2009.423 [ Links ]
DAVIS SE (2005) Residential water meter replacement economics. URL: http://rash.apanela.com/tf/leakage/Residential_Water_Meter_Replacement_Economics.pdf [ Links ]
DWS (Department of Water and Sanitation) (2019) IWA Water Balance Diagram. URL: http://www.dwa.gov.za/Dir_WS/ndrp/graph_iwa.aspx (Accessed 23 February 2019). [ Links ]
DU PLESSIS JA and HOFFMAN JJ (2015) Domestic water meter accuracy. WIT Transactions on Ecology and The Environment. 200 197-208. https://doi.org/10.2495/WS150171 [ Links ]
FANTOZZI M (2009) Reduction of customer meters under-registration by optimal economic replacement based on meter accuracy testing programme and unmeasured flow reducers. In: Proceedings of the 5th IWA Water Loss Reduction Specialist Conference, 26-30 April 2009 April, Cape Town. [ Links ]
FONTANAZZA CM, FRENI G, LA LOGGIA G, NOTARO V and PULEO V (2012) A composite indicator for water meter replacement in an urban distribution network. Urban Water J. 9 (6) 419-428. https://doi.org/10.1080/1573062X.2012.690434 [ Links ]
ISO (International Organization for Standardization) (2014) Water meters for cold potable water and hot water -- Part 1: Metrological and technical requirements. ISO, Switzerland. ISO 4064-1:2014|OIML R49-1:2013. [ Links ]
MBABAZI D, BANADDA N, KIGGUNDU N, MUTIKANGA HE and BABU M (2015) Determination of domestic water meter accuracy degradation rates in Uganda. J. Water Supply: Res. Technol. 64 (4) 486-492. https://doi.org/10.2166/aqua.2015.083 [ Links ]
MCKENZIE R, SIQALABA ZN and WEGELIN WA (2012) The state of non-revenue water in South Africa (2012). WRC Report No. TT 522/12. Water Research Commission, Pretoria. [ Links ]
MOAHLOLI A, MARNEWICK A and PRETORIUS JH (2019) Domestic water meter optimal replacement period to minimize water revenue loss. Water SA. 45 (2) 165-173. [ Links ]
MUKHEIBIR P, STEWART R, GIURCO D and HALLORAN KO (2012) Understanding non-registration in domestic water meters. AWA Water December 2012 1-6. [ Links ]
MUTIKANGA HE, SHARMA SK and VAIRAVAMOORTHY K (2011a). Assessment of apparent losses in urban water systems. Water Environ. J. 25 (3) 327-335. https://doi.org/10.1111/j.1747-6593.2010.00225.x [ Links ]
MUTIKANGA HE, SHARMA SK and VAIRAVAMOORTHY K (2011b) Investigating water meter performance in developing countries: a case study of Kampala, Uganda. Water SA 37 (4) 567-574. https://doi.org/10.4314/wsa.v37i4.18 [ Links ]
NCUBE M and TAIGBENU A (2015) Meter accuracy degradation and failure probability based on meter tests and meter change data. In: Proceedings of the 4th YWP-ZA Biennial Conference and 1st African YWP Conference, 16-18 November 2015, Pretoria. [ Links ]
NCUBE M and TAIGBENU A (2016) Consumption characterisation and on-site leakage in Johannesburg, South Africa. In: IWA Water Loss Conference 2016, 31 January - 3 February 2016, Bangalore. [ Links ]
NCUBE M and TAIGBENU A (2018) Decision enhancement for the management of apparent water losses. In: Proceedings of WISA 2018 Biennial Conference and Exhibition, 26 June 2018, Cape Town. [ Links ]
NCUBE M and TAIGBENU A (2019) Assessment of apparent losses due to meter inaccuracy - a comparative approach. Water SA. 45 (2) 174-182. https://doi.org/10.4314/wsa.v45i2.03 [ Links ]
RICHARDS GL, JOHNSON MC and BARFUSS SL (2010) Apparent losses caused by water meter inaccuracies at ultralow flows. Am. Water Works Assoc. 102 (5) 123-132. https://doi.org/10.1002/j.1551-8833.2010.tb10115.x [ Links ]
SEAGO C, BHAGWAN J and MCKENZIE R (2002) Benchmarking leakage from water reticulation systems in South Africa. Water SA. 30 (5) 25-32. [ Links ]
SHIELDS DJ, BARFUSS SL and JOHNSON MC (2012) Revenue recovery through meter replacement. J. Am. Water Works Assoc. 104 (4) 69-70. https://doi.org/10.5942/jawwa.2012.104.0056 [ Links ]
SOUSA P, BLAMEY R, REASON C, RAMOS A and TRIGO R (2018) The "Day Zero" Cape Town drought and the poleward migration of moisture corridors. URL: http://iopscience.iop.org/article/10.1088/1748-9326/aaebc7/meta [ Links ]
SABS (South African Bureau of Standards) (2006) Water meters for cold potable water Part 1: Metrological characteristics of mechanical water meters of nominal bore not exceeding 100 mm. SABS, Pretoria. [ Links ]
STOKER DM, BARFUSS SL and JOHNSON MC (2012) Flow measurement accuracies of in-service residential water meters. J. Am. Water Works Assoc. 104 (12). https://doi.org/10.5942/jawwa.2012.104.0145 [ Links ]
THORNTON J, STURM R and KUNKEL G (2008) Water Loss Control (2nd edn). McGraw Hill, New York. 632 pp. [ Links ]
VAN ZYL JE (2011) Introduction to integrated water meter management. WRC Report No. TT 490/11. Water Research Commission, Pretoria. 128 pp. [ Links ]
WATER (2011) South Africa: a water scarce country. World Cup Legacy Report 6 58-73. https://www.environment.gov.za/sites/default/files/docs/water.pdf [ Links ]
YEE MD (1999) Economic analysis for replacing residential meters. J. Am. Water Works Assoc. 91 (7) 72-77. https://doi.org/10.1002/j.1551-8833.1999.tb08666.x [ Links ]
 Correspondence:
Annlizé L Marnewick
Email: amarnewick@uj.ac.za
Received: 27 December 2019
Accepted: 10 September 2020

