


Servicios Personalizados
Articulo
 Inglés (pdf)
 Articulo en XML
 Referencias del artículo
Indicadores

Links relacionados
-
 Citado por Google
 -
 Similares en Google
Compartir

 Permalink
Water SA
versión On-line ISSN 1816-7950
versión impresa ISSN 0378-4738
Water SA vol.46 no.4 Pretoria oct. 2020
http://dx.doi.org/10.17159/wsa/2020.v46.i4.9075
RESEARCH PAPER
Accelerated phosphorus removal using sulfate-coated expanded vermiculite
Taeyoon Lee
Faculty of Environmental Engineering, Pukyong National University, Busan, Korea
ABSTRACT
This study evaluated whether phosphorus in an aqueous solution can be effectively adsorbed and removed by sulfuric acid (SA)-coated vermiculite (SCV), which was synthetized by heating a mixture of expanded vermiculite (EV) and SA at 300°C. Phosphorus was removed from the aqueous solution and removal characteristics were evaluated by batch kinetic, batch adsorption, and column tests. The phosphate removal rates (h-1) for 1, 2.5, 5, 7.5, 12.5, and 25 g-L-1 of SCV were 0.00015, 0.0011, 0.0044, 0.0087, 0.0648, and 0.5002, respectively. The Qmax of the Langmuir model and the partition coefficients of the linear and Freundlich models were 8.92 mg-g-1, 0.65 L-g-1, and 4.60 L-g-1 (1/n = 0.354), respectively. The equilibrium phosphorus adsorptions (qe) were 7.47, 14.69, and 19.53 mg-g1 at initial concentrations of 10, 25, and 50 mg-L-1, respectively. These results show that SCV can efficiently adsorb phosphorus in an aqueous solution.
Keywords: vermiculite, sulfuric acid, floating adsorbent, adsorption, exfoliation, phosphorus
INTRODUCTION
Domestic sewage, industrial wastewater, fertilizers, and livestock excretions lead to excessive accumulation of nutrient salts in drainage basins that can lead to eutrophication, deteriorating water quality, and other negative environmental effects (De-Bashan and Bashan, 2004; Song et al., 2007; Guan et al., 2009; Saha et al., 2008; Awual and Jyo, 2011; Huang et al., 2015). Eutrophication promotes abnormal growth of phytoplankton such as algae and eventually leads to death of fish and other aquatic organisms by exhausting dissolved oxygen (Estrada et al., 2011; Yang et al., 2013; Cabrita et al., 2015; Lapointe et al., 2015; Tekile et al., 2015). Water may smell foul when vegetation and algae decompose, and its turbidity also increases (Estrada et al., 2011; Yang et al., 2013). The eutrophication process can produce environmental toxins such as microcystins that can be ingested by humans (Codd et al., 2005; Yuan et al., 2006; Dittmann and Wiegand, 2006).
Excessive nutrients, such as nitrogen and phosphorus, must be removed from lakes and rivers to prevent eutrophication; however, the phosphorus usually occurs in aqueous form with limited sources and a relatively low influx compared to nitrogen. Thus, it is termed a limiting nutrient source and its removal is the most efficient way of preventing eutrophication in lakes and rivers (Zeng et al., 2004; Biswas et al., 2007; Kim et al., 2008; Lurling and Oosterhout, 2013; Lurling et al., 2014; Ogata et al., 2015). Phosphorus can be eliminated by physical, chemical, and biological methods. Current physical methods are microfiltration (Lu and Liu, 2010), reverse osmosis (Kartashevsky et al., 2015), and electrodialysis; chemical methods include precipitation, crystallization (Oladoja et al., 2013), cation exchange (Ruixia et al., 2002), and adsorption (Yang et al., 2013; Karaca et al., 2004; Choi et al., 2012); and biological methods are anaerobic-aerobic-activated sludge processing and enhanced biological phosphorus removal (Munch and Barr, 2001; Vaiopoulou and Melidis, 2007). The physical methods are generally easy and stable but costly (Nguyen et al., 2014). Electrodialysis and reverse osmosis have low efficiency, with removal of just 10% of total phosphorus (Karaca et al., 2004). Precipitation produces additional sludge that creates treatment and disposal issues and has high chemical treatment costs (De-Bashan and Bashan, 2004; Ruixia et al., 2002; Kumar et al., 2010; Zhang et al., 2011). The biological methods also have disadvantages. They are dependent on favourable microbial environmental conditions and require considerable space to complete treatment, making it difficult to implement continuous and stable treatments (Nguyen et al., 2014; Jung et al., 2000; Ning et al., 2008).
The adsorption method is convenient in comparison to the physical, chemical, and biological methods. It is economical, with a high selectivity for phosphorus that can increase removal rates at lower costs (Yang et al., 2013; Karaca et al., 2004; Zhang et al., 2011); furthermore, because it is possible to apply adsorption to water of varying quality, it can be widely applied. A variety of low-cost adsorbents for the removal of phosphorus have been developed using industrial by-products such as red mud (Akay et al., 1998), dolomite (Karaca et al., 2004), fly ash (Guan et al., 2009; Cheung and Venkitachalam, 2000; Wen et al., 2014), olivine (Lee and Yim, 2011), steel slag (Bowden et al., 2009), and zirconium (Biswas et al., 2008).
The vermiculite used in this study is a clay mineral composed of magnesium, iron, and aluminium, with a 2:1 combination structure between tetrahedral-silica and octahedral-alumina sheets. The mineral has a high cation exchange ratio of 120-150 meq-100 g-1 from the ion exchange between the surface and internal areas, and heating of 800~1,100°C results in expansion of about 6-20 times, turning it into a porous media with a large specific surface area that allows it to float on water (Malandrino et al., 2006; Song et al., 2009). In addition, because vermiculite is abundant and low-cost, it can be applied as a filter adsorbent on roads during rainstorms or be used as a natural adsorbent (Kim and Lee, 2014).
Many heterogeneous catalysis adsorbents have been made based on vermiculite for removal of various water pollutants, such as chitosan/vermiculite biocomposite (Chen et al., 2017), amphoteric modified vermiculite (Liu et al., 2017), amphoteric surfactant activated montmorillonite (Liu et al., 2016), and peroxymonosulfate activated with Fe0-montmorillonite (Yang et al., 2018).
Because all surface-coating adsorbent methods are not equally efficient in removing phosphorus, research continues to explore methods to increase sorption efficiency. Choi et al. (2012) reported the use of zeolite and activated alumina coated by sulfuric acid (SA); however, to our knowledge, no study has been done on the use of SA-coated vermiculite (SCV) for the removal of phosphorus. Anionization of adsorbents using sulfuric acid enables adsorbents to have a negative charge by combining sulfate ions with adsorbents. Common chemicals used for the anionization are (NH4)2SO4 and H2SO4.
In general, cations such as Ca2+, Mg2+, Al3+, Fe3+, K+, Na+ included in clay-type adsorbents leach from tetrahedral and octahedral layers when the adsorbents react with sulfuric acid, and H+ ions substitute for leached cations (Del Gastillo and Grange, 1997). From this reaction, acidity of clay-type adsorbents increases. This reaction is expressed as follows.
where A indicates cations in clay-type adsorbents.
Combination of adsorbents and anions in water easily occurs in clay-type adsorbents (for example, vermiculite) containing hydroxide (OH-) ions. The reaction of a combination of clay-type adsorbents and anions is represented as follows (McBride, 1994):

where An- is anion in water and >S-OH represents a metal hydroxyl group.
This ligand exchange reaction occurs effectively at low pH. Thus, the activity of clay-type adsorbents should be lower according to Eq. 1.
When sulfuric acid is used with the clay-type adsorbents to promote the ligand exchange reaction, the reaction is expressed as follows (McBride, 1994):

Cations in clay-type adsorbents are replaced by H+ ions and SO42-is bonded to the clay-type adsorbents in the form of SO3-.
Anion exchange of SO3- in clay-type adsorbents with phosphorus in water occurs according to differences in shared charge among SO3- or phosphorus with metal hydroxyl groups. In general, lower shared charge indicates higher binding force with anion and metal hydroxyl groups. Clay-type adsorbents containing SO3- show greater shared charge on metal hydroxyl groups than that of PO43-on metal hydroxyl groups. Thus, SO3- in the adsorbents can be easily replaced by PO43- in wastewater (McBride, 1994).
Here we report the results of surface characteristics of SCV and results of phosphorus removal by SCV. Elemental scanning electron microscopy and energy dispersive x-ray spectroscopy (SEM-EDS), x-ray fluorescence (XRF), x-ray powder diffraction (XRD), and Fourier transform infrared spectroscopy (FTIR) analyses were performed to evaluate the surface characteristics of SCV, and the adsorption capacity of SCV for phosphorus was determined using batch kinetic, batch sorption, and flow-through column tests.
MATERIALS AND METHODS
Materials
Vermiculite expanded about 15 times (Samhwa, Kwangjoo, Korea) was washed with DI water, and then stored in a desiccator until use. Vermiculite particles less than 3 mm diameter were used.
H2SO4 (95% purity; Junsei Chemical, Japan) was used as the reagent for the SA coating. KH2PO4 (99% purity) was obtained from Junsei Chemical Corporation (Junsei, Japan). 0.439 g of KH2PO4 was dissolved in 1 L of DI water to make 100 mg-L-1 PO43-. The phosphorus solution was prepared by using 100 mg-L-1 PO43- for the phosphorus-adsorption experiment, and the concentration of phosphorus after reaction was measured by a DR900 Colorimeter (HACH, USA). A 0.45-|im Teflon syringe filter was used to filter all samples before measurement.
Production of adsorbents
Bulk dry density was determined using a DME-220HE tuning fork density meter (Shinko Denshi Co., Japan).
The SCV was synthetized by mixing 50 g of EV and 500 mL of 10% H2SO4 in a 1 L glass beaker as described by Choi et al. (2012). After reacting the mixture at room temperature for 12 h, the mixture was removed and heated in an electro-furnace (CT-DMF 1; Coretech, Korea) at 300°C for 3 h and then dried in an oven at 105°C. The drying matter was cleaned 5 times with distilled water until no further pH change was observed in DI water.
The quantities of C, H, N, and S in the EV and SCV were analysed by macro- and micro-elemental analysers (Elementar, Germany). Surface properties of EV and SCV were measured by SEM (S-2700; Hitachi, Japan). Oxide forms of EV and SCV were analysed by qualitative and quantitative analyses by XRF (XRF-1700; Shimadzu Scientific Instruments, Japan) and XRD (X'Pert-MPD System; Philips, Netherlands) was used to observe the crystal structure of the SCV. The spectra according to the molecular structure and molecular binding of the compounds were analysed using FTIR (Spectrum X; Perkin Elmer, USA).
Batch kinetic tests
Batch kinetic tests were performed to evaluate the removal rate of phosphorus in the presence of varying doses of adsorbents under different initial phosphorus concentrations. Designated doses of adsorbents were placed in 50-mL Teflon bottles filled with phosphorus solution (40 mL). The bottles were loaded on a shaker and rotated at 30 r-min-1. Bottles were removed from the shaker intermittently for analysis. The sample was filtered through a 0.45-um Teflon syringe filter and prepared for analysis.
A first-order decay model with instantaneous adsorption was used to determine the bulk reaction rate constant (Kobs) and the instantaneous partition coefficient (Kp) for phosphorus. The model is (Koppensteiner, 1998):
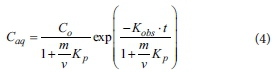
where Caq represents the phosphorus concentration (mg-L1) at a specific time, Co is the initial phosphorus concentration (mg-L1), m is the mass of sorbent (g), v is the volume of phosphorus solution (mL), Kp(L-kg1) is the instantaneous partition coefficient for phosphorus and Kobs is a bulk first-order reaction rate constant (h-1). Equation 1 was fitted to the data using a least-squares algorithm.
The data obtained from the batch kinetic tests were analysed using the pseudo first-order and second-order kinetic models.
The pseudo first-order kinetic model provided is expressed as Eq. 5.

where qe(mg-g1) and qt(mg-g1) are the phosphate adsorbed amount at equilibrium and time t, respectively, and k1is the rate constant for the pseudo first-order kinetic model (min-1). The pseudo second-order kinetic model is expressed as Eq. 6.
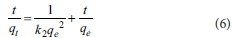
where k2 is the rate constant for the pseudo second-order kinetic model (g-mg-1-min-1). The values of k2 and qeare calculated from a plot of (t/qt) versus t.
Batch adsorption tests
For the batch adsorption tests, the amount of adsorbent was maintained at a constant (0.2 g) while the initial concentration of phosphorus was varied from 10 to 50 mg-L-1. Solution pHs for the batch and column tests were adjusted to 7.8 using NaOH and all the tests were performed at 23°C. Phosphorus solutions (40 mL) and adsorbent were placed into 50-mL bottles. The bottles were shaken at 30 r-min-1 for 6 h. After tumbling, the bottles were centrifuged at 8 000 r-min-1 (8 200 g) for 20 min. Samples were obtained from the bottles using a 5-mL gas-tight syringe, and then prepared for analysis as described previously.
A simple isothermal equation (i.e., those of the linear, Freundlich, and Langmuir isotherm models) was used to generate an adsorption isotherm to indicate the adsorption equilibrium of a single ingredient. Adsorption parameters for phosphorus were obtained by fitting linear (Eq. 7), Freundlich (Eq. 8), and Langmuir models (Eq. 9) to the data using a least-squares algorithm. These models are as follows:
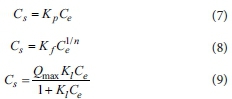
where Csis the concentration (mg-g1) of phosphorus that was adsorbed on the adsorbent, Ceis the equilibrium phosphorus concentration (mg-L-1), Kpis the distribution coefficient of the linear model, and Kf(L-g1), 1/n are the Freundlich partition coefficient and adsorption constants related to the adsorption capacity and the intensity of adsorption, respectively. Qmax represents the maximum adsorption capacity (mg-g-1), and Klis a Langmuir adsorption constant related to the binding strength.
Leaching of SO42- from SCV
Additional batch kinetic tests were performed to determine leaching characteristics of SO42- from SCV during phosphorus removal tests. The tests were performed under conditions of SCV 25 g-L-1 and initial phosphorus concentrations of 40 mg-L-1. During the first tests, SO42- and phosphorus were measured at designated sampling times. After the first test, SCV was filtered and dried at 80°C in a drying oven for 12 h. Then, the SCV was used for the second test under the condition of SCV 25 g-L-1 and initial phosphorus concentration of 40 mg-L-1 SO42- and phosphorus were also measured at designated sampling times. The third experiment was conducted in the same way as the second experiment.
Column tests
Column tests were conducted to determine sorbent efficiency of phosphorus in flow-through conditions. A schematic of the column test setup is shown in Fig. 1. A glass column (length = 300 mm, diameter = 55 mm) was used with Teflon adapters and porous ceramic disks attached to both ends. 79.1 g of SCV was packed in the column (porosity = 0.42). Prior to the start of the experiment, 200 mL of DI water was added to the column to saturate the inside of the column with DI water. The influent solution was then switched to a phosphorus solution for the column test.
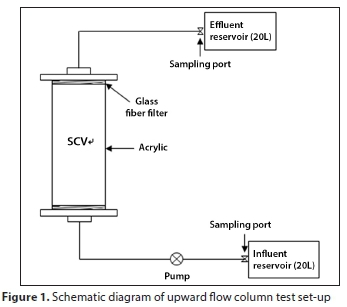
Solution was introduced into the column at a constant flow rate using a peristaltic pump (model BT100-1F; LongerPump, USA). All tests were conducted with upward flow. Concentrations of phosphorus in the influent were set as 10, 25, and 50 mg-L-1.
The adsorbed phosphorus quantity in the column (qtotal, mg) can be expressed by Eq. 10, as follows:
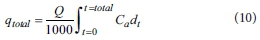
where Carepresents the adsorbed phosphorus concentration (mg-L-1), which is calculated by Co - Ctand Q is the inflow flow rate (mL-min-1); in addition, the equilibrium adsorbed quantity qe(mg-g1) is shown in Eq. 11, as follows:
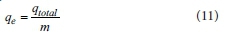
where m represents the mass of vermiculite (g) loaded in the column, and Co, Ctis the initial concentration and concentration measured at time t.
Empty bed contact time (EBCT) of column tests is calculated as follows:

RESULTS AND DISCUSSION
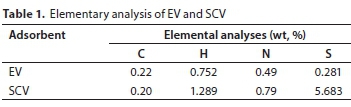
Elemental analysis of adsorbents
The dry density of the EV was 0.25 g-cm-3 and a similar dry density was obtained for SCV (0.26 g-cm-3). The values of the elemental analysis for the EV and SCV are summarized in Table 1. The C and N concentrations of both the EV and SCV were similar: 0.22% and 0.20% (C) and 0.49% and 0.79% (N), for EV and SCV, respectively; however, the concentrations of H and S were considerably different. H concentrations of EV and SCV were 0.75% and 1.29%, and those of S were 0.28% and 5.68%, respectively. The large difference in the H and S concentrations could be related to the addition of sulfate (SO42-) during coating.
XRF and XRD analyses of adsorbents
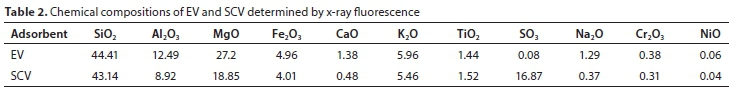
Table 2 indicates the XRF results for EV and SCV. EV mainly consisted of SiO2, MgO, and Al2O3 (44.4%, 27.2%, and 12.5%, respectively). The percentages of SiO2 and K2O (43.14% and 5.46%) in SCV were similar for EV. SCV consisted of 18.9% MgO, 8.9% Al2O3, and 4.0% Fe2O3. All percentages of oxides in SCV decreased, with the exception of SO3, which increased to 16.9%.
These results mean that the K+ ion was not affected by the ion exchange of other metal cations or the metal complex, even with the SA coating on EV, and that the K+ ion in EV was not involved in the ion exchange due to the primary involvement of the biotite layer (Muiambo et al., 2015). In addition, the quantity of CaO in EV and SCV decreased from 1.38% to 0.48%, which can be explained by the substitution of the considerable quantity of Ca2+ ions between the vermiculite layers with H+.
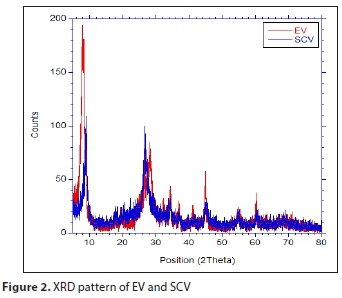
Figure 2 shows results of the XRD analysis. EV had the highest peaks at 20 (8.01°, 28.09°, and 44.93°), as did SCV (9.03° and 26.61°); the EV 8.01° peak represents a mica impurity in the vermiculite and the 44.93° peak is caused by aluminium (Medeiros et al., 2009; Sousa et al., 2012). From Fig. 2, it is assumed the crystallization was weakened by the greater decrease of the SCV reflection intensity compared with that of EV, but its original structure was not greatly changed.
SEM-EDS analysis of adsorbents
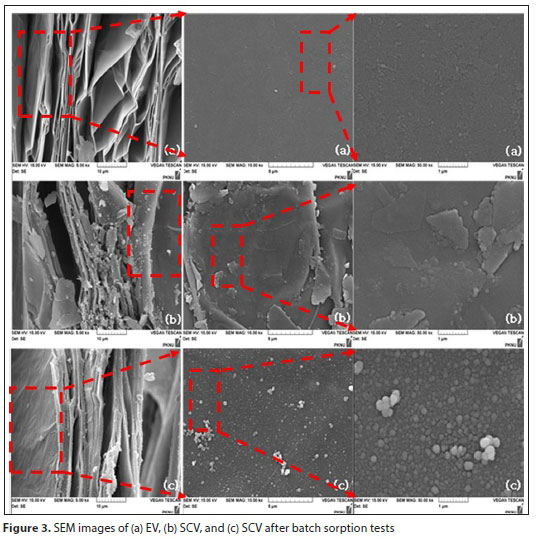
Figure 3 shows the SEM images for EV and SCV. In Fig. 3a, the smooth EV surface appears as a laminated structure with an accordion-like layer. The SCV surface is shown in Fig. 3b, and a modification between the surface and a vermiculite layer from heating to a high temperature is evident. Figure 3c shows the surface of SCV after adsorption tests are performed. In the case of EV, the surface was smooth, but in the case of SCV, it was confirmed that many cracks were formed on the surface. Since many particles were formed on the surface of the SCV after the adsorption experiment, it is judged to be a change due to the adsorption of phosphorus.
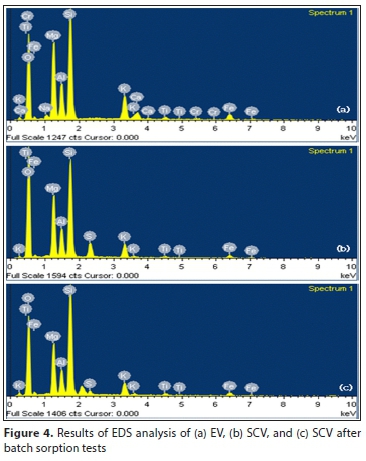
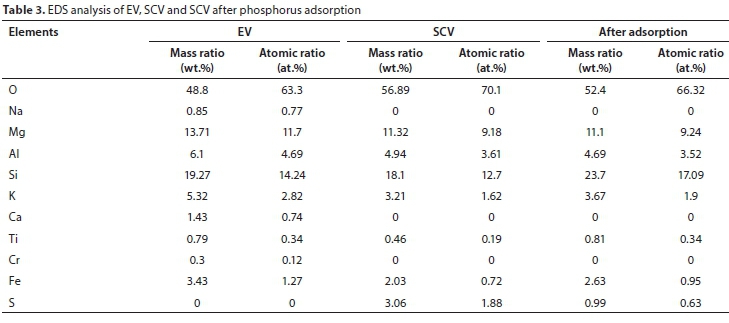
The results of the dispersive x-ray spectroscopy (SEM-EDS) analysis are shown in Fig. 4 and summarized in Table 3. Here the S peak (3.06%) that could not exist in EV is observed in SCV, indicating that sulfate (SO42-) is attached to the vermiculite after coating with SA. Because sulfate coated on SCV has a lower shared charge value than phosphorus in water, it is considered that the concentration is reduced because it is easily replaced by phosphorus. In addition, the Al, Mg and Fe peaks in the SCV are decreased more than those in EV. Like the XRF results, SEM-EDS shows that the octahedral cation was leached after the SA-coating treatment (Long et al., 2014).
FTIR analysis of adsorbents
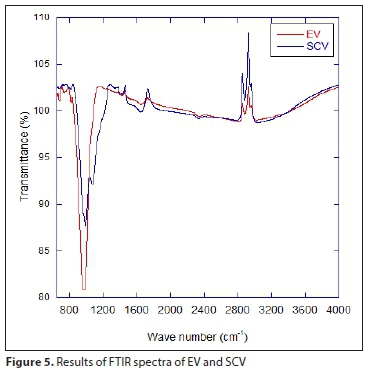
Figure 5 shows the FTIR spectra of EV and SCV. The strongest peaks of EV and SCV are shown at 974 cm-1 and 989 cm-1, respectively, representing the stretching vibrations of the Si-OH non-bridging oxygen atoms (Shin et al., 2004). EV peaks at 680 cm-1, 735 cm-1 and 974 cm-1 are relevant to the Si-O stretching vibration between Si-O-Si in the silica layer and Si-OH in the tetrahedral sheet, a structural property of the vermiculite (Long et al., 2014). This peak weakened after the SA coating, possibly because the octahedral cation was diminished due to the extraction from the octahedral sheet (Long et al., 2014). The 1 648 cm-1 peak is mainly due to the absorption of Ô (H2O) by a water molecule in the vermiculite, and explains why the silica layer changed from hydrophilic to hydrophobic (Long et al., 2014; Yu et al., 2010). Additionally, the attachment of sulfate in SCV is observed at the 1 067 cm-1 peak (Choi et al., 2012).
Batch kinetic tests
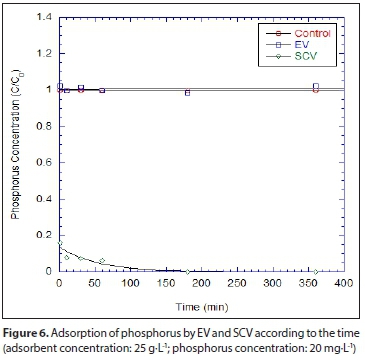
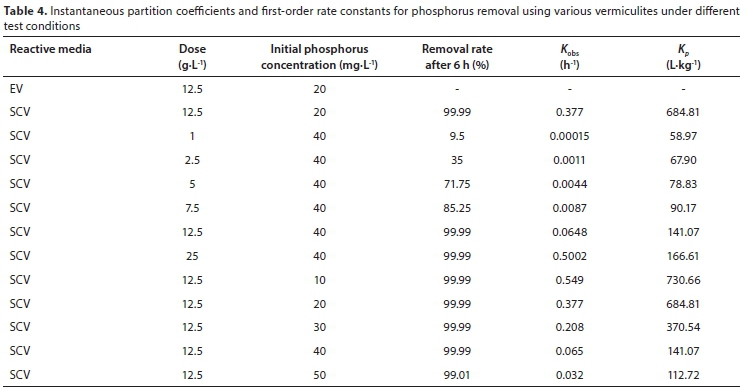
For the comparison of EV and SCV for the removal of phosphorus, one batch test was conducted for phosphorus removal. Figure 6 shows the concentrations of phosphorus removed by the EV and SCV where 0.5 g of adsorbent in 40 mL solution and initial phosphorus concentration of 20 mg-L-1 was used. Phosphorus concentrations were dramatically decreased within 10 s (more than 80%), but the EV, unlike the SCV, removed little phosphorus. The good correspondence between the data and the equation fit indicates that phosphorus removal follows a first-order reaction. The Kobs (h1) and Kp(L-kg1) of SCV were 0.377 and 684.8, respectively. On the contrary, no fitting parameters were obtained for EV. The Kobs (h1) and Kp(L-kg1) for the batch kinetic tests are summarized in Table 4.
On the basis of the above results, SCV was selected as an adsorbent for the removal of phosphorus, and additional batch kinetic tests were conducted for various ratios of an adsorbent-phosphorus solution. Phosphorus removal patterns for different ratios of SCV and phosphorus solution of 40 mL with an initial phosphorus concentration of 40 mg-L-1 are shown in Fig. 7 and Table 4. The removal rates for 1, 2.5, 5 and 7.5 g-L-1 of SCVs at a time of 360 min were 9.5%, 35%, 71.75% and 85.25%, respectively. As no phosphorus was detected after 60 min at 12.5 g-L-1 and 25 g-L-1 of SCVs, the removal rates were almost 99.99%. Based on these results, we can confirm that higher SCV dosage results in higher removal rates. The fitting parameters obtained by applying Eq. 4 to the phosphorus removal data are shown in Fig. 7b. The removal rate constant Kobs(h-1) shows a rapidly increasing pattern as the amount of SCV increases: 0.00015 at 1.0 g-L-1 to 0.5002 at 25 g-L-1. Furthermore, the instantaneous partition coefficient Kp(L-kg-1) was quickly increased, similarly to the removal rate constant, from 58.97 at 1 g-L-1 to 166.61 at 25 g-L-1.


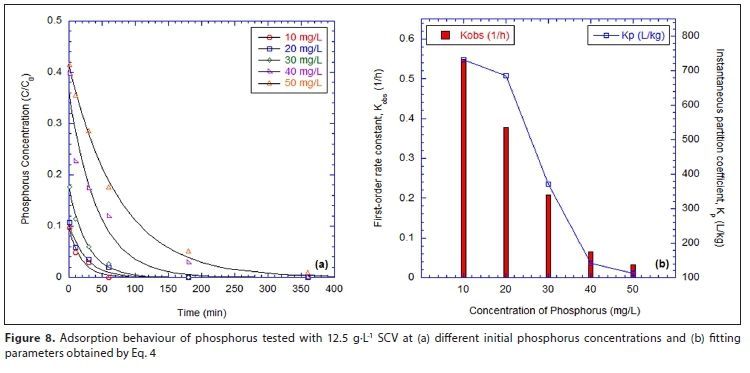
Figure 8 shows the concentration changes of the phosphorus solutions with time, where the initial concentrations are 10, 20, 30, 40 and 50 mg-L-1, and 0.5 g of SCV is added. Test conditions are summarized in Table 4. The phosphorus ions were effectively removed, with removal rates of almost 99%. With these results, the first-order rate constant and instantaneous partition coefficient were obtained using Eq. 4 and the results are summarized in Table 4.
As shown in Fig. 8b, the highest concentration of phosphorus resulted in highest Kobsbut lowest Kp. By increasing the initial concentration, the removal constants, Kobs (h-1), were decreased to 0.549, 0.377, 0.208, 0.065 and 0.032. When the initial concentration was increased, the instantaneous partition coefficients decreased to 730.7, 684.8, 370.5, 141.1 and 112.7 L-kg-1.
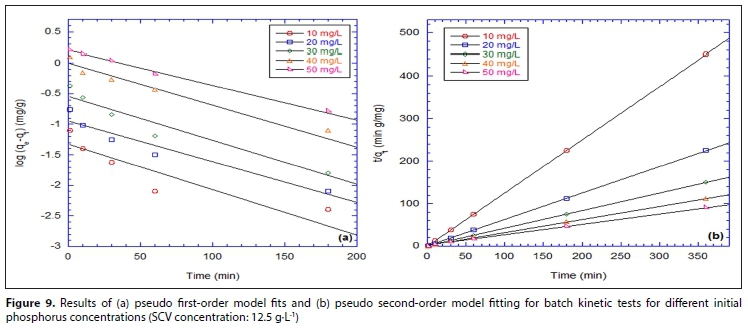
The parameters of pseudo first-order and second-order model are summarized in Table 5 and model fits are shown in Fig. 9. It is clear that the process of phosphate adsorption onto SCV is well described by the pseudo second-order model because of the high correlation coefficient. The correlation coefficients for the fitting of the pseudo second-order model range between 0.9988 and 1.0000. The calculated amount of phosphate adsorbed on SCV at equilibrium (qe>cal) was quickly increased from 0.80 mg-g1 at 10 mg-L-1 to 4.02 mg-g-1 at 50 mg-L-1. This phenomenon was due to both increased contact time between adsorbent and adsorbate, and an increased concentration difference between the surface of the SCV and adsorbate in solution. On the contrary, k2(g-mg-1-min-1) was decreased from 3.064 at 10 mg-L1 to 0.031 at 50 mg-L-1.
Batch adsorption tests
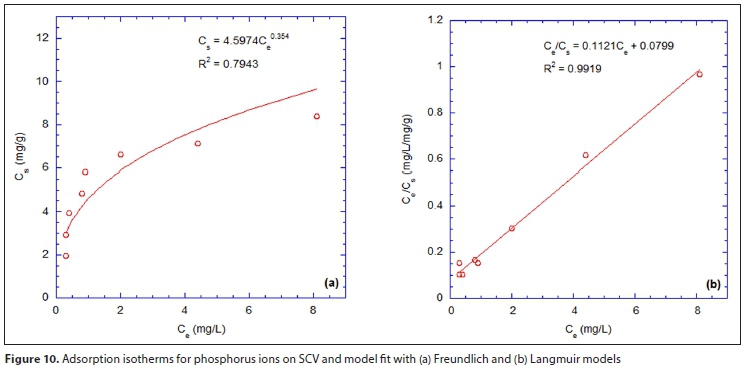
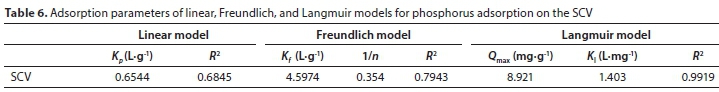
Linear, Freundlich, and Langmuir models were fitted to the isotherm data using least-squares approximations. Results of batch adsorption tests are shown in Fig. 10 and fitting parameters are summarized in Table 6. As the coefficients of determination of the linear and Freundlich models are R2= 0.685 and R2= 0.794, respectively, the Langmuir model is more appropriate as it has the highest coefficient of determination (R2 = 0.9919). The adsorption constant (Kl) for the Langmuir model is 1.403 L-mg-1 with a Qmax of 8.921 mg-g-1. Qmax for phosphorus using various adsorbents are summarized in Table 7. Kanuma mud, geothite, lagoon fly ash, wood fibre, alumina-coated carboxylate, ACF-La, and lanthanum-doped vesuvianite showed lower Qmax than that of this study (Saha et al., 2008; Yang et al., 2013; Zhang et al., 2011; Cheung and Venkitachalam, 2000; Zhong et al., 2007; Eberhardt et al., 2006; Li et al., 2009). Other adsorbents showed extremely high Qmax for phosphorus, of greater than 100 mg-g1 (Choi et al., 2012; Wen et al., 2014).
Leaching of sulfate from SCV and effects on phosphorus removal
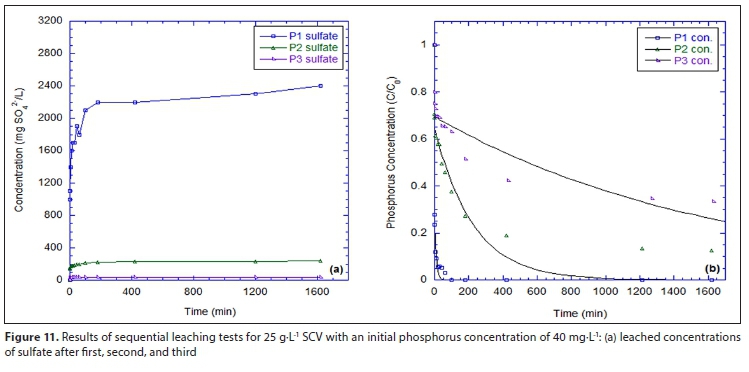
Sequential batch leaching tests were conducted to determine the amount of sulfate leached from SCV and its effects on phosphate removal. Test results are shown in Fig. 11 and summarized in Table 8.
In the first test (Phase 1, P1), the concentration of sulfate was dramatically increased from 0 to 1 800 mg-L-1 within 60 min and slowly increased to 2 400 mg-L-1. The leached concentrations of sulfate, however, were decreased to 240 mg-L-1 in the second test (Phase 2, P2) and 40 mg-L-1 in the third test (Phase 3, P3).
During the sequential batch leaching tests, phosphate concentrations were measured and analysed using Eq. 4 to obtain the kinetic parameters for phosphate removal. The removal rates of phosphate at a time of 1 600 min were 99.99% (P1), 87.5% (P2), and 66.75% (P3). The removal rate constant (Kobs) was rapidly decreased from 0.361 h-1 (P1) to 0.00087 h-1 (P3). Similar results were obtained for the instantaneous partition coefficient (Kp). The Kp (L-kg1) was quickly decreased from 113.2 at P1 to 17.5 at P3.
In the first test, concentration of sulfate was 2 400 mg-L-1, and in the second sulfate was only 240 mg-L-1. At the same time, phosphate removal efficiency decreased from 99.9 to 87.5%. A larger decrease in phosphate removal efficiency can be expected with decreased sulfate concentration. In the third experiment, as the sulfate concentration decreased from 240 mg-L-1 to 40 mg-L-1, the phosphorus removal efficiency decreased from 87.5% to 66.75%. The change in sulfate concentration is much larger than the change in phosphorus removal efficiency.
Therefore, the removal mechanism for phosphate was assumed to be the anion exchange with sulfate coated on the SCV.
Column tests
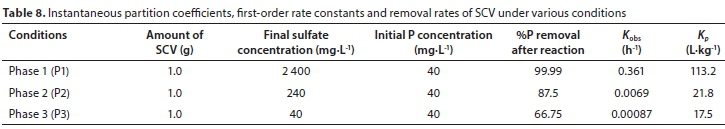
Results for the column tests are shown in Fig. 12 and Table 9. The effect of influent phosphate concentration on the breakthrough curve was examined in the range of 10-50 mg-L-1 at a flow rate of 5 mL-min-1. Increasing influent phosphate concentration resulted in decreasing the breakthrough time (Fig. 12a). A decrease in phosphate concentration resulted in a later breakthrough curve, and the treated volume of phosphate solution was greatest at the lowest influent concentration. In addition, the bed adsorption capacity (qe, mg-g1) increased from 7.5 to 19.5 at influent phosphate concentration of 10 and 50 mg-L-1, respectively. This could be explained by the high influent phosphate concentration, which provided a greater driving force for the transfer process to overcome mass transfer resistance (Na and Park, 2011; Woumfo et al., 2015); an increased ratio of phosphate to SCV amount also resulted in higher qe.
The effect of flow rate on the adsorption of phosphate was tested in the ranges of 3-7 mL-min-1 at an influent phosphate concentration of 25 mg-L-1. Breakthrough occurred faster at an increased flow rate. As the flow rate increased from 3 to 7 mL-min-1, the EBCT decreased from 237.6 to 101.8 min (Table 9), and qe(mg-g1) decreased from 16.6 to 13.1 (Table 9). The breakthrough curve became steeper as the flow rate increased because the phosphate did not have enough contact time with SCV at a high flow rate. This low contact time resulted in a lower phosphate removal efficiency.
Sun et al. (2014) reported that the qehad a range of 11.621.1 mg-g-1 in a column test using oxidized Mg3-Fe, and Woumfo et al. (2015) suggested a range of 2.8-5.9 mg-g-1 using an andosol-bagasse mixture. In the case of silica sulfate, Jutidamrongphan et al. (2012) reported a qeof 37.6 mg-g-1, higher than the qeof the present study.
CONCLUSIONS
The following conclusions were obtained after we evaluated the applicability of EV and SCV as adsorbents, and their adsorption capacity for removal of phosphorus from an aqueous solution. In general, EV was not effective for phosphorus removal but SCV showed good removal capacity for phosphorus.
Results of serial batch kinetic tests with SCV showed rapid phosphorus removal rates that could be successfully modelled by a first-order model with instantaneous adsorption. The rate constants and instantaneous partition coefficients increased with SCV/solution ratio. The removal rate constant Kobs (h1) shows a rapidly increasing pattern as the amount of SCV increases: 0.00015 at 1.0 g-L-1 to 0.5002 at 25 g-L-1. Furthermore, the instantaneous partition coefficient Kp(L-kg-1) was quickly increased, similarly to the removal rate constant, from 58.97 at 1 g-L-1 to 166.61 at 25 g-L-1.
For the tests with different initial phosphorus concentrations, the removal rate constants (Kobs, h1) decreased with initial phosphorus concentration but the instantaneous partition coefficients showed similar values regardless of initial phosphorus concentration.
From pseudo first-order and pseudo second-order model fits on the batch kinetic data, we found that the process of phosphate adsorption onto SCV was well described by the pseudo second-order model because of the high determination coefficient.
From the batch adsorption tests, we found that the Langmuir model was the most appropriate. The adsorption constant (Kl) for the Langmuir model was 1.403 L-mg-1 and Qmax of 8.921 mg-g1.
The bed adsorption capacity (qe) obtained from the column tests at a flow rate of 5 mL-min-1 were 7.47, 14.69 and 19.53 mg-g-1 at initial concentrations of 10, 25 and 50 mg-L-1, respectively.
The adsorption capacity values from the batch adsorption (Qmax) and the column tests (qe) were significantly different. We assume that a better adsorption environment was provided by the column tests rather than the batch adsorption tests.
The SCV used in this study showed excellent adsorption capacity compared to various sorbents evaluated in other studies. In particular, the SCV showed rapid phosphorus removal rates via instantaneous adsorption reaction and also had floating ability. In addition, the floating ability of SCV could give additional potential for the separation of SCV and water.
ACKNOWLEDGEMENTS
This work was funded by the National Research Foundation of Korea under Grant C-D-2018-0411.
REFERENCES
AKAY G, KESKINLER B, CAKICI A and DANIS U (1998) Phosphate removal from water by red mud using crossflow microfiltration. Water Res. 32 (3) 717-726. https://doi.org/10.1016/S0043-1354(97)00236-4 [ Links ]
AWUAL M and JYO A (2011) Assessing of phosphorus removal by polymeric anion exchangers. Desali"atio". 281 (2) 111-117. https://doi.org/10.1016/j.desal.2011.07.047 [ Links ]
BISWAS B, INOUE K, GHIMIRE K, OHTA S, HARADA H, OHTO K and KAWAKITA H (2007) The adsorption of phosphate from an aquatic environment using metal-loaded orange waste. J. Colloid I"terf. Sci. 312 (2) 214-223. https://doi.org/10.1016/j.jcis.2007.03.072 [ Links ]
BISWAS B, INOUE K, GHIMIRE K, HARADA H, OHTO K and KAWAKITA H (2008) Removal and recovery of phosphorus from water by means of adsorption onto orange waste gel loaded with zirconium. J. Bioresour. Tech"ol. 99 (18) 8685-8690. https://doi.org/10.1016/j.biortech.2008.04.015 [ Links ]
BOWDEN L, JARVIS A, YOUNGER P and JOHNSON K (2009) Phosphorus removal from waste waters using basic oxygen steel slag. E"vi-ro". Sci. Tech"ol. 43 (7) 2476-2481. https://doi.org/10.1021/es801626d [ Links ]
CABRITA M, SILVA A, OLIVEIRA P, ANGÉLICO M and NOGUEIRA M (2015) Assessing eutrophication in the Portuguese continental Exclusive Economic Zone within the European Marine Strategy Framework Directive. Ecol. I"dicators. 58 (2) 286-299. https://doi.org/10.1016/j.ecolind.2015.05.044 [ Links ]
CHEN L, WU P, CHEN M, LAI X, AHMED Z, ZHU N, DANG Z, BI Y and LIU T (2018) Preparation and characterization of the eco-friendly chitosan/vermiculite biocomposite with excellent removal capacity for cadmium and lead. Appl. Clay Sci. 159 (1) 74-82. https://doi.org/10.1016/j.clay.2017.12.050 [ Links ]
CHEUNG K and VENKITACHALAM T (2000) Improving phosphate removal of sand infiltration system using alkaline fly ash. Chemosphere. 41 (1) 243-249. https://doi.org/10.1016/S0045-6535(99)00417-8 [ Links ]
CHOI J, LEE S, LEE S, KIM E, PARK K, KIM D and HONG S (2012) Comparison of surface-modified adsorbents for phosphate removal in water. Water Air Soil Pollut. 223 (6) 2881-2890. https://doi.org/10.1007/s11270-011-1072-6 [ Links ]
CODD G, MORRISON L and METCALF J (2005) Cyanobacterial toxins: risk management for health protection. Toxicol. Appl. Pharmacol. 203 (3) 264-272. https://doi.org/10.1016/j.taap.2004.02.016 [ Links ]
DE-BASHAN L and BASHAN Y (2004) Recent advances in removing phosphorus from wastewater and its future use as fertilizer (19972003). Water Res. 38 (19) 4222-4246. https://doi.org/10.1016/jwatres.2004.07.014 [ Links ]
DEL CASTILLO H, GIL A and GRANGE P (1997) Preparation and characterization of sulfated titanium-modified pillared montmorillonite. Catal. Lett. 43 (1/2) 133-137. https://doi.org/10.1023/A:1018945329164 [ Links ]
DITTMANN E and WIEGAND C (2006) Cyanobacterial toxins - occurrence, biosynthesis and impact on human affairs. Mol. Nutr. Food Res. 50 (1) 7-17. https://doi.org/10.1002/mnfr.200500162 [ Links ]
EBERHARDT T, MIN S and HAN J (2006) Phosphate removal by refined aspen wood fiber treated with carboxymethyl cellulose and ferrous chloride. Bioresour. Technol. 97 (18) 2371-2376. https://doi.org/10.1016/j.biortech.2005.10.040 [ Links ]
ESTRADA V, MAGGIO J and DIAZ M (2011) Water sustainability: A systems engineering approach to restoration of eutrophic Lakes. Comp. Chem. Eng. 35 (8) 1598-1613. https://doi.org/10.1016/j.compchemeng.2011.03.003 [ Links ]
GUAN Q, HU X, WU D, SHANG X, YE C and KONG H (2009) Phosphate removal in marine electrolytes by zeolite synthesized from coal fly ash. Fuel. 88 (9) 1643-1649. https://doi.org/10.1016/j.fuel.2009.02.031 [ Links ]
HUANG W, YU X, TANG J, ZHU Y, ZHANG Y and LI D (2015) Enhanced adsorption of phosphate by flower-like mesoporous silica spheres loaded with lanthanum. Micropor. Mesopor. Mater. 217 (2) 225-232. https://doi.org/10.1016/j.micromeso.2015.06.031 [ Links ]
JUNG O, CHOI H and CHEONG K (2000) Phosphorus removal from synthetic wastewater by waste oyster shells. J. Environ. Health Sci. 26 (1) 43-49 (in Korean). [ Links ]
JUTIDAMRONGPHAN W, PARK K, DOCKKO S, CHOI J and LEE S (2012) High removal of phosphate from wastewater using silica sulfate. Environ. Chem. Lett. 10 (1) 21-28. https://doi.org/10.1007/s10311-011-0323-5 [ Links ]
KARACA S, GÜRSES A, EJDER M and ACIKYILDIZ M (2004) Kinetic modeling of liquid-phase adsorption of phosphate on dolomite. J. Colloid Interf. Sci. 277 (2) 257-263. https://doi.org/10.1016/j.jcis.2004.04.042 [ Links ]
KARTASHEVSKY M, SEMIAT R and DOSORETZ C (2015) Phosphate adsorption on granular ferric hydroxide to increase product water recovery in reverse osmosis-desalination of secondary effluents. Desalination. 364 (1) 53-61. https://doi.org/10.1016Zj.desal.2015.02.038 [ Links ]
KIM J, LIM C, KIM K, KIM D, LEE S and KIM J (2008) Application of adsorption characteristic of ferrous iron waste to phosphate removal from municipal wastewater. J. Kor. Soc. Environ. Agric. 27 (2) 231238 (in Korean). https://doi.org/10.5338/KJEA.2008.273.231 [ Links ]
KIM S and LEE T (2014) A study for the removal of phosphorous using coated exfoliated vermiculite. J. Kor. Geo-Environ. Soc. 15 (1) 5-13 (in Korean). https://doi.org/10.14481/jkges.2014.15.12.5 [ Links ]
KOPPENSTEINER B (1998) The degradation of the herbicides alachlor and metolachlor by iron metal in water and soil systems. MSc dissertation, University of Wisconsin Madison. 83 pp. [ Links ]
KUMAR P, SUDHA S, CHAND S and SRIVASTAVA V (2010) Phosphate removal from aqueous solution using coir-pith activated carbon. Sep. Sci. Technol. 45 (10) 1463-1470. https://doi.org/10.1080/01496395.2010.485604 [ Links ]
LAPOINTE B, HERREN L, DEBORTOLI D and VOGEL M (2015) Evidence of sewage-driven eutrophication and harmful algal blooms in Florida's Indian River Lagoon. Harmful Algae. 43 (1) 82-102. https://doi.org/10.1016/j.hal.2015.01.004 [ Links ]
LEE Y and YIM S (2011) Adsorption removal of phosphate from aqueous solution by olivine. J. Kor. Soc. Water Qual. 27 (4) 516-522. (In Korean). [ Links ]
LI H, RU J, YIN W, LIU X, WANG J and ZHANG W (2009) Removal of phosphate from polluted water by lanthanum doped vesuvianite. J. Hazardous Mater. 168 (1) 326-330. https://doi.org/10.1016/j.jhazmat.2009.02.025 [ Links ]
LIU C, WU P, ZHU Y and TRAN L (2016) Simultaneous adsorption of Cd2+ and BPA on amphoteric surfactant activated montmorillonite. Chemosphere. 144 (8) 1026-1032. https://doi.org/10.1016/jxhemosphere.2015.09.063 [ Links ]
LIU S, WU P, CHEN M, YU L, KANG C, ZHU N and DANG Z (2017) Amphoteric modified vermiculites as adsorbents for enhancing removal of organic pollutants: bisphenol A and tetrabromobisphenol A. Environ. Pollut. 228 (2) 277-286. https://doi.org/10.1016/j.envpol.2017.03.082 [ Links ]
LONG H, WU P, YANG L, HUANG Z, ZHU N and HU Z (2014) Efficient removal of cesium from aqueous solution with vermiculite of enhanced adsorption property through surface modification by ethylamine. J. Colloid Interf. Sci. 428 (2) 295-301. https://doi.org/10.1016/j.jcis.2014.05.001 [ Links ]
LU N and LIU J (2010) Removal of phosphate and fluoride from wastewater by a hybrid precipitation-microfiltration process. Sep. Purif. Technol. 74 (3) 329-335. https://doi.org/10.1016/j.seppur.2010.06.023 [ Links ]
LÜRLING M and OOSTERHOUT F (2013) Controlling eutrophication by combined bloom precipitation and sediment phosphorus inactivation. Water Res. 47 (17) 6527-6537. https://doi.org/10.1016/j.watres.2013.08.019 [ Links ]
LÜRLING M, WAAJEN G and OOSTERHOUT F (2014) Humic substances interfere with phosphate removal by lanthanum modified clay in controlling eutrophication. Water Res. 54 (1) 78-88. https://doi.org/10.1016/j.watres.2014.01.059 [ Links ]
MALANDRINO M, ABOLLINO O, GIACOMINO A, ACETO M and MENTASTI E (2006) Adsorption of heavy metals on vermiculite: Influence of pH and organic ligands. J. Colloid Interf. Sci. 299 (2) 537-546. https://doi.org/10.1016/j.jcis.2006.03.011 [ Links ]
MCBRIDE M (1994) Environmental Chemistry of Soils. Oxford University, Oxford. [ Links ]
MEDEIROS M, SANSIVIERO M, ARAÚJO M and LAGO R (2009) Modification of vermiculite by polymerization and carbonization of glycerol to produce highly efficient materials for oil removal. Appl. Clay Sci. 45 (4) 213-219. https://doi.org/10.1016/jxlay.2009.06.008 [ Links ]
MUIAMBO H, FOCKE W, ATANASOVA M and BENHAMIDA A (2015) Characterization ofurea-modified palabora vermiculite. Appl. Clay Sci. 105 (1) 14-20. https://doi.org/10.1016/jxlay.2014.12.019 [ Links ]
MÜNCH E and BARR K (2001) Controlled struvite crystallisation for removing phosphorus from anaerobic digester sidestreams. Water Res. 35 (1) 151-159. https://doi.org/10.1016/S0043-1354(00)00236-0 [ Links ]
NA C and PARK H (2011) Applicability of theoretical adsorption models for studies on adsorption properties of adsorbents[ll]. J. Kor. Soc. Environ. Eng. 33 (4) 804-811. https://doi.org/10.4491/KSEE.2011.33.11.804 [ Links ]
NGUYEN T, NGO H, GUO W, LIANG S, LEE D, NGUYEN P and BUI X (2014) Modification of agricultural waste/by-products for enhanced phosphate removal and recovery: Potential and obstacles. Bioresour. Technol. 169 (3) 750-762. https://doi.org/10.1016/j.biortech.2014.07.047 [ Links ]
NING P, BART H, LI B, LU X and ZHANG Y (2008) Phosphate removal from wastewater by model-La(III) zeolite adsorbents. J. Environ. Sci. 20 (6) 670-674. https://doi.org/10.1016/S1001-0742(08)62111-7 [ Links ]
OGATA F, IMAI D, TODA M, OTANI M and KAWASAKI N (2015) Adsorption of phosphate ion in aqueous solutions by calcined cobalt hydroxide at different temperatures. J. Environ. Chem. Eng. 3 (3) 1570-1577. https://doi.org/10.1016/j.jece.2015.05.028 [ Links ]
OLADOJA N, OLOLADE I, ADESINA A, ADELAGUN R and SANI Y (2013) Appraisal of gastropod shell as calcium ion source for phosphate removal and recovery in calcium phosphate minerals crystallization procedure. Chem. Eng. Res. Design. 91 (5) 810-818. https://doi.org/10.1016/jxherd.2012.09.017 [ Links ]
PELEKA E and DELIYANNI E (2009) Adsorptive removal of phosphates from aqueous solutions. Desalination. 245 (1) 357-371. https://doi.org/10.1016/j.desal.2008.04.050 [ Links ]
PRADHAN J, DAS J, DAS S and THAKUR R (1998) Adsorption of phosphate from aqueous solution using activated red mud. J. Colloid Interf. Sci. 204 (1) 169-172. https://doi.org/10.1006/jcis.1998.5594 [ Links ]
RUIXIA L, JINLONG G and HONGXIAO T (2002) Adsorption of fluoride, phosphate, and arsenate ions on a new type of ion exchange fiber. J. Colloid Interf. Sci. 248 (2) 268-274. https://doi.org/10.1006/jcis.2002.8260 [ Links ]
SAHA B, CHAKRABORTY S and DAS G (2008) A mechanistic insight into enhanced and selective phosphate adsorption on a coated carboxylated surface. J. Colloid Interf. Sci. 331 (1) 21-26. https://doi.org/10.1016/j.jcis.2008.11.007 [ Links ]
SHIN E, HAN J, JANG M, MIN S, PARK J and ROWELL R (2004) Phosphate adsorption on aluminium-impregnated mesoporous silicates: surface structure and behavior of adsorbents. Environ. Sci. Technol. 38 (3) 912-917. https://doi.org/10.1021/es030488e [ Links ]
SONG J, LEE J, KIM S and LEE T (2009) Evaluation of removal properties of Cu(n) from aqueous solutions by inflated vermiculites. J. Kor. Geo-Environ. Soc. 10 (1) 25-32 (in Korean). [ Links ]
SONG Y, YUAN P, ZHENG B, PENG J, YUAN F and GAO Y (2007) Nutrients removal and recovery by crystallization of magnesium ammonium phosphate from synthetic swine wastewater. Chem-osphere. 69 (2) 319-324. https://doi.org/10.1016/jxhemosphere.2007.06.001 [ Links ]
SOUSA A, BRAGA T, GOMES E, VALENTINI A and LONGHINOTTI E (2012) Adsorption of phosphate using mesoporous spheres containing iron and aluminum oxide. J. Chem. Eng. 210 (1) 143-149. https://doi.org/10.1016/j.cej.2012.08.080 [ Links ]
SUN X, IMAI T, SEKINE M, HIGUCHI T, YAMAMOTO K, KANNO A and NAKAZONO S (2014) Adsorption of phosphate using calcined Mg3-Fe layered double hydroxides in a fixed-bed column study. J. Ind. Eng. Chem. 20 (5) 3623-3630. https://doi.org/10.1016/j.jiec.2013.12.057 [ Links ]
TEKILE A, KIM I and KIM J (2015) Mini-review on river eutrophication and bottom improvement techniques, with special emphasis on the Nakdong River. J. Environ. Sci. 30 (1) 113-121. https://doi.org/10.1016/j.jes.2014.10.014 [ Links ]
UNNITHAN M, VINOD V and ANIRUDHAN T (2002) Ability of Iron(III)-Loaded carboxylated polyacrylamide-grafted sawdust to remove phosphate ions from aqueous solution and fertilizer industry wastewater: Adsorption kinetics and isotherm studies. J. Appl. Polymer Sci. 84 (13) 2541-2553. https://doi.org/10.1002/app.10579 [ Links ]
VAIOPOULOU E, MELIDIS P and AIVASIDIS A (2007) Growth of filamentous bacteria in an enhanced biological phosphorus removal system. Desalination. 213 (1) 288-296. https://doi.org/10.1016/j.desal.2006.02.101 [ Links ]
WEN Z, ZHANG Y and DAI C (2014) Removal of phosphate from aqueous solution using nanoscale zerovalent iron (nZVI). Colloids and Surfaces A. Physicochem. Eng. Aspects. 457 (3) 433-440. https://doi.org/10.1016/j.colsurfa.2014.06.017 [ Links ]
WOUMFO E, SIEWE J and NJOPWOUO D (2015) A fixed-bed column for phosphate removal from aqueous solutions using an andosol-bagasse mixture. J. Environ. Manage. 151 (2) 450-460. https://doi.org/10.1016/j.jenvman.2014.11.029 [ Links ]
YANG S, DING D, ZHAO Y, HUANG W, ZHANG Z, LEI Z and YANG Y (2013) Investigation of phosphate adsorption from aqueous solution using Kanuma mud: Behaviors and mechanisms. J. Environ. Chem. Eng. 1 (3) 355-362. https://doi.org/10.1016/j.jece.2013.05.016 [ Links ]
YANG S, WU P, LIU J, CHEN M, AHMED Z and ZHU N (2018) Efficient removal of bisphenol A by superoxide radical and singlet oxygen generated from peroxymonosulfate activated with Fe0-montmorillonite. Chem. Eng. J. 350 (3) 484-495. https://doi.org/10.1016/j.cej.2018.04.175 [ Links ]
YEOM S and JUNG K (2008) Recycling wasted scallop shell as an adsorbent for the removal of phosphate. J. Ind. Eng. Chem. 15 (1) 40-44. https://doi.org/10.1016/j.jiec.2008.08.014 [ Links ]
YUAN M, CARMICHAEL W and HILBORN E (2006) Microcystin analysis in human sera and liver from human fatalities in Caruaru, Brazil 1996. Toxicon. 48 (6) 627-640. https://doi.org/10.1016/j.toxicon.2006.07.031 [ Links ]
YU X, WEI C, KE L, HU Y, XIE X and WU H (2010) Development of organovermiculite-based adsorbent for removing anionic dye from aqueous solution. J. Hazardous Mater. 180 (1) 499-507. https://doi.org/10.1016/j.jhazmat.2010.04.059 [ Links ]
ZENG L, LI X and LIU J (2004) Adsorptive removal of phosphate from aqueous solutions using iron oxide tailings. Water Res. 38 (5) 13181326. https://doi.org/10.1016/j.watres.2003.12.009 [ Links ]
ZHANG L, WAN L, CHANG N, LIU J, DUAN C, ZHOU Q, LI X and WANG X (2011) Removal of phosphate from water by activated carbon fiber loaded with lanthanum oxide. J. Hazardous Mater. 190 (1) 848-855. https://doi.org/10.1016/j.jhazmat.2011.04.021 [ Links ]
ZHONG B, STANFORTH R, WU S and CHEN J (2007) Proton interaction in phosphate adsorption onto goethite. J. Colloid Interf. Sci. 308 (1) 40-48. https://doi.org/10.1016/j.jcis.2006.12.055 [ Links ]
 Correspondence:
Taeyoon Lee
Email: badger74w@pknu.ac.kr
Received: 18 February 2019
Accepted: 14 August 2020

