


Services on Demand
Article
 English (pdf)
 Article in xml format
 Article references
Indicators

Related links
-
 Cited by Google
 -
 Similars in Google
Share

 Permalink
Water SA
On-line version ISSN 1816-7950
Print version ISSN 0378-4738
Water SA vol.46 n.4 Pretoria Oct. 2020
http://dx.doi.org/10.17159/wsa/2020.v46.i4.9071
RESEARCH PAPER
Responses of macroinvertebrate community metrics to urban pollution in semi-arid catchments around the city of Bulawayo, Zimbabwe
Tongayi MwedziI; Nqobizitha SizibaII; Oghenekaro Nelson OdumeIII; Eisen NyamazanaI; Innocent MabikaI
IDepartment of Wildlife, Ecology and Conservation, Chinhoyi University of Technology, P/Bag 7724, Chinhoyi, Zimbabwe
IIDepartment of Biology, Chinhoyi University of Technology, P/Bag 7724, Chinhoyi, Zimbabwe
IIIUnilever Centre for Environmental Water Quality, Institute for Water Research, Rhodes University, PO Box 94, Makhanda 6140, South Africa
ABSTRACT
River health monitoring is becoming increasingly important because of the anthropogenic activities that continue to impact on water quality and biodiversity of aquatic systems. This study aimed at identifying and evaluating macroinvertebrate community-based metrics that best respond to degradation due to urban pollution in riverine systems of Bulawayo, Zimbabwe. Data (physicochemical variables and macroinvertebrate specimens) were collected from 17 sites over 3 seasons. The sites were selected across an impairment gradient comprising less impacted, moderately impacted and heavily impacted sites. Heavily impacted sites had the highest levels of total dissolved solids, conductivity, salinity, turbidity, total phosphates, total nitrogen, chemical oxygen demand and sedimentary zinc. Dissolved oxygen was significantly highest in less impacted sites. Sensitivity of 24 macroinvertebrate metrics to this impairment gradient were assessed. A total of 5 metrics were identified as sensitive to modifications in water quality due to urban pollution. These metrics were taxon richness, South African Scoring System (SASS5) score, average score per taxon (ASPT), percentage collectors and percentage scrapers. The selected metrics will be useful for the monitoring and assessment of the studied riverine systems and can be further integrated into one multimetric index that combines a range of indices and allows the integration of ecological information for better management of aquatic ecosystems in this region.
Keywords: Multimetric System, Biomonitoring, Water Quality, Pollution
INTRODUCTION
The adverse impacts of human actions on aquatic ecosystems have provoked global calls for the better management of these ecosystems and development of monitoring techniques (Cao et al., 1996; Adams, 2002; Bere, 2016; Dolédec and Statzner, 2010; Hodkinson and Jackson, 2005). There are converging ideas on the utilization of inhabitant organisms in aquatic systems to monitor the ecological conditions of ecosystems (biomonitoring) (Siziba, 2017). While biomonitoring has become an international practice, some regions have made significant progress, e.g., Australia, the United States of America, and Europe (Suriano et al., 2011; Dahm et al., 2013; Lorenz et al., 2016). Tropical regions, which include most of the developing countries, have lagged behind in this regard and have often adopted indices developed in other regions (Suriano et al., 2011).
Several macroinvertebrate-based biomonitoring methods and indices have been developed, starting with the saprobic system (Kolkwitz and Marsson, 1909). Other biomonitoring techniques include the Biological Monitoring Working Party Score System - BMWP (Armitage et al., 1983), Family Biotic Index- FBI (Hilsenhoff, 1987), and South African Scoring System - SASS (Dickens and Graham, 2002; Chutter, 1994, 1998). These biomonitoring methods, e.g., the SASS and BMWP are based on presence and absence of aquatic macroinvertebrate families and the tolerance of these to pollution. However, the effectiveness of biotic indices is limited as a measure of overall ecological integrity as it reduces data into one index score. This is problematic as organisms respond differently to various types of degradation in the environment (Monaghan, 2016). Thus, ecological research is moving towards the use of multimetric indices to integrate information from multiple biological organisations to capture a wider variety of responses to various environmental stressors (Collier, 2008; Elliott et al., 2018; Singh and Saxena, 2018). In Europe, the multimetric system approach has been adopted as the main instrument for assessing the ecological quality of water, following proposals established by the European Commission Water Framework Directive (European Commission, 2000).
The multimetric approach consists of several metrics associated with biological attributes like functional feeding groups, species composition, pollution tolerance and trophic structure metrics. These metrics have to undergo rigorous evaluation before inclusion in a multimetric index (Hawkins et al., 2010; Feld et al., 2014; Gonçalves and Menezes, 2011; Suriano et al., 2011; Odume et al., 2012). Inclusion of individual metrics into a multimetric index is dependent on a range of considerations, including the metric sensitivity to the stressor being investigated, seasonal stability, the occurrence in the ecoregion of interest and predictable response to the stressor. The implication is that multimetric indices vary in sensitivity, complexity and region of implementation (Feld et al., 2014; Suriano et al., 2011). Selected metrics are those that show significant change that can be related to the disturbance in a predictable way. Thus, metrics are tested and validated for performance before they are included in the multimetric index for use in a targeted area (Klemm et al., 2002).
In Zimbabwe, little work has been done on the testing and validation of macroinvertebrate-based metrics used to distinguish water quality between polluted sites and less impacted sites (Bere and Nyamupingidza, 2014). The current study focused on the responses of macroinvertebrate community metrics to urban-induced pollution of riverine systems in semi-arid catchments around Bulawayo, Zimbabwe. The City of Bulawayo is on a watershed of three sub-catchments; Upper Gwayi, Upper Umzingwane and Shashe, with one catchment (Upper Gwayi) being considerably urbanized and impacted. On the other hand, the Upper Umzingwane and Shashe sub-catchments constitute low-density agricultural and protected areas. The different activities within this study area provide a distinct opportunity to evaluate the response of macroinvertebrate metrics to water quality modifications in contrasting land-use settings (Siziba et al., 2017). The objective of this study was to identify and evaluate macroinvertebrate community-based metrics that best respond to degradation due to urban pollution in riverine systems of Bulawayo, Zimbabwe. It is anticipated that this study will be a fundamental step towards the development of a relevant multimetric index for the sustainable management of the riverine systems within this water-stressed region.
METHODS
Study area
The study was done in Bulawayo (Zimbabwe) (Fig. 1). The area is prone to droughts, with a mean annual rainfall of 550 mm and mean annual and minimum temperatures of 25.8°C and 12.7°C, respectively (Mugandani et al., 2013). The city is located on the watershed with most of the rivers in the region radiating from a close proximity to the city. In the upper Gwayi catchment, we sampled the Khami and Umguza Rivers. These rivers drain poorly treated wastewater from Bulawayo. Umzingwane and Ncema Rivers were sampled in the Upper Umzingwane catchment - a catchment that is not affected by wastewater from the City of Bulawayo. Maleme and Hovhi Rivers were sampled in the Shashe catchment - the rivers flow through the Matobo National Park and surrounding areas with very low population densities. A field reconnaissance survey was used for the selection of 17 sites (Fig. 1) that were sampled 3 times in 2015, i.e., hot wet season (February), hot dry season (October) and cold dry season (July).

Measurement of physicochemical variables
In the field, water samples (500 mL, n = 3) were collected at each site, using acid-cleaned polyethylene containers at a depth of 20-30 cm, and fixed with 3 drops of concentrated sulphuric acid. The samples were transported to the laboratory for analyses. The parameters measured on site include: (i) dissolved oxygen (DO) and temperature using a portable dissolved oxygen meter (AMI 605, Martini Instruments, USA); (ii) pH, electrical conductivity (EC) and total dissolved solids (TDS) using a portable pH/conductivity/TDS combination meter (MW801, Milwaukee, USA); (iii) water velocity using a flow velocity meter (FP 201 global flow probe, USA); and (iv) turbidity using a turbidity meter (MI415, Martini Instruments, USA). Sediment samples were also collected at each site using a sediment grab sampler (1.5 kg, n = 2, depth of ~5-10 cm) and transferred into polyethylene ziplock bags. These were oven-dried at 60°C in the laboratory until constant weight was attained.
In the laboratory, the nesslerization method (APHA, 1988) was used for determining total phosphates (TP) in water samples. The amount of total nitrogen (TN) in water was determined by oxidising nitrogenous compounds to nitrate following the method of Korroleff (1972). Biological oxygen demand (BOD) and chemical oxygen demand (COD) were determined by oxidation of potassium dichromate following Jirka and Carter (1975). The two-staged nitric acid, perchloric acid method (APHA, 1988) was used for digesting sediment samples. A flame atomic absorption spectrophotometer (Varian Australia Pty Ltd, Victoria Australia) was then used in determining total concentrations of copper (Cu), lead (Pb), cobalt (Co), chromium (Cr), zinc (Zn), nickel (Ni) and cadmium (Cd) in the sediment and water samples.
Macroinvertebrate sampling
At each sampling site, macroinvertebrates were collected using a macroinvertebrate net (mesh size 1 000 μm) following the South African Scoring System Version 5 (SASS5) protocol (Dickens and Graham, 2002). The samples were pooled into one composite sample. Macroinvertebrates were identified in the field to family (in some cases class) level using keys by Barbour et al. (1999), Gerber and Gabriel (2002), De Moor et al. (2003a), and De Moor et al. (2003b). Those macroinvertebrates that could not be identified in the field were preserved in 70% alcohol and transported to the laboratory for identification. The number of taxa and abundance of each taxa present at each site were counted and recorded.
Data analysis
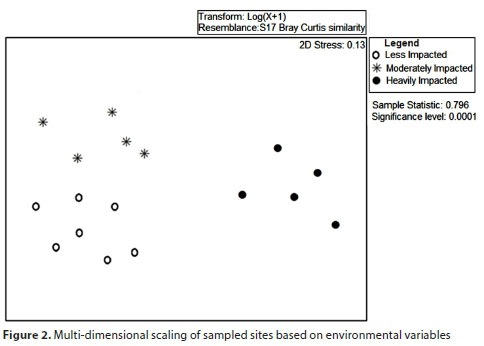
Data from the different seasons were combined following studies by Clarke et al. (2002) and Humphrey et al. (2000) and recommendations by Cao and Hawkins (2011) in developing indices. We used multidimensional scaling (MDS) based on environmental variable data to assess the similarity of sampled sites. Data was log transformed to improve normality before ordinations were done. Using this method, the sites were grouped into 3 clusters according to the level of pollution. Differences in the physicochemical characteristics of these sites were tested through one-way analysis of variance (ANOVA) with Tukey's post-hoc test after data were tested for normality and homogeneity of variance using Kolmogorov-Smirnov and Levene's tests, respectively.
Macroinvertebrate data were used in calculating a total of 24 metrics (commonly used in Zimbabwe) belonging to 4 metric categories (composition measures, diversity measures, functional measures and tolerance measures) for each site (Table 1). Metrics were assessed for their ability to discriminate between less impacted and heavily impacted sites, following Jun et al. (2012). Metrics with low values across sites were left out at this stage because they poorly discriminated between sites.
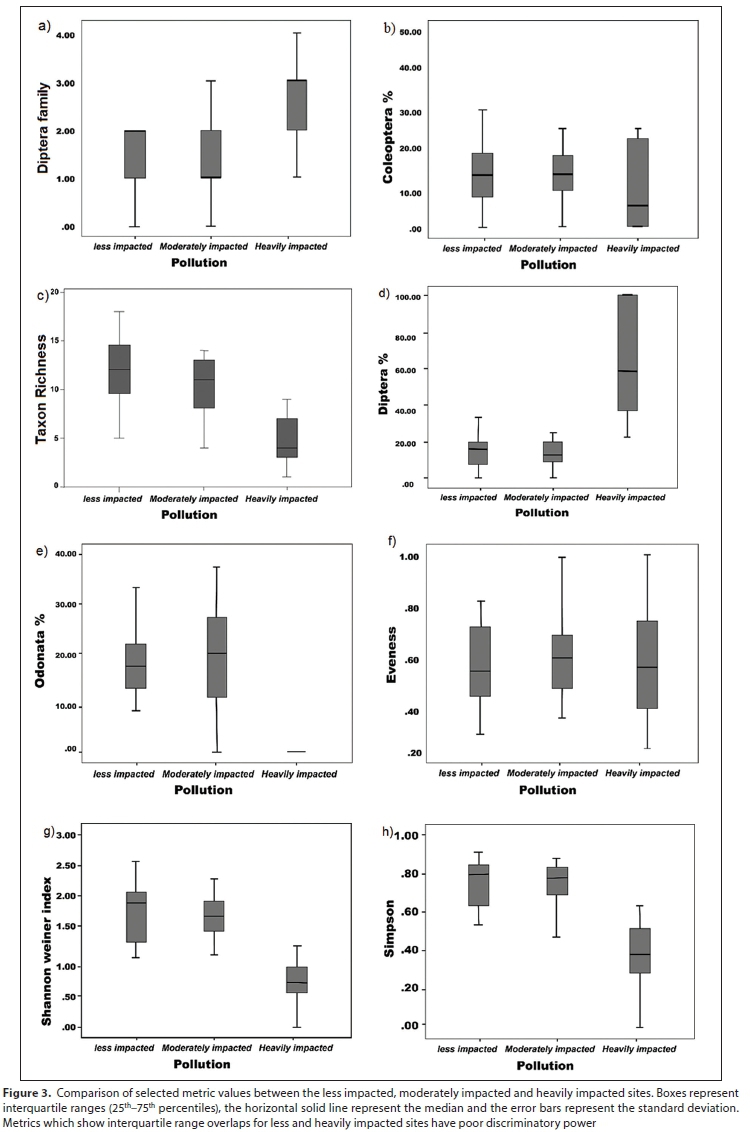
Box and whisker plots were then used to assess metrics' potential to differentiate less impacted and heavily impacted sites. The assessment was based on the extent of median and inter-quartile range overlap of the less impacted and heavily impacted sites. Metrics that did not have overlaps in inter-quartile range and that showed gradual change through the moderately impacted category were regarded as having strong discriminatory power. A redundancy check (using Spearman's correlation analysis, r > 0.80, p < 0.05) within each metric category was conducted for metrics that met this criterion. The sensitivity of each of these metrics to environmental changes was then finally assessed using Spearman's correlation analysis (Cao et al., 1996, Baptista et al., 2013, Hering et al., 2006).
RESULTS
Site classification and environmental characteristics
Multidimensional scaling (MDS), based on environmental variable data (Fig. 2), grouped the sites into three groups. Group 1 consisted of heavily impacted sites and these sites were within the urban areas. Group 2 consisted of moderately impacted sites and these sites were generally further downstream of urban areas. Group 3 consisted of less impacted sites and consisted of rivers that were not impacted by wastewater from Bulawayo.
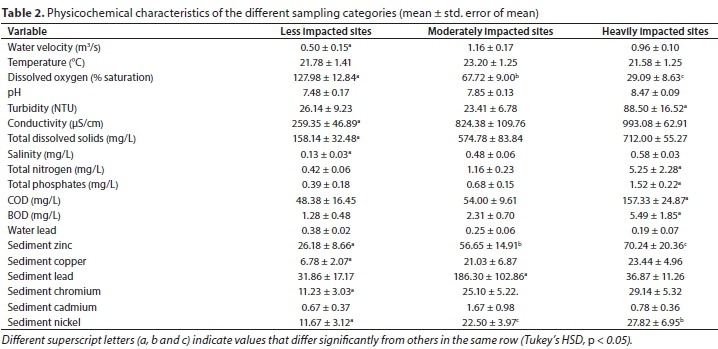
Of the 24 physicochemical variables that were assessed, 5 variables - Cu, Co, Cd, Zn and Ni - from the water column were not detectable by the atomic absorption spectrophotometer (<0.01 mg/L). These variables were therefore left out of the subsequent analyses. Significant differences among site categories were observed in DO, water velocity, conductivity, TDS, salinity, turbidity, TN, TP, COD, BOD and sediment Zn, le Ni, Cr, Ni and Pb (ANOVA, p < 0.05, Table 2). DO and sediment Zn and Ni differed significantly among all the site categories (Tukey's, p <0.05). Dissolved oxygen was highest for less impacted sites and lowest for heavily impacted sites, while sediment Zn and sediment Ni were lowest at less impacted sites and highest at the heavily impacted sites. Water velocity, conductivity, TDS, salinity and sediment Cr and Ni were significantly lower at the less impacted sites (Tukey's, p < 0.05), relative to the other two site categories which did not vary. Heavily impacted sites had significantly higher turbidity, TN, TP, COD and BOD (Tukey's, p < 0.05) relative to the other two site categories which did not vary. Sediment Pb was significantly higher at the moderately impacted sites (Tukey's, p < 0.05) relative to the other two site categories which did not vary.
Macroinvertebrate metrics' sensitivity to urban pollution
The first criterion was not met by 11 of the original 24 metrics due to the fact that they had low values that did not enable identification of deterioration in environmental quality. Thus Plecoptera family, Trichoptera family, Ephemeroptera family, % EPT, % Ephemeroptera, % Plecoptera, % Trichoptera, EPT Taxa, Baetidae/Ephemeroptera ratio, % filters and % shredders were dropped at this stage. Of the 13 metrics that were evaluated through the box and whisker criterion, % Coleoptera and evenness showed overlap in interquartile ranges between less impacted and heavily impacted sites (Fig. 3b, e). These metrics were therefore dropped at this stage. Six metrics (Diptera family, % Diptera, % Odonata, Shannon-Wiener index, Simpson's index and % predators) revealed differences between heavily impacted and less impacted sites but failed to show a gradual change in the moderately impacted category (Fig. 3a, d, e, g, h and k, respectively). Diptera family and % Diptera metrics increased in heavily impacted sites while % Odonata, Shannon-Wiener index, Simpson's index and % predators metrics decreased in heavily impacted sites. Only 5 metrics (taxon richness, % collectors, % scrapers, ASPT and SASS score) clearly discriminated less impacted, moderately impacted and heavily impacted sites (Fig. 3c, i, j, l and m, respectively). Percentage collectors showed a gradual increase following degradation in habitat quality due to urban pollution while % scrapers, ASPT, SASS score and taxon richness metrics showed a gradual decrease with increase in habitat degradation due to urban pollution. These metrics were tested for redundancy and none were redundant. They were therefore considered to be potentially suitable for assessing degradation in habitat quality due to urban pollution.
Metrics response to physicochemical variables
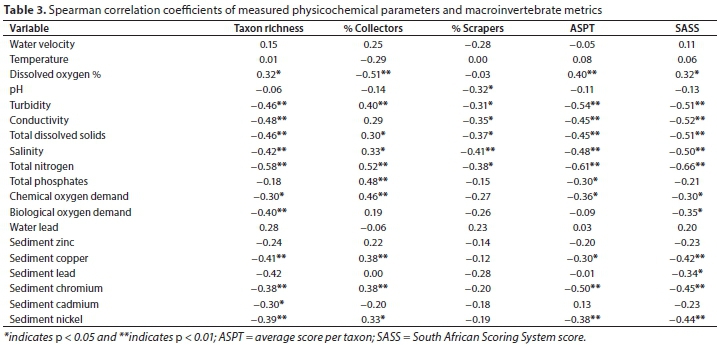
The correlations between the selected metrics and physicochemical variables are given in Table 3. All of the 5 remaining metrics correlated with 6 to 12 physico-chemical parameters (p < 0.05, Table 3). Percentage collectors increased with corresponding increases in pollution, as shown by increases in turbidity, total dissolved solids, salinity, total phosphates, total nitrogen, chemical oxygen demand and heavy metals (chromium, copper and nickel) (Table 3). These metrics decreased in conditions with less pollution, e.g., with an increase in dissolved oxygen. On the other hand, taxon richness, % scrapers, ASPT and SASS metrics decreased with corresponding increases in physicochemical parameters that indicate pollution (Table 3), e.g., increased turbidity, conductivity, TDS, salinity, TN, TP, COD, BOD and heavy metals (copper, lead, chromium, cadmium and nickel).
DISCUSSION
The results indicate that urbanization has impacted on the ecological health of the riverine systems receiving the wastewater of Bulawayo. Multidimensional scaling (MDS) based on environmental variable data (Fig. 2) grouped the sampled sites into 3 clusters clearly distinguishing polluted urban sites from the less polluted sites. The relatively higher concentrations of pollutants in Bulawayo's city areas could be due to a high sewage influx and industrial effluents which have become prominent problems in the area (Siziba, 2017). This corroborates other studies that have shown that urban streams countrywide are polluted (Dube et al., 2010; Bere, 2016; Mwedzi et al., 2016b). However, these urban streams often demonstrate some self-purification capacity as the water quality improves along the river course further downstream (Ndebele-Murisa Mzime, 2012). Recovery is mainly attributed to the vegetation along the river course that acts as a sponge, and sediment that acts as a sink for nutrients and pollutants, cleaning up and revitalising the stream (Ndebele-Murisa Mzime, 2012). As a result, the water quality observed further downstream in this study (some kilometres away from the city) had greatly improved and formed another category, i.e., of moderately impacted sites.
The metrics of number of EPT, Baetidae/Ephemeroptera ratio and % EPT taxa were dropped early in the data analysis because their values were too low. Other studies have reported that metrics such as EPT taxa are excellent indicators of habitat quality and environmental degradation as their tolerance levels differ along pollution gradients (Klemm et al., 2002; Weigel et al., 2002; Whittier et al., 2007). However, Bressler et al. (2006) argue that regions have different assemblage characteristics and EPT metrics are only useful when EPT fauna naturally make up large proportions of the fauna. This is not the case in our study area and in tropical Africa in general, e.g., Plecoptera has low taxon richness (Masese and Raburu, 2017; Minaya et al., 2013). Furthermore, studies which have used EPT taxa in tropical Africa have provided mixed results, as a number of Ephemeroptera, Plecoptera and Trichoptera taxa (e.g., Caenidae, Baetidae, Hydropsychidae) can withstand a wide range of environmental deterioration (Minaya et al., 2013; Kasangaki et al., 2008; Kilonzo et al., 2014; Kaboré et al., 2016; Lakew and Moog, 2015). Hence EPT taxa has been reported with high abundances in polluted areas (Masese et al., 2014). It is therefore imperative that the EPT taxa metrics are evaluated and modified to suit local conditions before they can be applied in this region.
Functional metrics are said to be sensitive to changes in the environment, with each feeding group predicted to respond to accumulation of a particular food source (Ramirez and Gutiérrez-Fonseca, 2014; Jun et al., 2012; Merritt et al., 1996). Amongst the selected functional metrics in this study, % collectors and % scrapers were good indicators of urban pollution. Greater abundances of collectors were found at heavily impacted sites (Fig. 3i). This is because of the existence of large amounts of organic matter at such sites. We recorded low values of % shredders and % filters at all sites. Other studies in the tropics have also reported low numbers of shredders (Hyslop and Hunte-Brown, 2012; Mwedzi et al., 2016b). This is attributed to fast decomposition rates owing to the higher temperatures of water in the tropics (Hyslop and Hunte-Brown, 2012; Mwedzi et al., 2016b). Microbial action therefore takes the place of shredders in tropical streams. Consequently, input into tropical streams is usually in the form of fine particulate organic matter (FPOM), that collectors ingest directly. Furthermore, some leaves of tropical trees contain secondary compounds that make them unpalatable for shredders (Jun et al., 2012). Shredders are therefore localised specialists in the tropics, and are therefore not suitable as indicators of degradation in habitat quality (Mwedzi et al., 2016b).
Five metrics (taxon richness, % collectors, % scrapers, SASS5 and ASPT) clearly discriminated between less impacted and heavily impacted sites and did not show any overlap in interquartile ranges. Collectors which feed on fine particulate matter typically increased at highly polluted sites that had large quantities of organic material. This makes the % collectors metric a good indicator of organic pollution, as observed by Weigel et al. (2002).
Taxon richness decreased markedly along the pollution gradient (i.e., from less impacted sites to heavily impacted sites (Fig. 3c). This is in line with the universal paradigm that under environmental degradation aquatic biodiversity declines (Bunn and Arthington, 2002; Gallardo et al., 2011). Given that only a few specialized families can adapt to polluted environments, other metrics like % scrapers, ASPT and SASS5 also decreased at heavily impacted sites (Fig. 3j, l and m, respectively). ASPT and SASS5 are sensitivity metrics that have been shown to respond to habitat degradation, and especially organic pollution, in various studies in southern Africa (Bere and Nyamupingidza, 2014; Mwedzi et al., 2016b; Gratwicke, 1998; Gordon et al., 2015)
Metrics that correlate with at least one environmental variable are usually considered acceptable as they effectively reflect human influence (Jun et al., 2012). The correlation of the 8 metrics with 6 to 12 physicochemical parameters (Table 3) in this study indicates that they are powerful predictors of habitat quality and can easily detect degradation in habitat quality due to urban pollution. The final set of metrics chosen in this study therefore forms a stepping-stone for the development of future multimetric indices relevant to the region. Furthermore, our study shows that only a subset of the metrics used in the region are excellent discriminators of heavily polluted sites and less polluted sites. Metric selection is therefore of paramount importance in assessing pollution in the region as not all metrics are good discriminators of heavily polluted and unpolluted sites.
ACKNOWLEDGEMENTS
This study was made possible by the provision of funds from the International Foundation for Science and the Science Initiative Group through the Carnegie Foundation-funded Regional Initiatives in Science and Education (RISE).
REFERENCES
ADAMS SM (2002) Biological Indicators of Aquatic Ecosystem Stress. American Fisheries Society, Maryland. [ Links ]
ANUSA A, NDAGURWA H and MAGADZA C (2012) The influence of pool size on species diversity and water chemistry in temporary rock pools on Domboshawa Mountain, northern Zimbabwe. Afr. J. Aquat. Sci. 37 89-99. https://doi.org/10.2989/16085914.2012.666378 [ Links ]
APHA (1988) Standard Methods for the Examination of Water and Wastewater (20th edn.) American Public Health Association, Washington DC. [ Links ]
ARMITAGE P, MOSS D, WRIGHT J and FURSE M (1983) The performance of a new biological water quality score system based on macroinvertebrates over a wide range of unpolluted running-water sites. Water Res. 17 333-347. https://doi.org/10.1016/0043-1354(83)90188-4 [ Links ]
BAPTISTA DF, HENRIQUES-OLIVEIRA A, OLIVEIRA R, MUGNAI R, NESSIMIAN JL and BUSS D (2013) Development of a benthic multimetric index for the Serra da Bocaina bioregion in Southeast Brazil. Braz. J. Biol. 73 573-583. https://doi.org/10.1590/S1519-69842013000300015 [ Links ]
BARBOUR MT, GERRITSEN J, SNYDER BD and STRIBLING JB (1999) Rapid Bioassessment for Use in Streams and Wadeable Rivers: Periphyton, Benthic Macroinvertebrates and Fish. Environment Protection Agency, Washington DC. [ Links ]
BERE T (2016) Challenges of diatom-based biological monitoring and assessment of streams in developing countries. Environ. Sci. Pollut. Res. 23 5477-5486. https://doi.org/10.1007/s11356-015-5790-y [ Links ]
BERE T, CHIYANGWA G and MWEDZI T (2016a) Effects of land-use changes on benthic macroinvertebrate assemblages in the tropical Umfurudzi River, Zimbabwe. Afr. J. Aquat. Sci. 41 353-357. https://doi.org/10.2989/16085914.2016.1171201 [ Links ]
BERE T, DALU T and MWEDZI T (2016b) Detecting the impact of heavy metal contaminated sediment on benthic macroinvertebrate communities in tropical streams. Sci. Total Environ. 572 147-156. https://doi.org/10.1016/j.scitotenv.2016.07.204 [ Links ]
BERE T and NYAMUPINGIDZA B (2014) Use of biological monitoring tools beyond their country of origin: a case study of the South African Scoring System Version 5 (SASS5). Hydrobiologia 722 223-232. https://doi.org/10.1007/s10750-013-1702-7 [ Links ]
BRESSLER DW, STRIBLING JB, PAUL MJ and HICKS MB (2006) Stressor tolerance values for benthic macroinvertebrates in Mississippi. Hydrobiologia 573 155-172. https://doi.org/10.1007/s10750-006-0266-1 [ Links ]
BUNN SE and ARTHINGTON AH (2002) Basic principles and ecological consequences of altered flow regimes for aquatic biodiversity. Environ. Manage. 30 492-507. https://doi.org/10.1007/s00267-002-2737-0 [ Links ]
CAO Y, BARK AW and WILLIAMS WP (1996) Measuring the responses of macroinvertebrate communities to water pollution: a comparison of multivariate approaches, biotic and diversity indices. Hydrobiologia. 341 1-19. https://doi.org/10.1007/BF00012298 [ Links ]
CAO Y and HAWKINS CP (2011) The comparability of bioassessments: a review of conceptual and methodological issues. J. N. Am. Benth. Soc. 30 680-701. https://doi.org/10.1899/10-067.1 [ Links ]
CHAKONA A and MARSHALL B (2008) A preliminary assessment of the impact of forest conversion from natural to pine plantation on macroinvertebrate communities in two mountain streams in Zimbabwe. Afr. J. Aquat. Sci. 33 115-124. https://doi.org/10.2989/AJAS.2008.33.2.2.499 [ Links ]
CHAKONA A, PHIRI C, CHINAMARINGA T and MULLER N (2009) Changes in biota along a dry-land river in northwestern Zimbabwe: declines and improvements in river health related to land use. Aquat. Ecol. 43 1095-1106. https://doi.org/10.1007/s10452-008-9222-7 [ Links ]
CHAKONA A, PHIRI C, MAGADZA C and BRENDONCK L (2008) The influence of habitat structure and flow permanence on macroinvertebrate assemblages in temporary rivers in northwestern Zimbabwe. Hydrobiologia. 607 199-209. https://doi.org/10.1007/s10750-008-9391-3 [ Links ]
CHUTTER FM (1994) The rapid biological assessment of streams and river water quality by means of macroinvertebrate communities in South Africa. In: Uys MC (ed.) Classification of rivers and environmental health indicators. WRC Report No. TT 63/94. Water Research Commission, Pretoria. [ Links ]
CHUTTER FM (1998) Research on the rapid biological assessment of water quality impacts in streams and rivers. WRC Report No. 422/1/98. Water Research Commission, Pretoria. [ Links ]
CLARKE RT, FURSE MT, GUNN RJM, WINDER JM and WRIGHT JF (2002) Sampling variation in macroinvertebrate data and implications for river quality indices. Freshwater Biol. 47 1735-1751. https://doi.org/10.1046/j.1365-2427.2002.00885.x [ Links ]
COLLIER KJ (2008) Average score per metric: an alternative metric aggregation method for assessing wadeable stream health. N. Zeal. J. Mar. Freshwater Res. 42 367-378. https://doi.org/10.1080/00288330809509965 [ Links ]
DAHM V, HERING D, NEMITZ D, GRAF W, SCHMIDT-KLOIBER A, LEITNER P, MELCHER A and FELD CK (2013) Effects of physico-chemistry, land use and hydromorphology on three riverine organism groups: a comparative analysis with monitoring data from Germany and Austria. Hydrobiologia. 704 389-415. https://doi.org/10.1007/s10750-012-1431-3 [ Links ]
DALU T, CLEGG B and NHIWATIWA T (2012) Macroinvertebrate communities associated with littoral zone habitats and the influence of environmental factors in Malilangwe Reservoir, Zimbabwe. Knowl. Manage. Aquat. Ecosyst. 406 06 15 pp. https://doi.org/10.1051/kmae/2012023 [ Links ]
DE MOOR IJ, DAY JA and DE MOOR FC (2003a) Guides to the Freshwater Invertebrates of Southern Africa. Volume 7: Insecta I: Ephemeroptera, Odonata and Plecoptera. WRC Report No. TT 207/03. Water Research Commission, Pretoria. [ Links ]
DE MOOR IJ, DAY JA and DE MOOR FC (2003b) Guides to the Freshwater Invertebrates of Southern Africa. Volume 8: Insecta II: Hemiptera, Megaloptera, Neuroptera, Trichoptera and Lepidoptera. WRC Report No. TT 214/03. Water Research Commission, Pretoria. [ Links ]
DICKENS CW and GRAHAM P (2002) The South African Scoring System (SASS) version 5 rapid bioassessment method for rivers. Afr. J. Aquat. Sci. 27 1-10. https://doi.org/10.2989/16085914.2002.9626569 [ Links ]
DOLÉDEC S and STATZNER B (2010) Responses of freshwater biota to human disturbances: contribution of J-NABS to developments in ecological integrity assessments. J. N. Am. Benth. Soc. 29 286-311. https://doi.org/10.1899/08-090.1 [ Links ]
DUBE T, MAKAKA C and SIBANDA Z (2010) An assessment of the effect of industrial and sewage effluent on aquatic invertebrates: a case study of a southern urban stream, Zimbabwe. J. Sustainable Dev. 3 210. https://doi.org/10.5539/jsd.v3n2p210 [ Links ]
ELLIOTT SA, GUÉRIN L, PESCH R, SCHMITT P, MEAKINS B, VINA-HERBON C, GONZÁLEZ-IRUSTA JM, DE LA TORRIENTE A and SERRANO A (2018) Integrating benthic habitat indicators: Working towards an ecosystem approach. Mar. Polic. 90 88-94. https://doi.org/10.1016/j.marpol.2018.01.003 [ Links ]
EUROPEAN COMMISSION 2000 Directive 2000/60/EC of the European Parliament and Council, establishing a framework for Community action in the field of water policy. Official J. Eur. Commun. 327 1-72. [ Links ]
FELD CK, BELLO F and DOLÉDEC S (2014) Biodiversity of traits and species both show weak responses to hydromorphological alteration in lowland river macroinvertebrates. Freshwater Biol. 59 233-248. https://doi.org/10.1111/fwb. 12260 [ Links ]
GALLARDO B, GASCON S, QUINTANA X and COMÍN FA (2011) How to choose a biodiversity indicator-Redundancy and complementarity of biodiversity metrics in a freshwater ecosystem. Ecol. Indic. 11 1177-1184. https://doi.org/10.1016/j.ecolind.2010.12.019 [ Links ]
GERBER A and GABRIEL MJM (2002) Aquatic Invertebrates of South African Rivers: Field Guide. Resource Quality Services, Department of Water Affairs and Forestry, Pretoria. [ Links ]
GONÇALVES FB and MENEZES MSD (2011) A comparative analysis of biotic indices that use macroinvertebrates to assess water quality in a coastal river of Paraná state, southern Brazil. Biota Neotrop. 11 27-36. https://doi.org/10.1590/S1676-06032011000400002 [ Links ]
GORDON A, GRIFFIN N and PALMER C (2015) The relationship between concurrently measured SASS (South African Scoring System) and turbidity data archived in the South African River Health Programme's Rivers Database. Water SA. 41 21-26. https://doi.org/10.4314/wsa.v41i1.4 [ Links ]
GRATWICKE B (1998) The effect of season on a biotic water quality index: a case study of the Yellow Jacket and Mazowe rivers, Zimbabwe. South. Afr. J. Aquat. Sci. 24 24-35. https://doi.org/10.1080/10183469.1998.9631409 [ Links ]
HAWKINS CP, CAO Y and ROPER B (2010) Method of predicting reference condition biota affects the performance and interpretation of ecological indices. Freshwater Biol. 55 1066-1085. https://doi.org/10.1111/j.1365-2427.2009.02357.x [ Links ]
HERING D, FELD CK, MOOG O and OFENBÖCK T (2006) Cook book for the development of a multimetric index for biological condition of aquatic ecosystems: experiences from the European AQEM and STAR projects and related initiatives. Hydrobiologia. 566 311-324. https://doi.org/10.1007/s10750-006-0087-2 [ Links ]
HILSENHOFF WL (1987) An improved biotic index of organic stream pollution. Great Lakes Entomol. 20 31-40. [ Links ]
HODKINSON ID and JACKSON JK (2005) Terrestrial and aquatic invertebrates as bioindicators for environmental monitoring, with particular reference to mountain ecosystems. Environ. Manage. 35 649-666. https://doi.org/10.1007/s00267-004-0211-x [ Links ]
HUMPHREY CL, STOREY AW and THURTELL L (2000) AUSRIVAS: operator sample processing errors and temporal variability- implications for model sensitivity. In: Wright JF, Sutcliffe DW and Furse MT (eds.) Assessing the Biological Quality of Fresh Waters. Freshwater Biological Association, Ambleside. [ Links ]
HYSLOP E and HUNTE-BROWN M (2012) Longitudinal variation in the composition of the benthic macroinvertebrate fauna of a typical North coast Jamaican river. Rev. Biol. Trop. 60 291-303. https://doi.org/10.15517/rbt.v60i1.2762 [ Links ]
JIRKA AM and CARTER MJ (1975) Micro semiautomated analysis of surface and waste waters for chemical oxygen demand. Anal. Chem. 47 1397-1402. https://doi.org/10.1021/ac60358a004 [ Links ]
JUN Y-C, WON D-H, LEE S-H, KONG D-S and HWANG S-J (2012) A multimetric benthic macroinvertebrate index for the assessment of stream biotic integrity in Korea. Int. J. Environ. Res. Public Health. 9 3599-3628. https://doi.org/10.3390/ijerph9103599 [ Links ]
KABORÉ I, MOOG O, ALP M, GUENDA W, KOBLINGER T, MANO K, OUÉDA A, OUÉDRAOGO R, TRAUNER D and MELCHER A (2016) Using macroinvertebrates for ecosystem health assessment in semi-arid streams of Burkina Faso. Hydrobiologia. 766 57-74. https://doi.org/10.1007/s10750-015-2443-6 [ Links ]
KASANGAKI A, CHAPMAN LJ and BALIRWA J (2008) Land use and the ecology of benthic macroinvertebrate assemblages of high-altitude rainforest streams in Uganda. Freshwater Biol. 53 681-697. https://doi.org/10.1111/j.1365-2427.2007.01925.x [ Links ]
KILONZO F, MASESE FO, VAN GRIENSVEN A, BAUWENS W, OBANDO J and LENS PN (2014) Spatial-temporal variability in water quality and macro-invertebrate assemblages in the Upper Mara River basin, Kenya. Phys. Chem. Earth A/B/C. 67 93-104. https://doi.org/10.1016/j.pce.2013.10.006 [ Links ]
KLEMM DJ, BLOCKSOM KA, THOENY WT, FULK FA, HERLIHY AT, KAUFMANN PR and CORMIER SM (2002) Methods development and use of macroinvertebrates as indicators of ecological conditions for streams in the mid-Atlantic highlands region. Environ. Monit. Assess. 78 169-212. https://doi.org/10.1023/A:1016363718037 [ Links ]
KOLKWITZ R and MARSSON M (1909) Ökologie der tierischen Saprobien. Beitrâge zur Lehre von der biologischen Gewâsser-beurteilung. Int. Rev. Hydrobiol. 2 126-152. https://doi.org/10.1002/iroh.19090020108 [ Links ]
LAKEW A and MOOG O (2015) A multimetric index based on benthic macroinvertebrates for assessing the ecological status of streams and rivers in central and southeast highlands of Ethiopia. Hydrobiologia. 751 229-242. https://doi.org/10.1007/s10750-015-2189-1 [ Links ]
LORENZ S, LESZINSKI M and GRAEBER D (2016) Meander reconnection method determines restoration success for macro-invertebrate communities in a German lowland river. Int. Rev. Hydrobiol. 101 123-131. https://doi.org/10.1002/iroh.201501823 [ Links ]
MASESE F and RABURU P (2017) Improving the performance of the EPT Index to accommodate multiple stressors in Afrotropical streams. Afr. J. Aquat. Sci. 42 219-233. https://doi.org/10.2989/16085914.2017.1392282 [ Links ]
MASESE FO, KITAKA N, KIPKEMBOI J, GETTEL GM, IRVINE K and MCCLAIN ME (2014) Litter processing and shredder distribution as indicators of riparian and catchment influences on ecological health of tropical streams. Ecol. Indic. 46 23-37. https://doi.org/10.1016/j.ecolind.2014.05.032 [ Links ]
MERRITT RW, CUMMINS KW and HAUER F (1996) Trophic Relationships of Macroinvertebrates, Academic Press, California. [ Links ]
MHLANGA L and SIZIBA N (2006) The association between invertebrates and macrophytes in a tropical reservoir, Lake Kariba, Zimbabwe: a preliminary survey. Afr. J. Aquat. Sci. 31 271-274. https://doi.org/10.2989/16085910609503896 [ Links ]
MINAYA V, MCCLAIN ME, MOOG O, OMENGO F and SINGER GA (2013) Scale-dependent effects of rural activities on benthic macro-invertebrates and physico-chemical characteristics in headwater streams of the Mara River, Kenya. Ecol. Indic. 32 116-122. https://doi.org/10.1016/j.ecolind.2013.03.011 [ Links ]
MONAGHAN KA (2016) Four Reasons to Question the Accuracy of a Biotic Index; the Risk of Metric Bias and the Scope to Improve Accuracy. PloS One 11 e0158383. https://doi.org/10.1371/journal.pone.0158383 [ Links ]
MOYO N and PHIRI C (2002) The degradation of an urban stream in Harare, Zimbabwe. Afr. J. Ecol. 40 401-406. https://doi.org/10.1046/j.1365-2028.2002.00399.x [ Links ]
MOYO N and RAPATSA M (2016) Impact of urbanization on the ecology of Mukuvisi River, Harare, Zimbabwe. Phys. Chem. Earth A/B/C. 92 14-19. https://doi.org/10.1016/j.pce.2015.09.007 [ Links ]
MUDYAZHEZHA S and KANHUKAMWE R (2014) Environmental Monitoring of the Effects of Conventional and Artisanal Gold Mining on Water Quality in Ngwabalozi River, Southern Zimbabwe. Int. J. Eng. 4 8269. https://doi.org/10.11648/j.ijema.20140202.20 [ Links ]
MUGANDANI R, WUTA M, MAKARAU A and CHIPINDU B (2012) Re-classification of agro-ecological regions of Zimbabwe in conformity with climate variability and change. Afr. Crop Sci. J. 20 361-369. [ Links ]
MWEDZI T, BERE T and MANGADZE T (2016a) Macroinvertebrate assemblages in agricultural, mining, and urban tropical streams: implications for conservation and management. Environ. Sci. Pollut. Res. 23 11181-11192. https://doi.org/10.1007/s11356-016-6340-y [ Links ]
MWEDZI T, BERE T, SIZIBA N, MANGADZE T and BANGIRA C (2016b) Longitudinal macroinvertebrate assemblages in contrasting discontinuities: the effects of damming in tropical streams. African J. Ecol. 54 183-194. https://doi.org/10.1111/aje.12281 [ Links ]
MWEDZI T, ZIMUNYA TG, BERE T, TARAKINI T and MANGADZE T (2017) Disentangling and ranking the influence of multiple stressors on macroinvertebrate communities in a tropical river system. Int. Rev. Hydrobiol. 2017 1-11. [ Links ]
NDEBELE-MURISA MZIME R (2012) Biological monitoring and pollution assessment of the Mukuvisi River, Harare, Zimbabwe. Lakes Reservoirs: Res. Manage. 17 73-80. https://doi.org/10.1111/j.1440-1770.2012.00497.x [ Links ]
NHIWATIWA T, BRENDONCK L and DALU T (2017a) Understanding factors structuring zooplankton and macroinvertebrate assemblages in ephemeral pans. Limnologica. 64 11-19. https://doi.org/10.1016/j.limno.2017.04.003 [ Links ]
NHIWATIWA T, DALU T and BRENDONCK L (2017b) Impact of irrigation based sugarcane cultivation on the Chiredzi and Runde Rivers quality, Zimbabwe. Sci. Total Environ. 587 316-325. https://doi.org/10.1016/j.scitotenv.2017.02.155 [ Links ]
NHIWATIWA T, DE BIE T, VERVAEKE B, BARSON M, STEVENS M, VANHOVE MP and BRENDONCK L (2009) Invertebrate communities in dry-season pools of a large subtropical river: patterns and processes. Hydrobiologia. 630 169-186. https://doi.org/10.1007/s10750-009-9790-0 [ Links ]
ODUME O, MULLER W, ARIMORO F and PALMER C (2012) The impact of water quality deterioration on macroinvertebrate communities in the Swartkops River, South Africa: a multimetric approach. Afr. J. Aquat. Sci. 37 191-200. https://doi.org/10.2989/16085914.2012.670613 [ Links ]
PHIRI C (2000) An assessment of the health of two rivers within Harare, Zimbabwe, on the basis of macroinvertebrate community structure and selected physicochemical variables. South. Afr. J. Aquat. Sci. 25 134-145. https://doi.org/10.2989/160859100780177677 [ Links ]
PHIRI C, CHAKONA A and DAY J (2011) The effect of plant density on epiphytic macroinvertebrates associated with a submerged macrophyte, Lagarosiphon ilicifolius Obermeyer, in Lake Kariba, Zimbabwe. Afr. J. Aquat. Sci. 36 289-297. https://doi.org/10.2989/16085914.2011.636907 [ Links ]
RAMÍREZ A and GUTIÉRREZ-FONSECA PE (2014) Functional feeding groups of aquatic insect families in Latin America: a critical analysis and review of existing literature. Revista de Biol. Trop. 62 155-167. https://doi.org/10.15517/rbt.v62i0.15785 [ Links ]
SINGH PK and SAXENA S (2018) Towards developing a river health index. Ecol. Indic. 85 999-1011. https://doi.org/10.1016/j.ecolind.2017.11.059 [ Links ]
SIZIBA N (2017) Effects of damming on the ecological condition of urban wastewater polluted rivers. Ecol. Eng. 102 234-239. https://doi.org/10.1016/j.ecoleng.2017.02.019 [ Links ]
SIZIBA N, MATSHISELA A, MWEDZI T and BERE T (2017) Macroinvertebrate communities in riverine systems of buffer areas of protected wildland, rangeland and city areas: implications for conservation of riverine systems on urbanising watersheds. Environ. Sci. Pollut. Res. 2017 1-13. https://doi.org/10.1007/s11356-017-0487-z [ Links ]
SURIANO MT, FONSECA-GESSNER AA, ROQUE FO and FROEHLICH CG (2011) Choice of macroinvertebrate metrics to evaluate stream conditions in Atlantic Forest, Brazil. Environ. Monit. Assess. 175 87-101. https://doi.org/10.1007/s10661-010-1495-3 [ Links ]
UTETE B and KUNHE RM (2013) Ecological integrity of a peri-urban river system, Chiraura River in Zimbabwe. J. Water Resour. Ocean Sci. 2 56-61. https://doi.org/10.11648/j.wros.20130205.11 [ Links ]
WEIGEL BM, HENNE LJ and MARTÍNEZ-RIVERA LM (2002) Macroinvertebrate-based index of biotic integrity for protection of streams in west-central Mexico. J. N. Am. Benth. Soc. 21 686-700. https://doi.org/10.2307/1468439 [ Links ]
WHITTIER TR, STODDARD JL, LARSEN DP and HERLIHY AT (2007) Selecting reference sites for stream biological assessments: best professional judgment or objective criteria. J. N. Am. Benth. Soc. 26 349-360. https://doi.org/10.1899/0887-3593(2007)26[349:SRSFSB]2.0.CO;2 [ Links ]
 Correspondence:
Tongayi Mwedzi
Email: mrmwedzi@gmail.com
Received: 11 March 2020
Accepted: 2 October 2020

